| Param | Original file | Final file |
|---|---|---|
| Filename | modeM0/AS1A13_017T02_9000006032_44921cztM0_level2.fits | modeM0/AS1A13_017T02_9000006032_44921cztM0_level2_quad_clean.evt |
| Size (bytes) | 490,636,800 | 111,674,880 |
| Size | 467.9 MB | 106.5 MB |
| Events in quadrant A | 5,345,799 | 745,945 |
| Events in quadrant B | 3,589,902 | 771,772 |
| Events in quadrant C | 3,166,909 | 753,167 |
| Events in quadrant D | 5,552,091 | 654,227 |
| Mode SS | |||
|---|---|---|---|
| Quadrant | BADHDUFLAG | Total packets | Discarded packets |
| A | 0 | 134 | 0 |
| B | 0 | 134 | 0 |
| C | 0 | 134 | 0 |
| D | 0 | 134 | 0 |
| Mode M0 | |||
|---|---|---|---|
| Quadrant | BADHDUFLAG | Total packets | Discarded packets |
| A | 0 | 20661 | 2 |
| B | 0 | 14775 | 3 |
| C | 0 | 13818 | 2 |
| D | 0 | 20884 | 2 |
| Mode M9 | |||
|---|---|---|---|
| Quadrant | BADHDUFLAG | Total packets | Discarded packets |
| A | 0 | 11 | 0 |
| B | 0 | 11 | 0 |
| C | 0 | 11 | 0 |
| D | 0 | 11 | 0 |
| Quadrant | Total seconds | Saturated seconds | Saturation percentage |
|---|---|---|---|
| A | 6538 | 158 | 2.416641% |
| B | 6537 | 153 | 2.340523% |
| C | 6537 | 55 | 0.841365% |
| D | 6538 | 423 | 6.469868% |
Noise dominated data is calculated using 1-second bins in cleaned event files. If a bin has >2000 counts, and if more than 50% of those come from <1% of pixels, then it is considered to be noise-dominated and hence unusable.
| Quadrant | # 1 sec bins | Bins with >0 counts | Bins with >2000 counts | High rate bins dominated by noise | Noise dominated (total time) | Noise dominated (detector-on time) | Marked lightcurve |
|---|---|---|---|---|---|---|---|
| A | 7623 | 6539 | 4 | 4 | 0.05% | 0.06% | 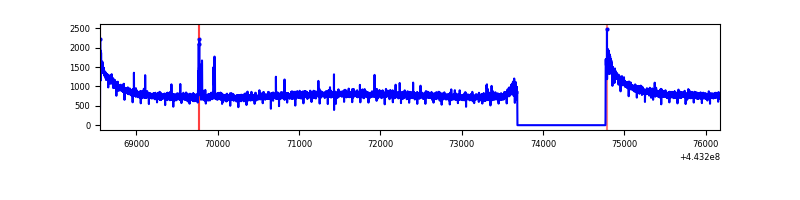 |
| B | 7622 | 6538 | 66 | 66 | 0.87% | 1.01% | 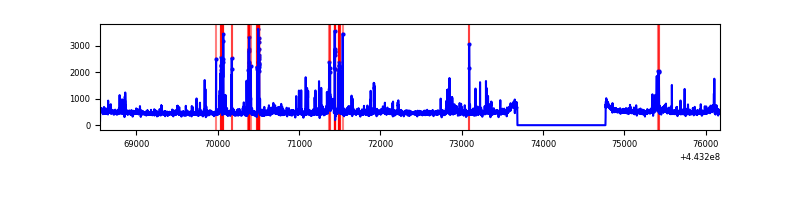 |
| C | 7622 | 6538 | 1 | 1 | 0.01% | 0.02% | 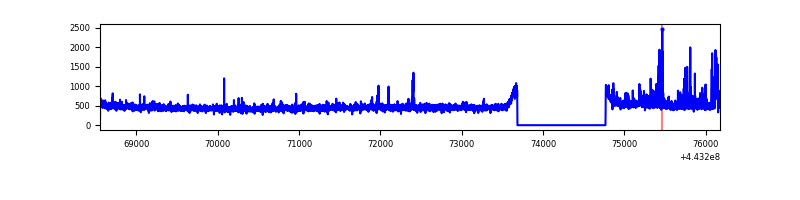 |
| D | 7623 | 6539 | 301 | 301 | 3.95% | 4.60% |  |
Top three noisy pixels from each quadrant. If the there are fewer than three noisy pixels in the level2.evt file, extra rows are filled as -1
| Pixel properties | Quadrant properties | ||||||
|---|---|---|---|---|---|---|---|
| Quadrant | DetID | PixID | Counts | Sigma | Mean | Median | Sigma |
| A | 10 | 83 | 2271777 | 14303.69 | 768 | 752 | 158.8 |
| A | 0 | 247 | 51385 | 318.9 | 768 | 752 | 158.8 |
| A | 7 | 3 | 27280 | 167.08 | 768 | 752 | 158.8 |
| B | 5 | 172 | 124545 | 829.85 | 762 | 740 | 149.2 |
| B | 0 | 183 | 113634 | 756.72 | 762 | 740 | 149.2 |
| B | 15 | 36 | 103989 | 692.07 | 762 | 740 | 149.2 |
| C | 0 | 207 | 138433 | 773.48 | 761 | 766 | 178.0 |
| C | 1 | 3 | 20797 | 112.54 | 761 | 766 | 178.0 |
| C | 3 | 233 | 16633 | 89.15 | 761 | 766 | 178.0 |
| D | 1 | 52 | 895477 | 4861.65 | 742 | 720 | 184.0 |
| D | 2 | 249 | 457297 | 2480.81 | 742 | 720 | 184.0 |
| D | 13 | 249 | 438833 | 2380.48 | 742 | 720 | 184.0 |
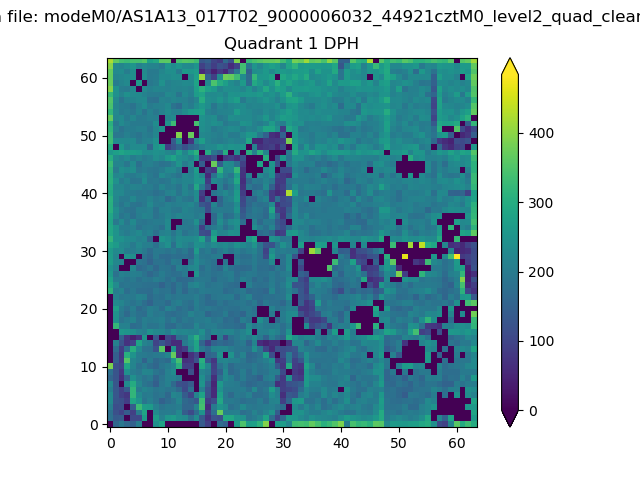
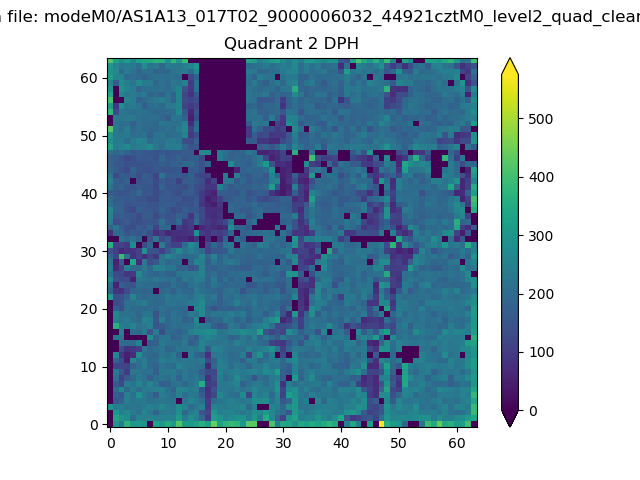
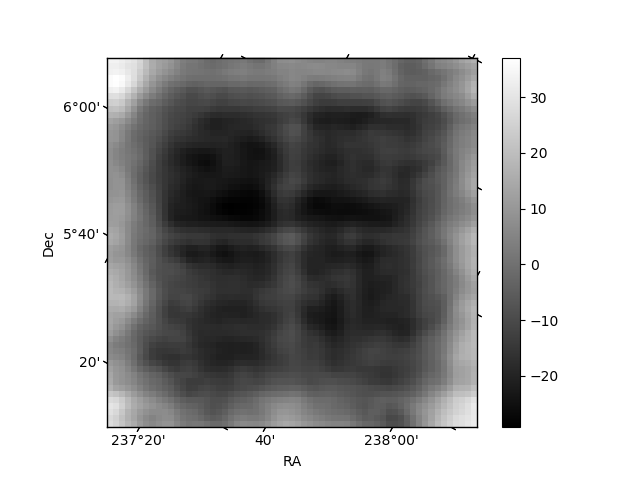
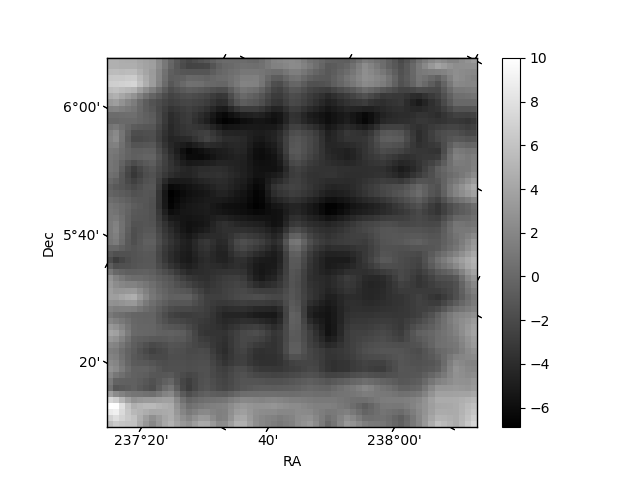
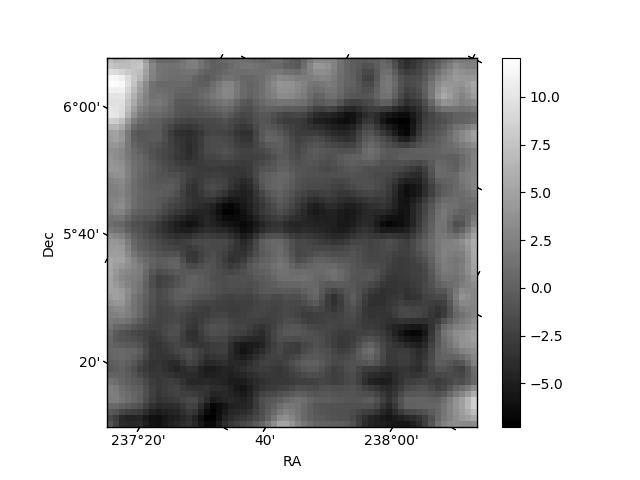
Histogram calculated using DETX and DETY for each event in the final _common_clean file
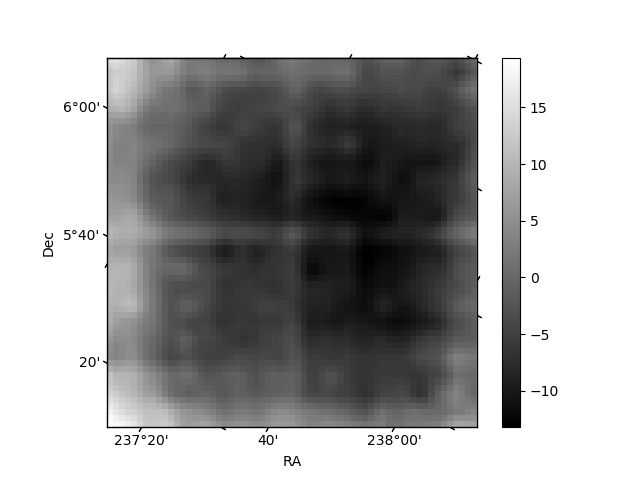
| Quadrant A | 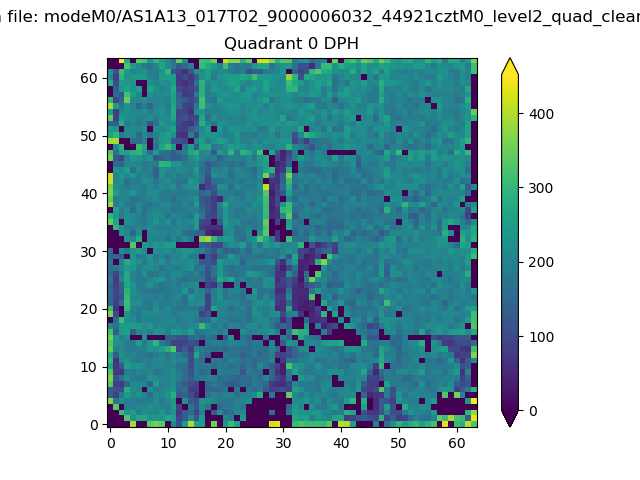 |
 |
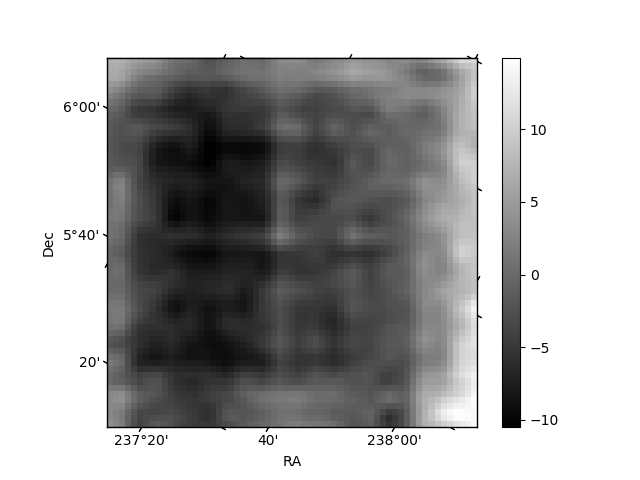
Quadrant B |
|---|---|---|---|
| Quadrant D | 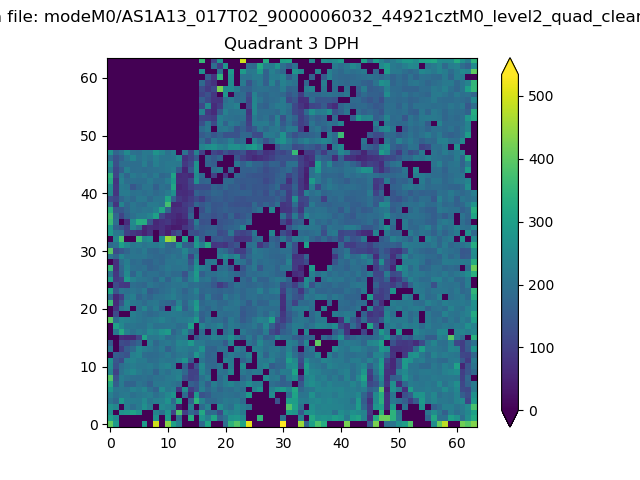 |
 |
Quadrant C |
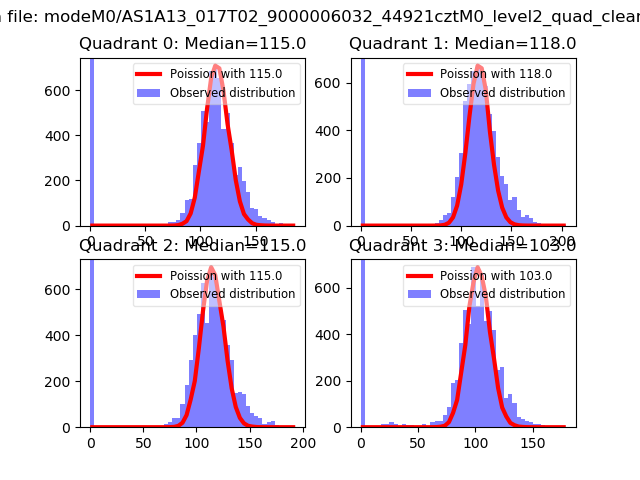
| Plot type | Count rate plots | Images |
|---|---|---|
| Comparison with Poisson distribution Blue bars denote a histogram of data divided into 1 sec bins. Red curve is a Poisson curve with rate = median count rate of data. |
 |
 |
| Quadrant-wise count rates Data is divided into 100 sec bins |
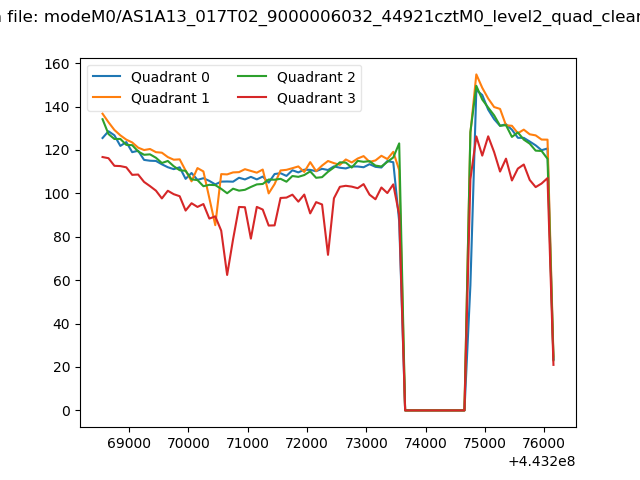 |
|
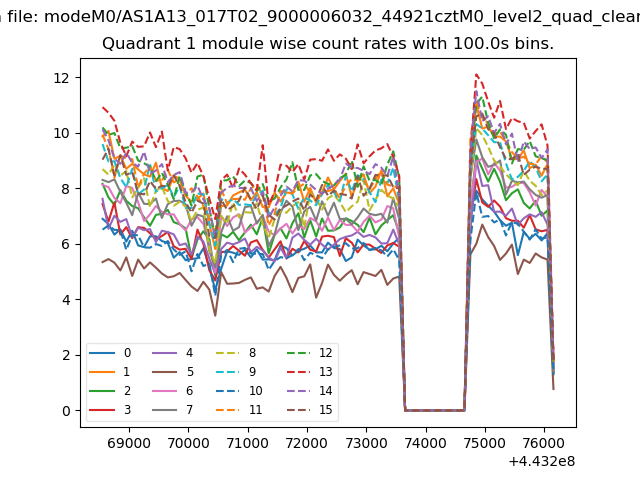
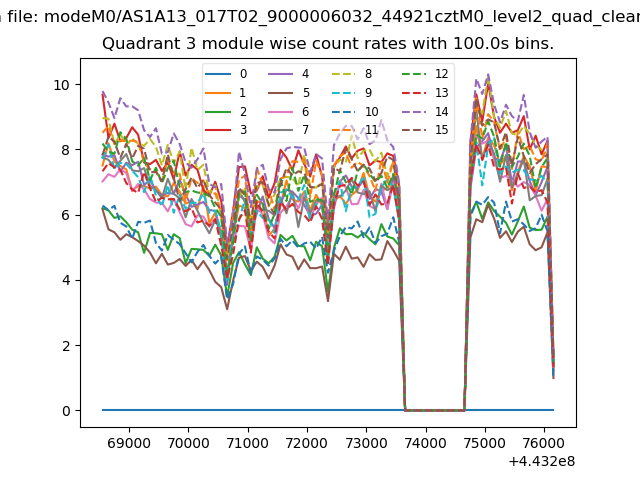
| Module-wise count rates for Quadrant A Data is divided into 100 sec bins |
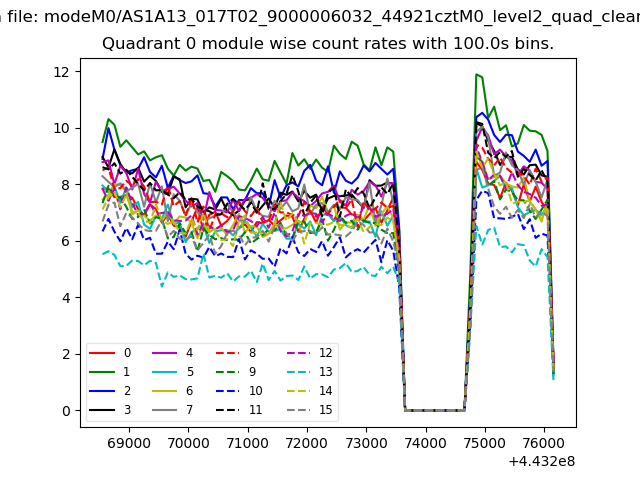 |
 |
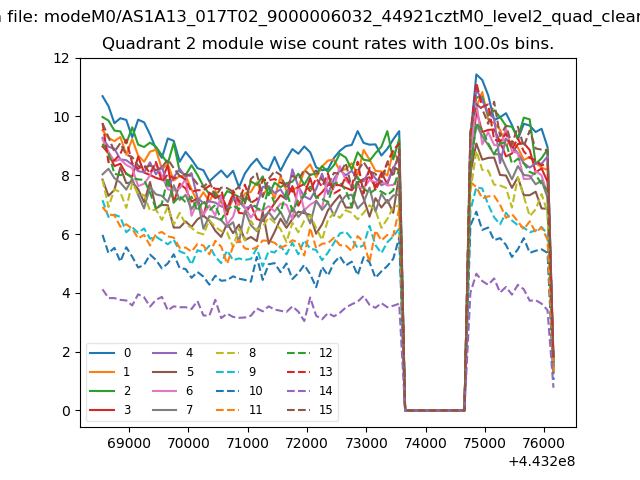
| Module-wise count rates for Quadrant B Data is divided into 100 sec bins |
 |
 |
| Module-wise count rates for Quadrant C Data is divided into 100 sec bins |
 |
 |
| Module-wise count rates for Quadrant D Data is divided into 100 sec bins |
 |
 |
| Parameter | Plot |
|---|---|
| CZT HV Monitor |  |
| D_VDD | 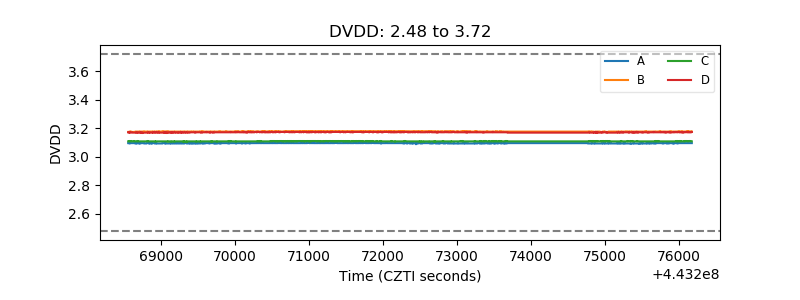 |
| Temperature 1 | 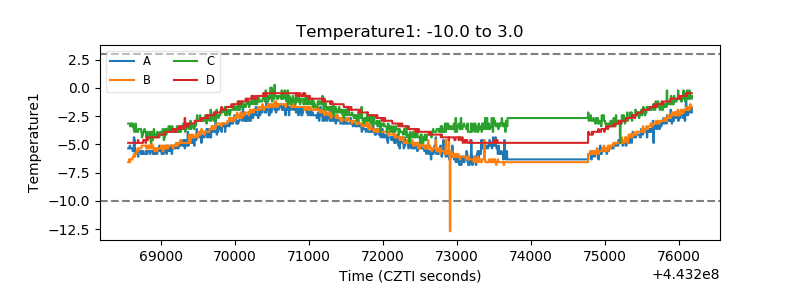 |
| Veto HV Monitor | 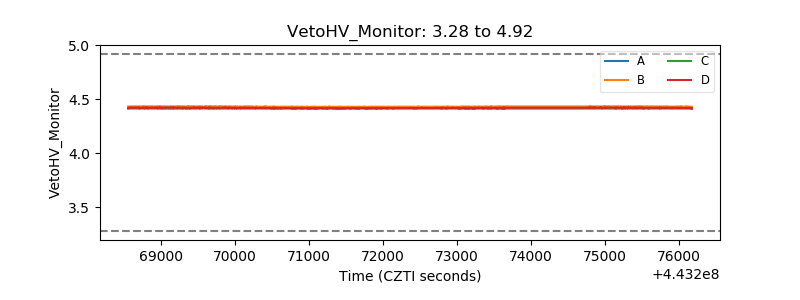 |
| Veto LLD | 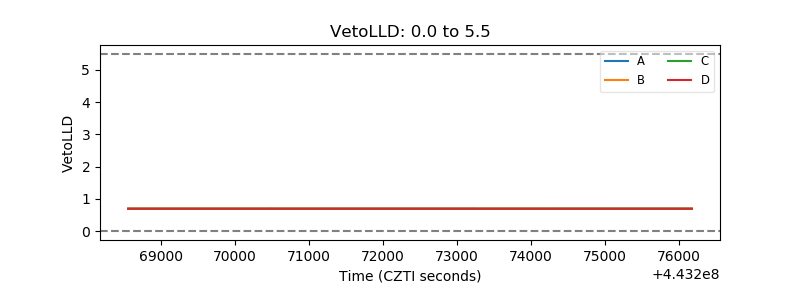 |
| Alpha Counter | 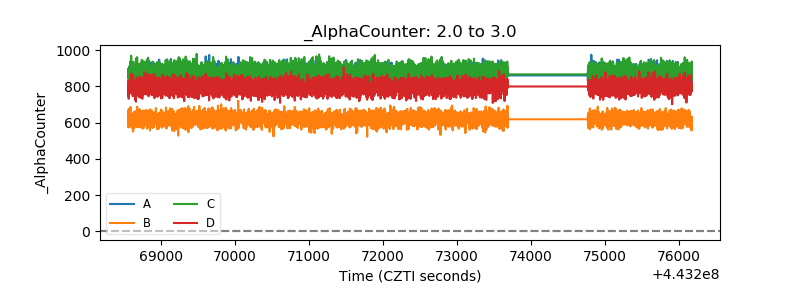 |
| _CPM_Rate | 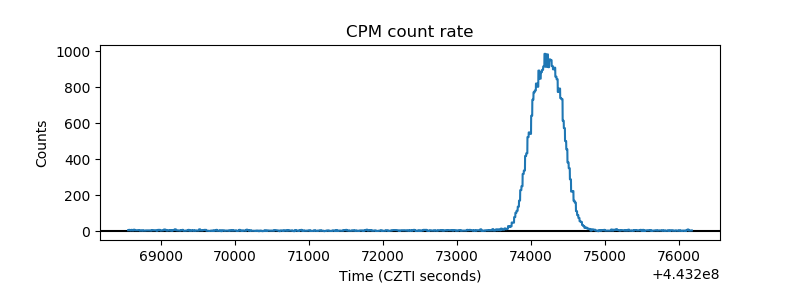 |
| CZT Counter | 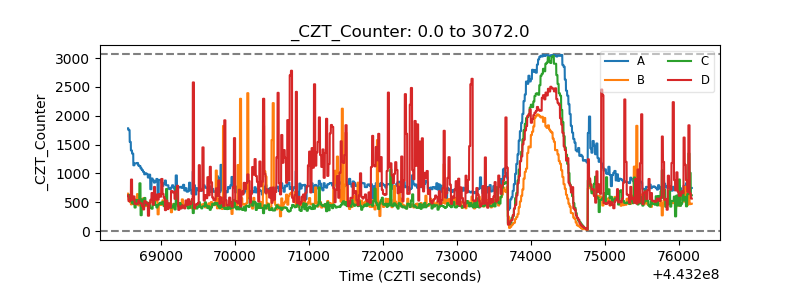 |
| +2.5 Volts monitor | 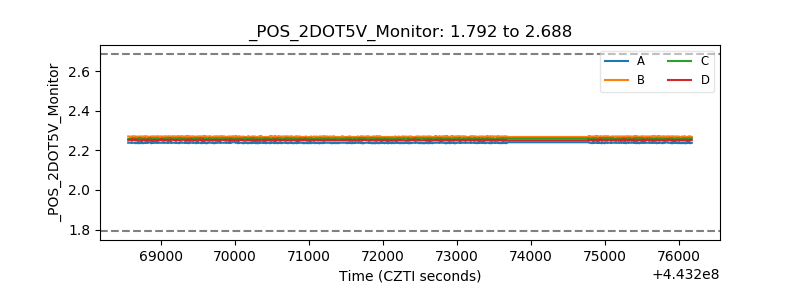 |
| +5 Volts monitor | 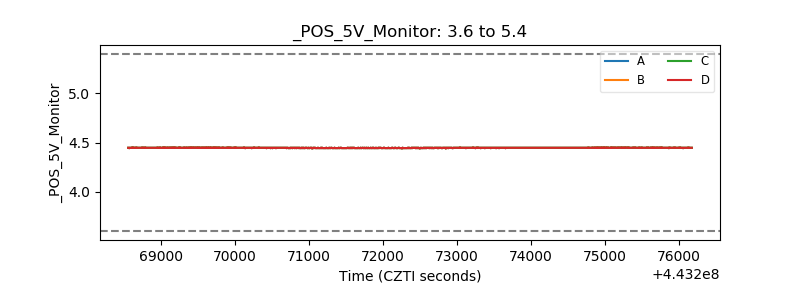 |
| _ROLL_ROT | 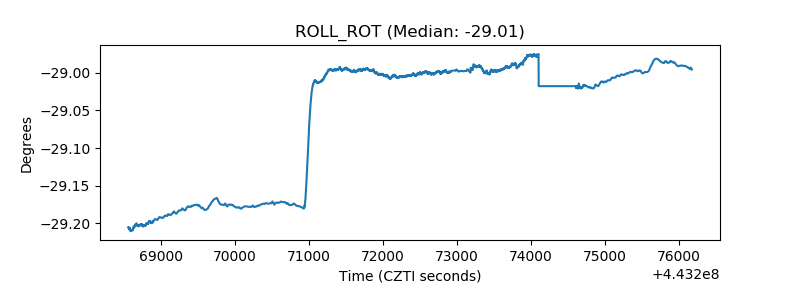 |
| _Roll_DEC | 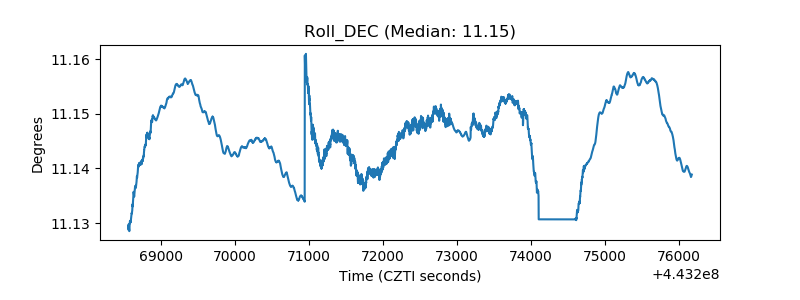 |
| _Roll_RA | 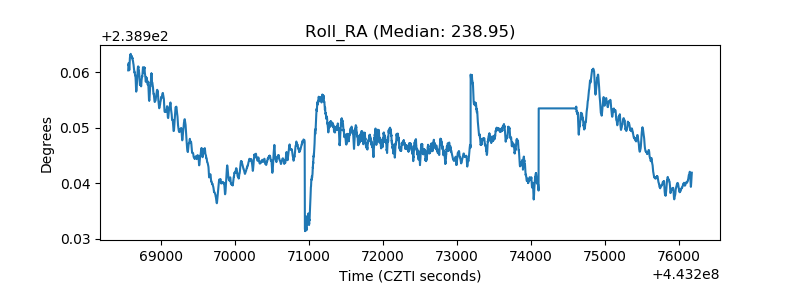 |
| Veto Counter | 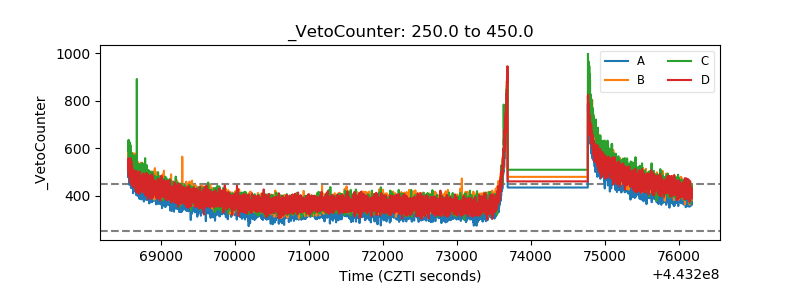 |