| Param | Original file | Final file |
|---|---|---|
| Filename | modeM0/AS1A13_017T02_9000006032_44922cztM0_level2.fits | modeM0/AS1A13_017T02_9000006032_44922cztM0_level2_quad_clean.evt |
| Size (bytes) | 523,503,360 | 112,991,040 |
| Size | 499.3 MB | 107.8 MB |
| Events in quadrant A | 5,466,665 | 769,848 |
| Events in quadrant B | 4,248,956 | 782,209 |
| Events in quadrant C | 3,265,722 | 773,388 |
| Events in quadrant D | 5,901,909 | 650,405 |
| Mode SS | |||
|---|---|---|---|
| Quadrant | BADHDUFLAG | Total packets | Discarded packets |
| A | 0 | 130 | 0 |
| B | 0 | 130 | 0 |
| C | 0 | 130 | 0 |
| D | 0 | 130 | 0 |
| Mode M0 | |||
|---|---|---|---|
| Quadrant | BADHDUFLAG | Total packets | Discarded packets |
| A | 0 | 20505 | 3 |
| B | 0 | 16695 | 3 |
| C | 0 | 13796 | 3 |
| D | 0 | 21899 | 5 |
| Mode M9 | |||
|---|---|---|---|
| Quadrant | BADHDUFLAG | Total packets | Discarded packets |
| A | 0 | 12 | 0 |
| B | 0 | 13 | 0 |
| C | 0 | 13 | 0 |
| D | 0 | 13 | 0 |
| Quadrant | Total seconds | Saturated seconds | Saturation percentage |
|---|---|---|---|
| A | 6389 | 206 | 3.224292% |
| B | 6389 | 331 | 5.180779% |
| C | 6389 | 83 | 1.299108% |
| D | 6388 | 664 | 10.394490% |
Noise dominated data is calculated using 1-second bins in cleaned event files. If a bin has >2000 counts, and if more than 50% of those come from <1% of pixels, then it is considered to be noise-dominated and hence unusable.
| Quadrant | # 1 sec bins | Bins with >0 counts | Bins with >2000 counts | High rate bins dominated by noise | Noise dominated (total time) | Noise dominated (detector-on time) | Marked lightcurve |
|---|---|---|---|---|---|---|---|
| A | 7564 | 6391 | 2 | 2 | 0.03% | 0.03% | 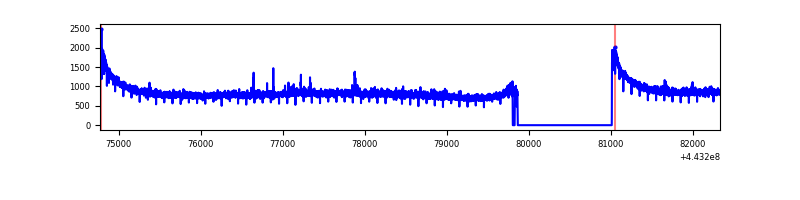 |
| B | 7564 | 6391 | 153 | 153 | 2.02% | 2.39% | 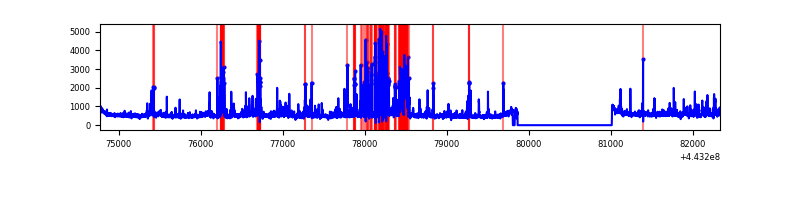 |
| C | 7564 | 6391 | 4 | 4 | 0.05% | 0.06% | 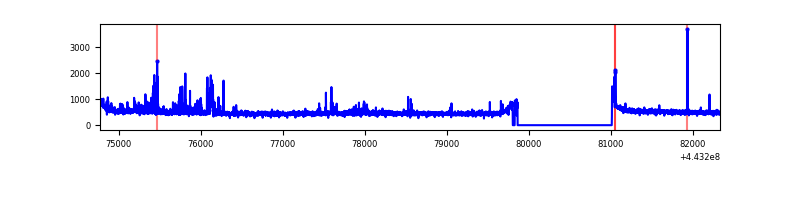 |
| D | 7563 | 6389 | 442 | 442 | 5.84% | 6.92% | 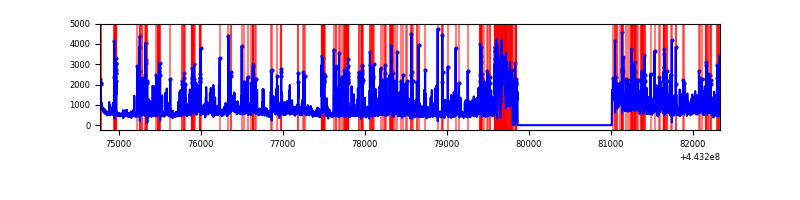 |
Top three noisy pixels from each quadrant. If the there are fewer than three noisy pixels in the level2.evt file, extra rows are filled as -1
| Pixel properties | Quadrant properties | ||||||
|---|---|---|---|---|---|---|---|
| Quadrant | DetID | PixID | Counts | Sigma | Mean | Median | Sigma |
| A | 10 | 83 | 2321767 | 14357.13 | 786 | 772 | 161.7 |
| A | 0 | 247 | 69309 | 423.95 | 786 | 772 | 161.7 |
| A | 7 | 191 | 16698 | 98.51 | 786 | 772 | 161.7 |
| B | 4 | 171 | 618660 | 4134.11 | 774 | 753 | 149.5 |
| B | 0 | 183 | 242499 | 1617.4 | 774 | 753 | 149.5 |
| B | 5 | 172 | 83891 | 556.24 | 774 | 753 | 149.5 |
| C | 0 | 207 | 138669 | 755.02 | 781 | 787 | 182.6 |
| C | 14 | 254 | 27023 | 143.66 | 781 | 787 | 182.6 |
| C | 3 | 233 | 19389 | 101.86 | 781 | 787 | 182.6 |
| D | 1 | 52 | 1014196 | 5391.27 | 745 | 724 | 188.0 |
| D | 2 | 249 | 730944 | 3884.48 | 745 | 724 | 188.0 |
| D | 13 | 249 | 367407 | 1950.61 | 745 | 724 | 188.0 |
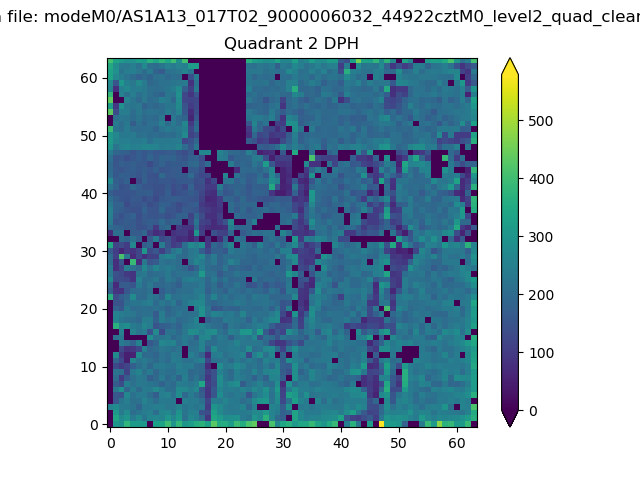
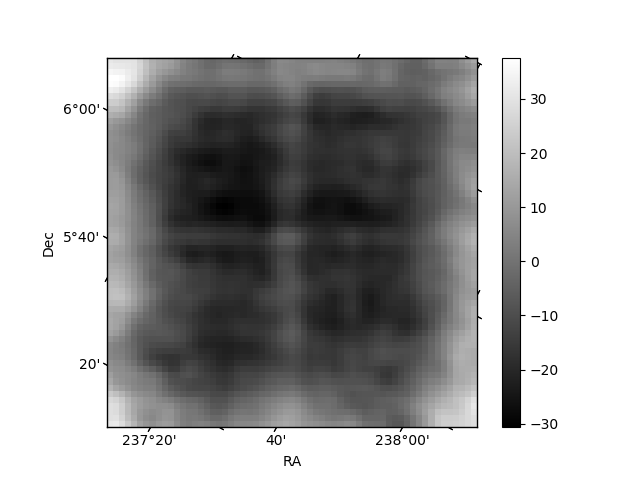
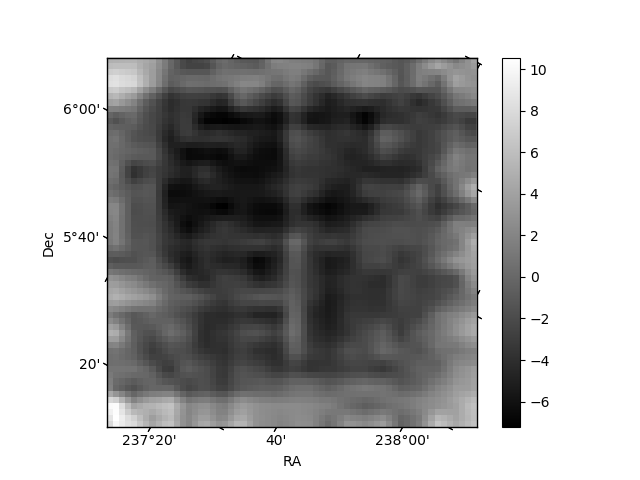
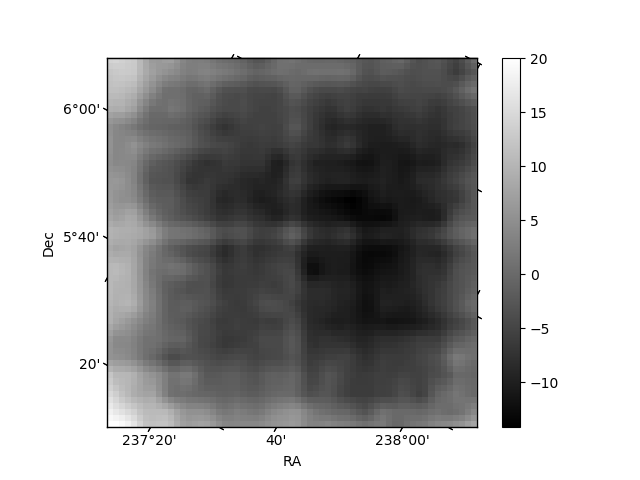
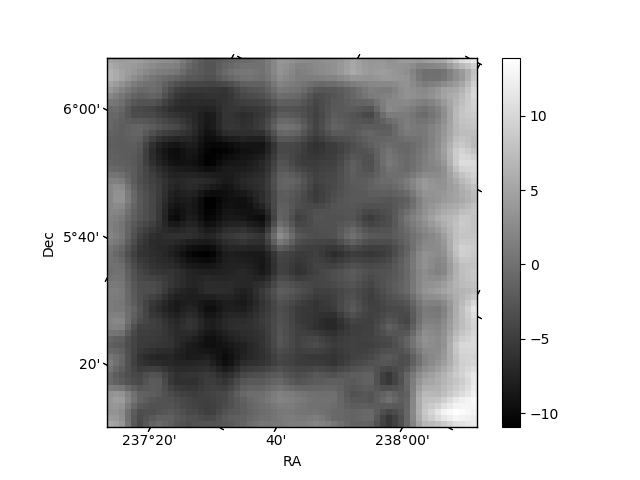
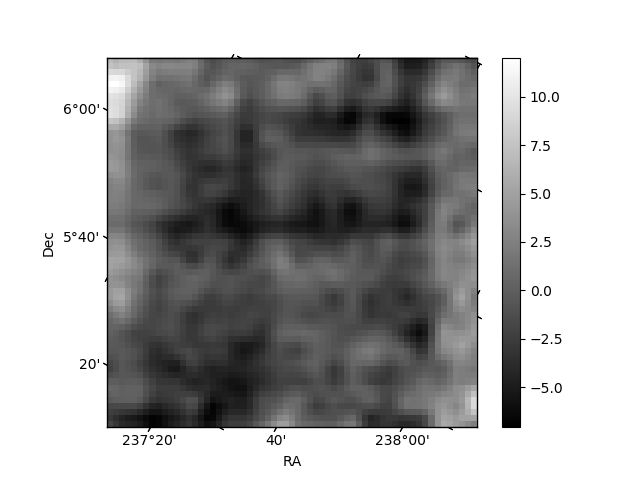
Histogram calculated using DETX and DETY for each event in the final _common_clean file
| Quadrant A | 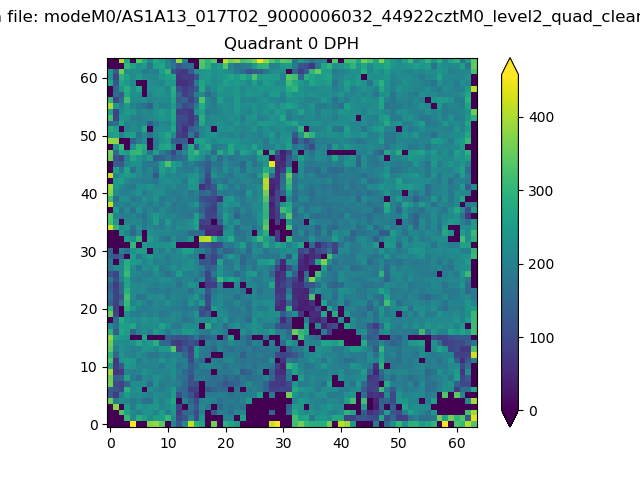 |
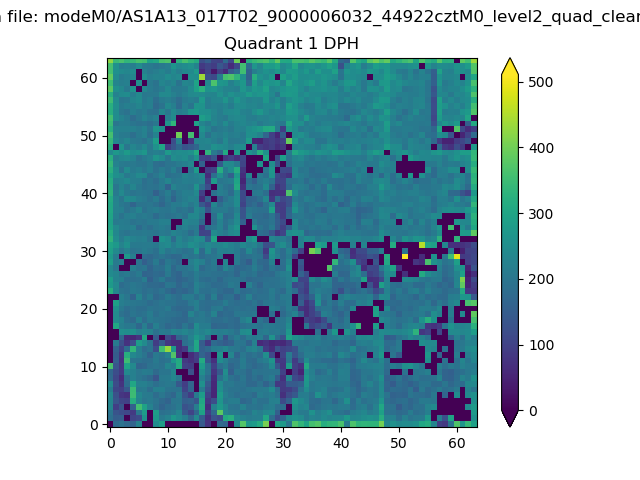 |
Quadrant B |
|---|---|---|---|
| Quadrant D | 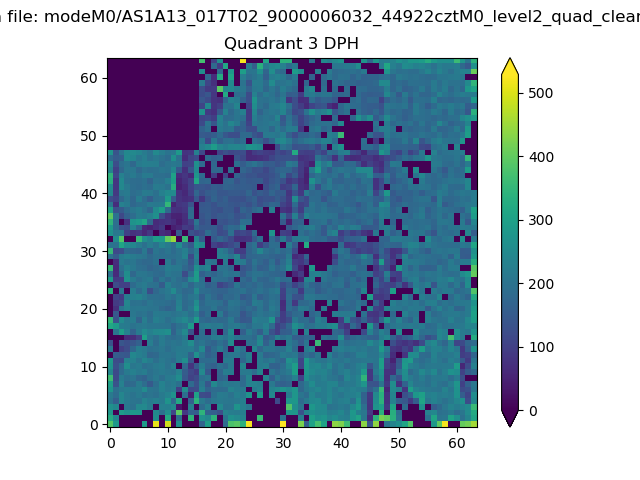 |
 |
Quadrant C |
| Plot type | Count rate plots | Images |
|---|---|---|
| Comparison with Poisson distribution Blue bars denote a histogram of data divided into 1 sec bins. Red curve is a Poisson curve with rate = median count rate of data. |
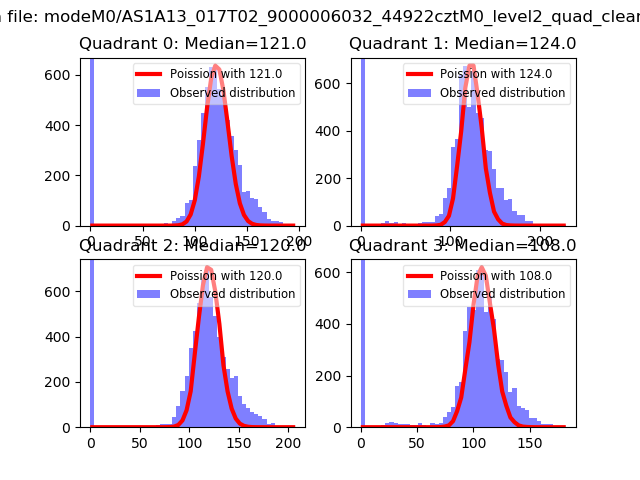 |
 |
| Quadrant-wise count rates Data is divided into 100 sec bins |
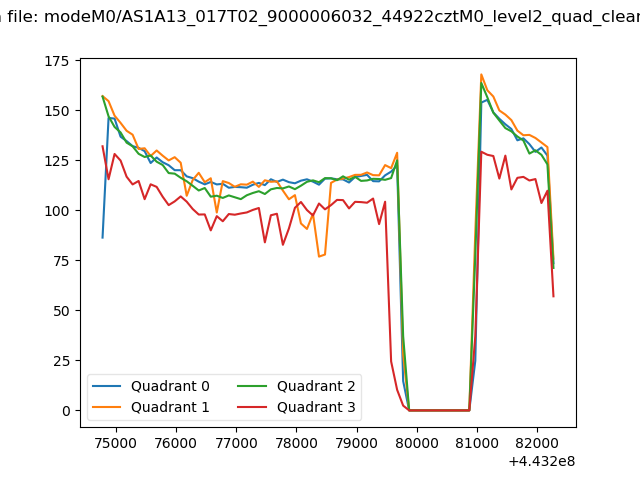 |
|
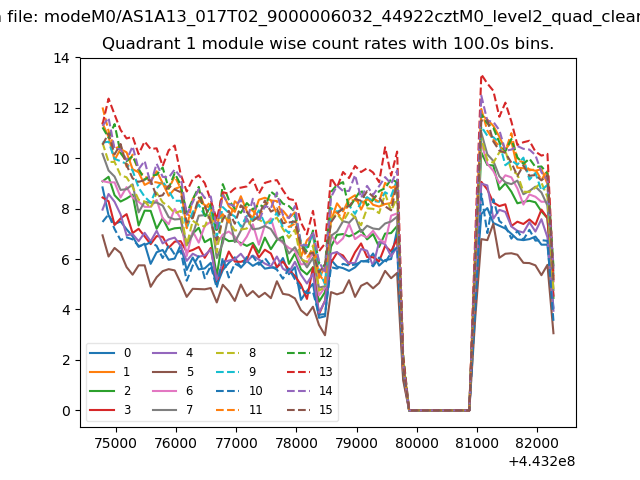
| Module-wise count rates for Quadrant A Data is divided into 100 sec bins |
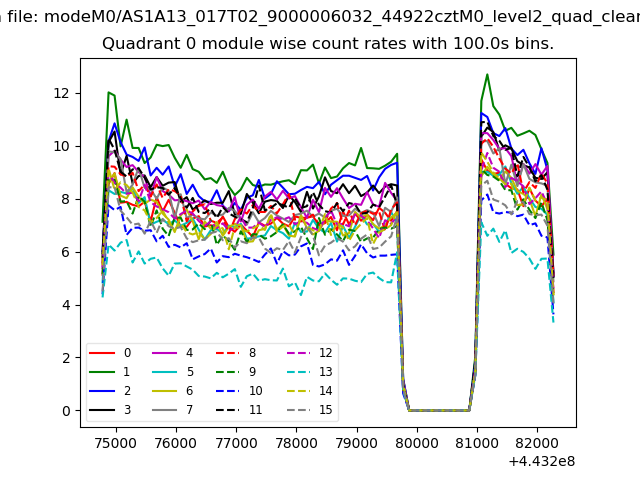 |
 |
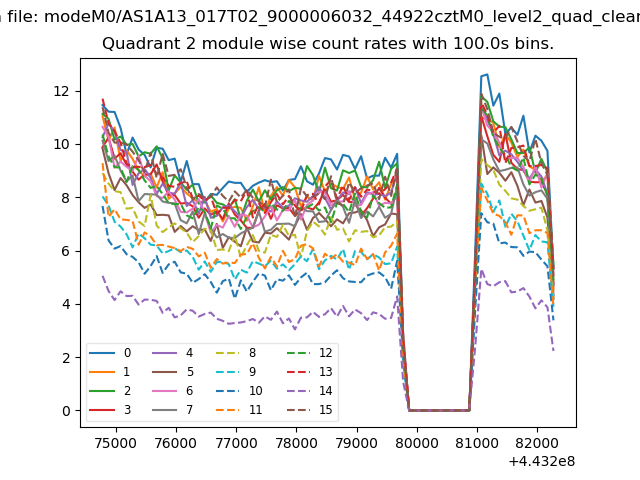
| Module-wise count rates for Quadrant B Data is divided into 100 sec bins |
 |
 |
| Module-wise count rates for Quadrant C Data is divided into 100 sec bins |
 |
 |
| Module-wise count rates for Quadrant D Data is divided into 100 sec bins |
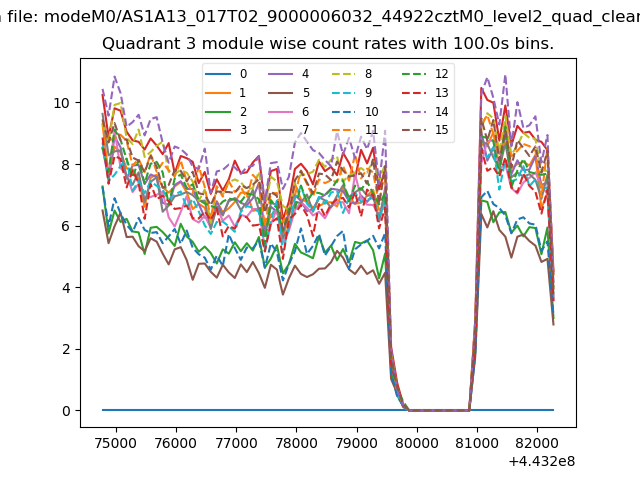 |
 |
| Parameter | Plot |
|---|---|
| CZT HV Monitor | 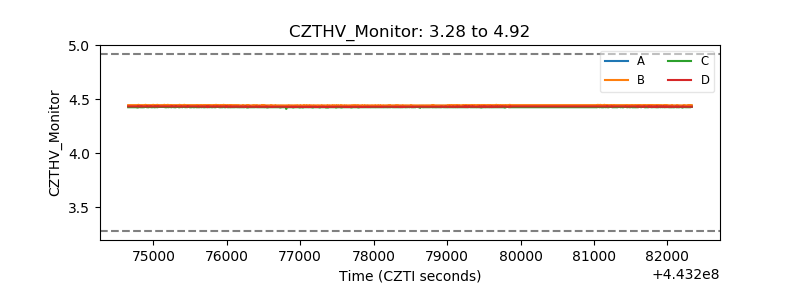 |
| D_VDD | 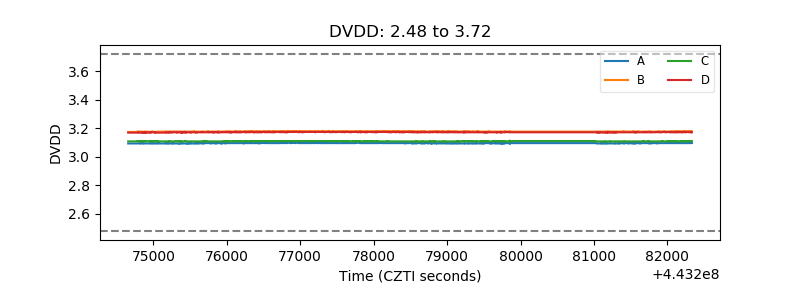 |
| Temperature 1 | 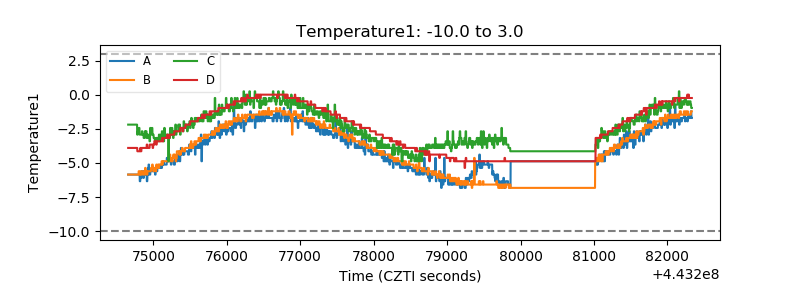 |
| Veto HV Monitor | 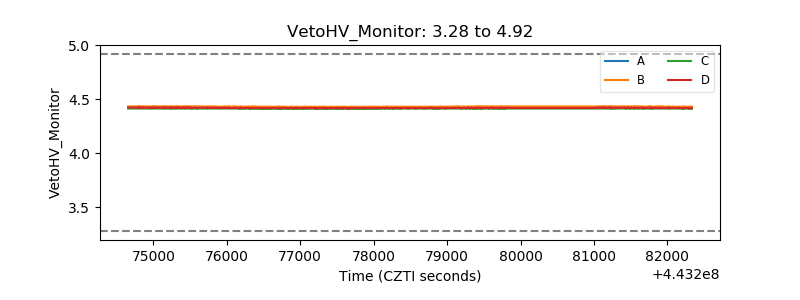 |
| Veto LLD | 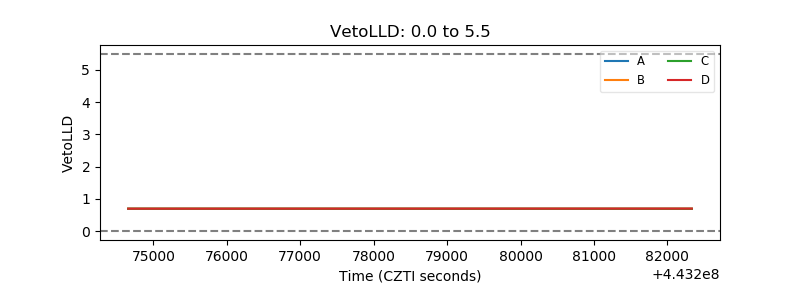 |
| Alpha Counter | 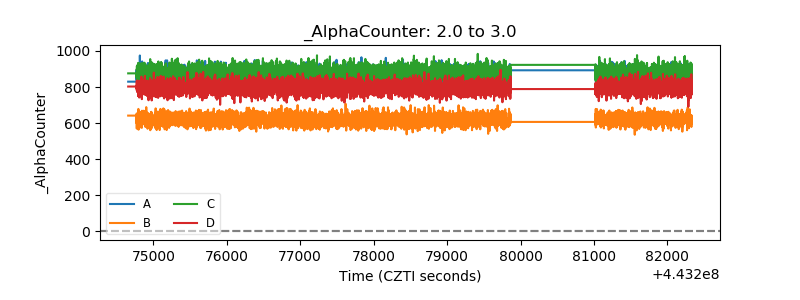 |
| _CPM_Rate | 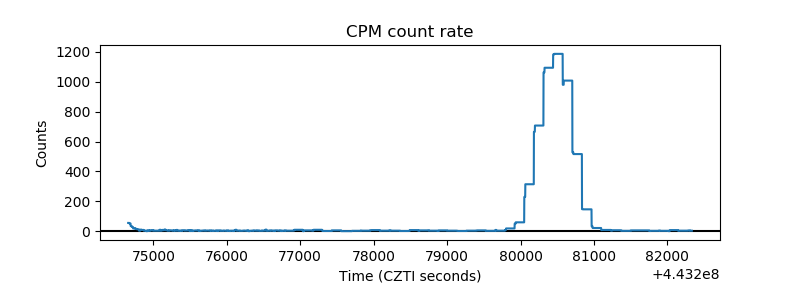 |
| CZT Counter | 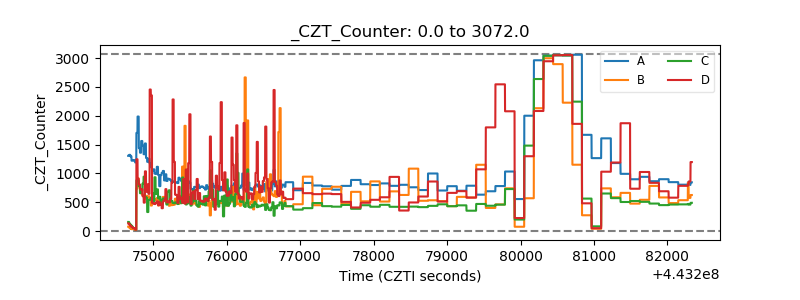 |
| +2.5 Volts monitor | 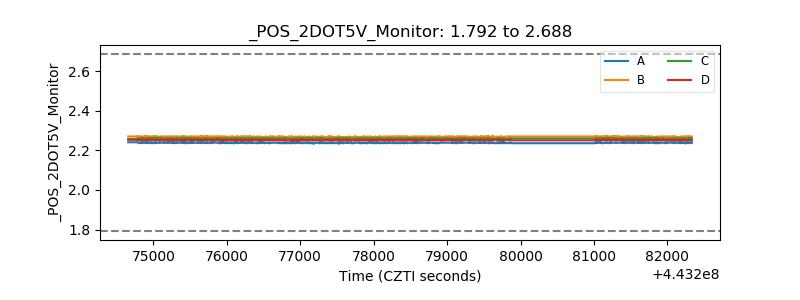 |
| +5 Volts monitor | 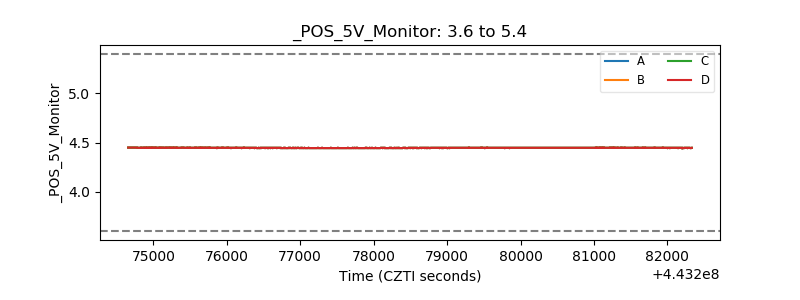 |
| _ROLL_ROT | 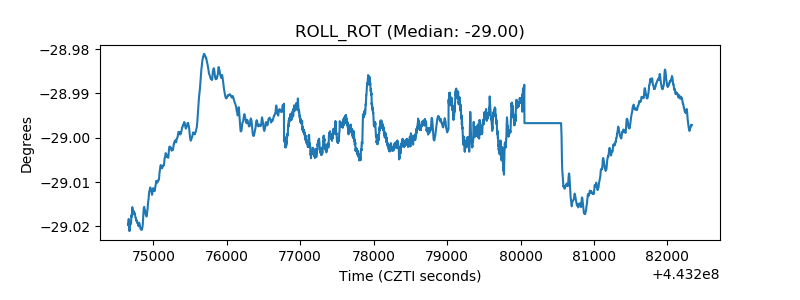 |
| _Roll_DEC | 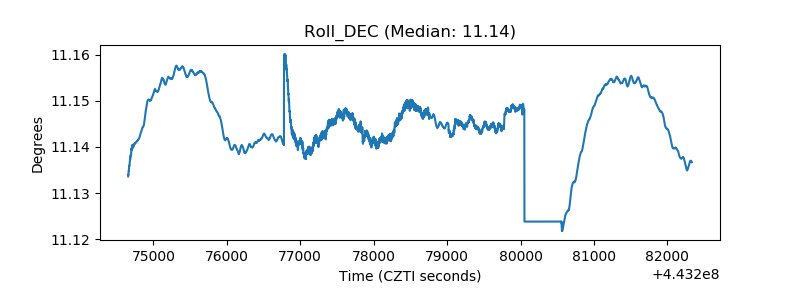 |
| _Roll_RA | 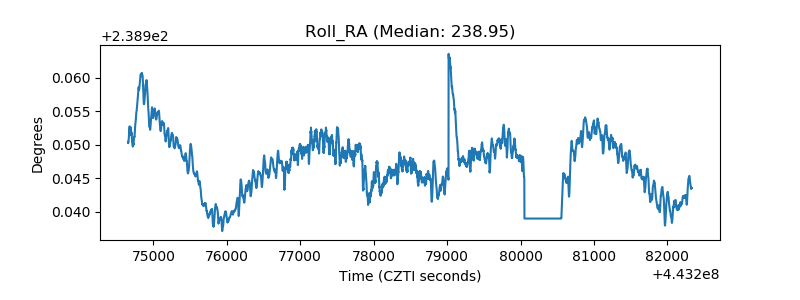 |
| Veto Counter | 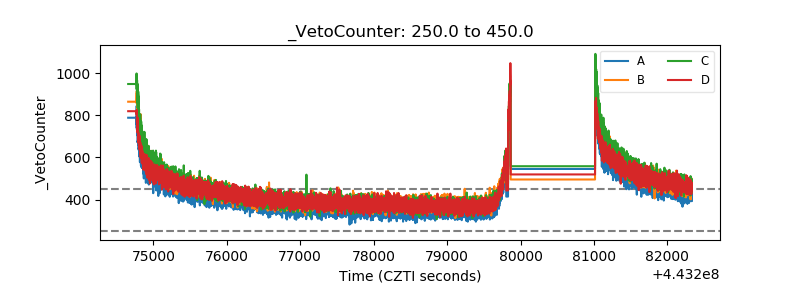 |