| Param | Original file | Final file |
|---|---|---|
| Filename | modeM0/AS1A13_017T02_9000006032_44923cztM0_level2.fits | modeM0/AS1A13_017T02_9000006032_44923cztM0_level2_quad_clean.evt |
| Size (bytes) | 554,852,160 | 115,191,360 |
| Size | 529.1 MB | 109.9 MB |
| Events in quadrant A | 5,760,185 | 788,402 |
| Events in quadrant B | 3,879,179 | 825,896 |
| Events in quadrant C | 3,244,691 | 802,043 |
| Events in quadrant D | 7,162,690 | 628,879 |
| Mode SS | |||
|---|---|---|---|
| Quadrant | BADHDUFLAG | Total packets | Discarded packets |
| A | 0 | 128 | 0 |
| B | 0 | 128 | 0 |
| C | 0 | 128 | 0 |
| D | 0 | 128 | 0 |
| Mode M0 | |||
|---|---|---|---|
| Quadrant | BADHDUFLAG | Total packets | Discarded packets |
| A | 0 | 21136 | 2 |
| B | 0 | 15685 | 2 |
| C | 0 | 13568 | 2 |
| D | 0 | 25733 | 2 |
| Mode M9 | |||
|---|---|---|---|
| Quadrant | BADHDUFLAG | Total packets | Discarded packets |
| A | 0 | 17 | 0 |
| B | 0 | 18 | 0 |
| C | 0 | 18 | 0 |
| D | 0 | 18 | 0 |
| Quadrant | Total seconds | Saturated seconds | Saturation percentage |
|---|---|---|---|
| A | 6352 | 231 | 3.636650% |
| B | 6352 | 135 | 2.125315% |
| C | 6352 | 44 | 0.692695% |
| D | 6352 | 1079 | 16.986776% |
Noise dominated data is calculated using 1-second bins in cleaned event files. If a bin has >2000 counts, and if more than 50% of those come from <1% of pixels, then it is considered to be noise-dominated and hence unusable.
| Quadrant | # 1 sec bins | Bins with >0 counts | Bins with >2000 counts | High rate bins dominated by noise | Noise dominated (total time) | Noise dominated (detector-on time) | Marked lightcurve |
|---|---|---|---|---|---|---|---|
| A | 7627 | 6353 | 59 | 59 | 0.77% | 0.93% | 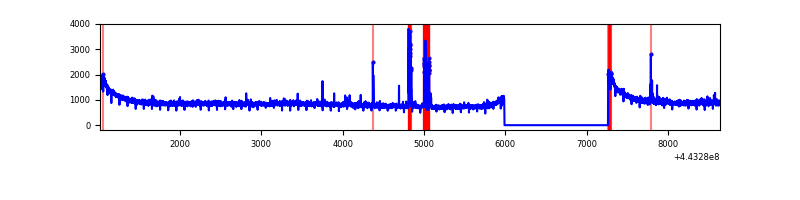 |
| B | 7627 | 6353 | 30 | 30 | 0.39% | 0.47% | 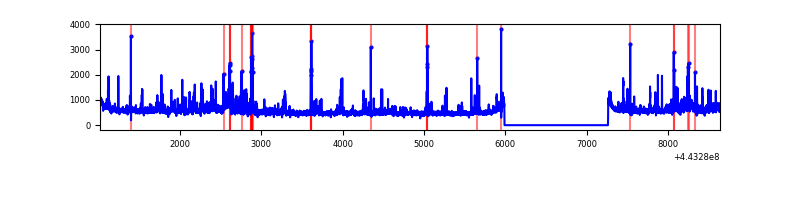 |
| C | 7627 | 6353 | 14 | 14 | 0.18% | 0.22% | 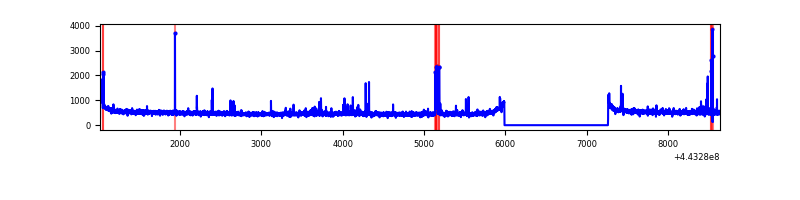 |
| D | 7627 | 6353 | 728 | 728 | 9.55% | 11.46% | 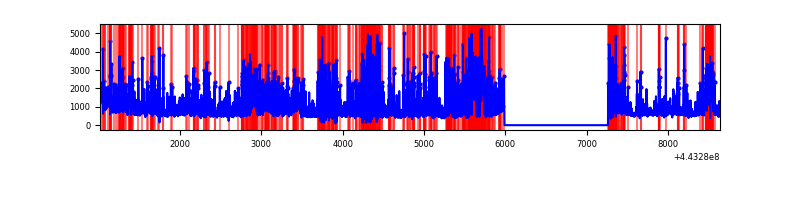 |
Top three noisy pixels from each quadrant. If the there are fewer than three noisy pixels in the level2.evt file, extra rows are filled as -1
| Pixel properties | Quadrant properties | ||||||
|---|---|---|---|---|---|---|---|
| Quadrant | DetID | PixID | Counts | Sigma | Mean | Median | Sigma |
| A | 10 | 83 | 2426042 | 14787.84 | 796 | 781 | 164.0 |
| A | 13 | 248 | 167789 | 1018.32 | 796 | 781 | 164.0 |
| A | 0 | 247 | 61097 | 367.77 | 796 | 781 | 164.0 |
| B | 0 | 183 | 200882 | 1296.14 | 796 | 775 | 154.4 |
| B | 4 | 171 | 148780 | 958.66 | 796 | 775 | 154.4 |
| B | 5 | 255 | 75365 | 483.14 | 796 | 775 | 154.4 |
| C | 14 | 254 | 54140 | 289.92 | 793 | 801 | 184.0 |
| C | 1 | 3 | 47488 | 253.76 | 793 | 801 | 184.0 |
| C | 12 | 2 | 36658 | 194.89 | 793 | 801 | 184.0 |
| D | 1 | 52 | 2472776 | 13403.3 | 737 | 714 | 184.4 |
| D | 2 | 249 | 749919 | 4062.12 | 737 | 714 | 184.4 |
| D | 13 | 249 | 398026 | 2154.19 | 737 | 714 | 184.4 |
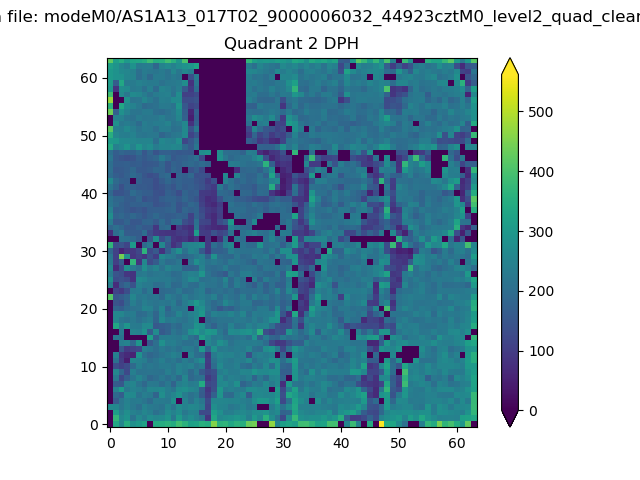
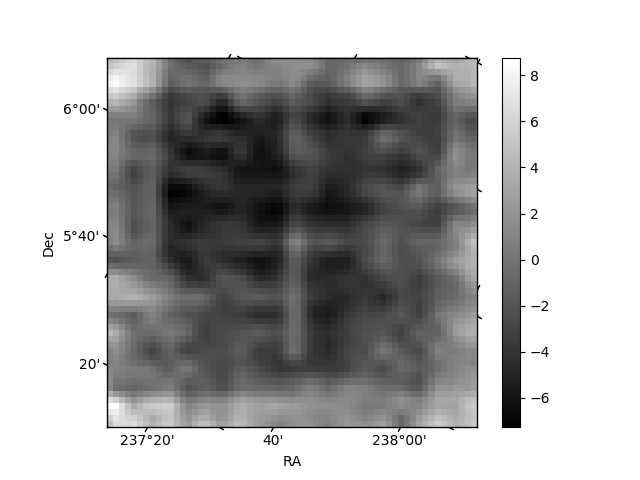
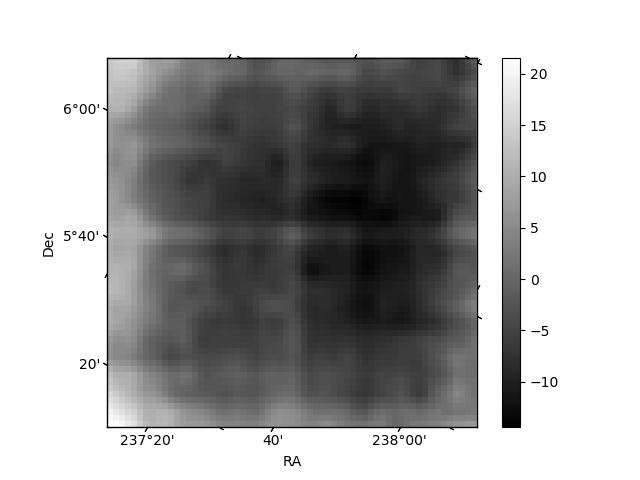
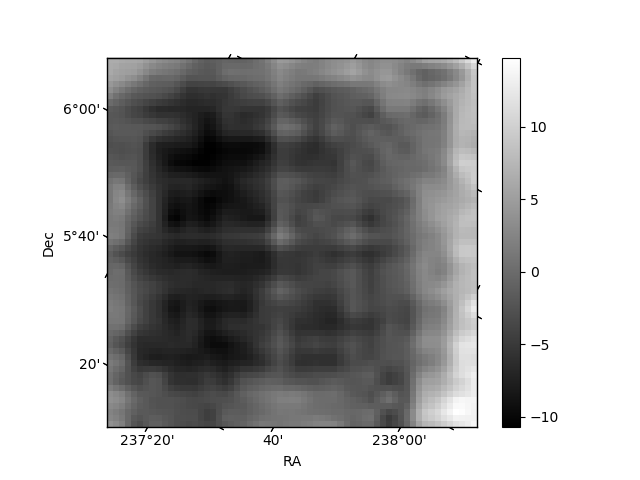
Histogram calculated using DETX and DETY for each event in the final _common_clean file
| Quadrant A | 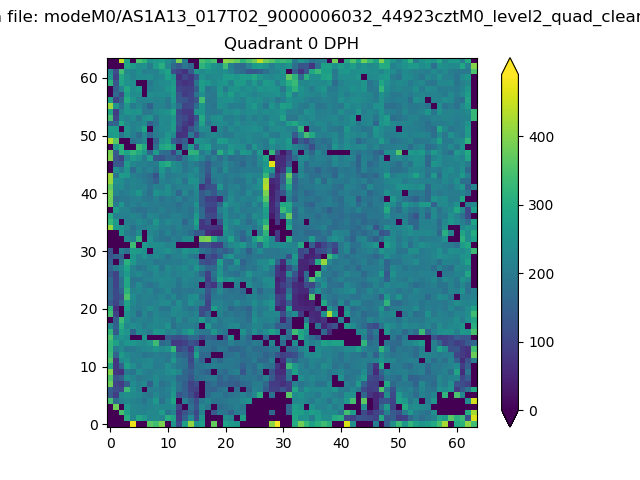 |
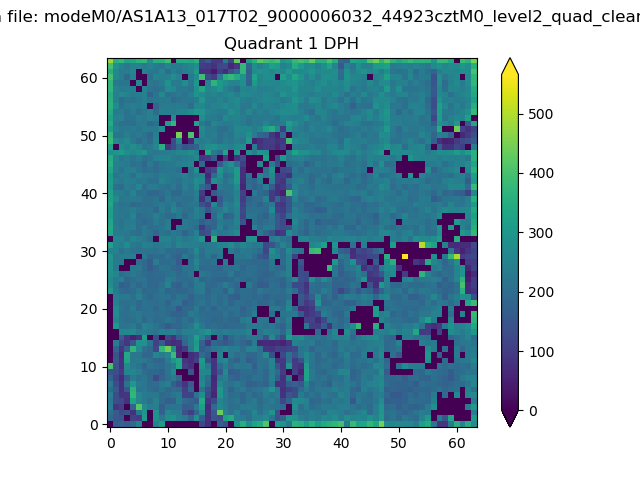 |
Quadrant B |
|---|---|---|---|
| Quadrant D | 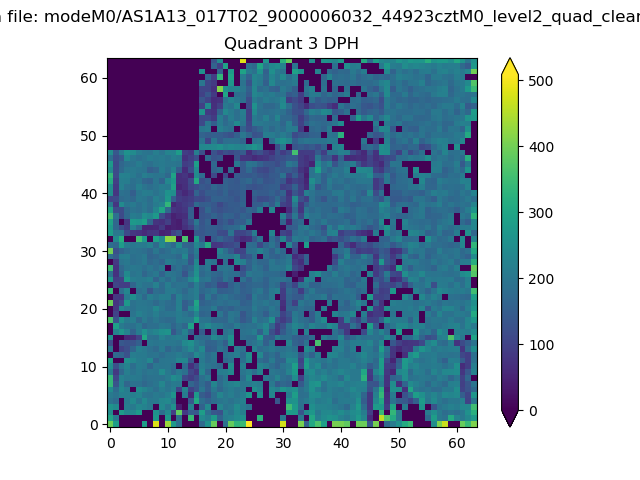 |
 |
Quadrant C |
| Plot type | Count rate plots | Images |
|---|---|---|
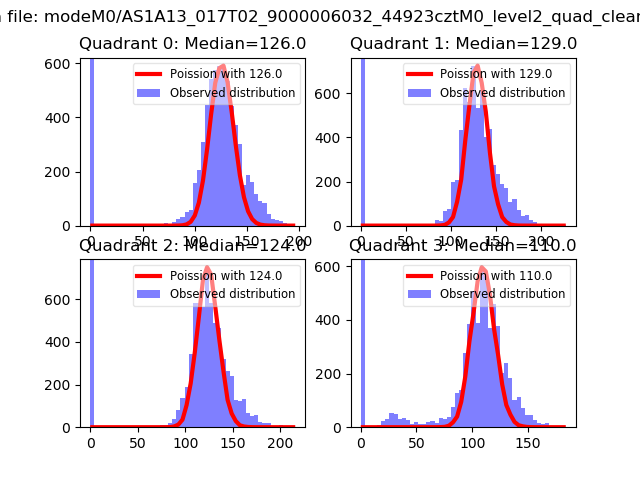
| Comparison with Poisson distribution Blue bars denote a histogram of data divided into 1 sec bins. Red curve is a Poisson curve with rate = median count rate of data. |
 |
 |
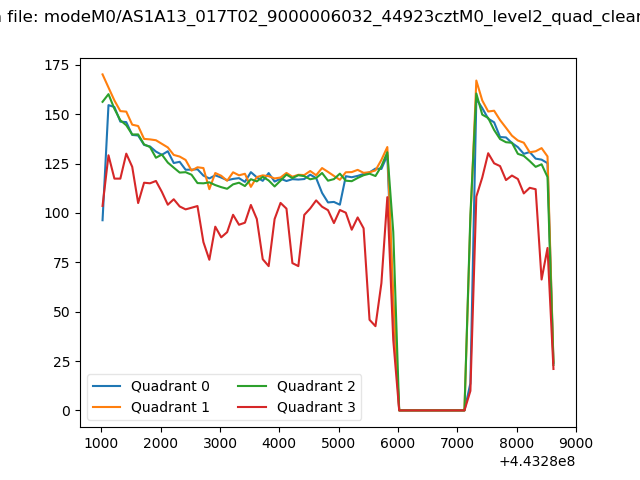
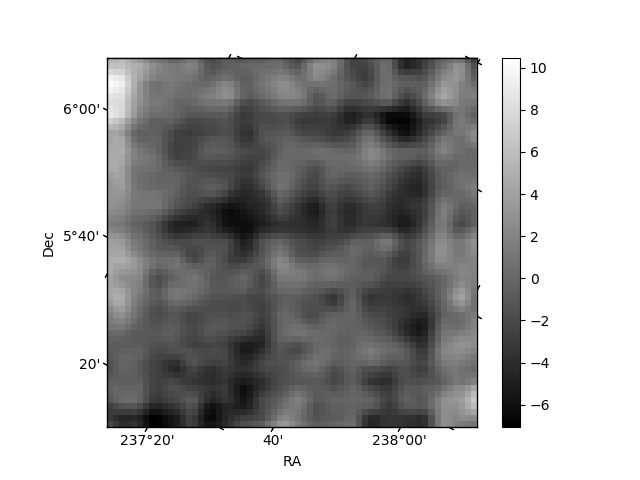
| Quadrant-wise count rates Data is divided into 100 sec bins |
 |
|
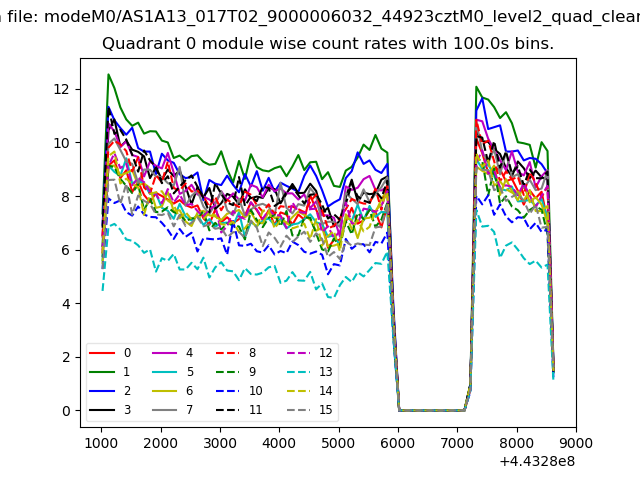
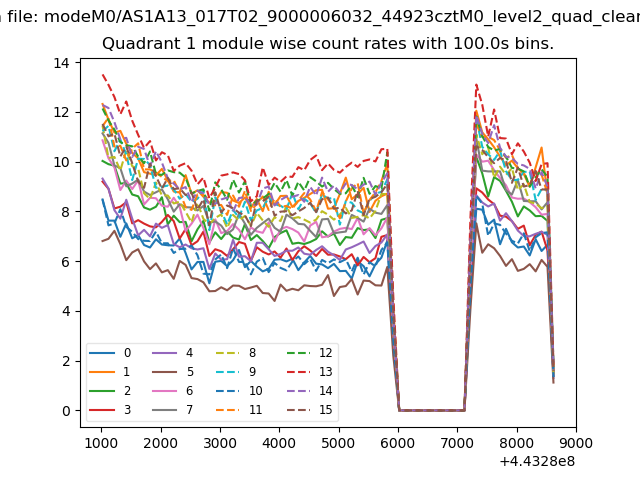
| Module-wise count rates for Quadrant A Data is divided into 100 sec bins |
 |
 |
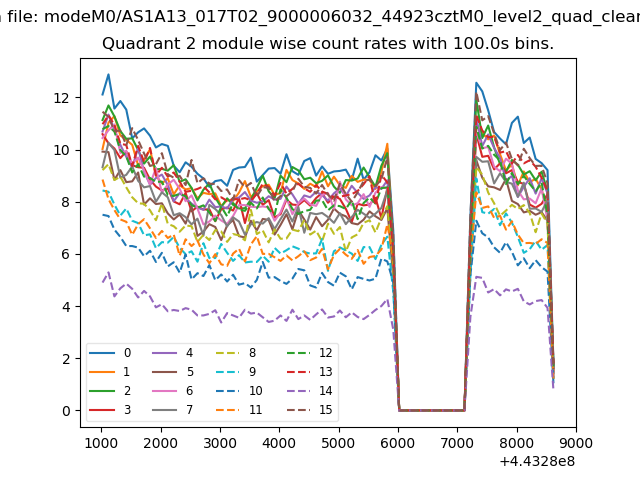
| Module-wise count rates for Quadrant B Data is divided into 100 sec bins |
 |
 |
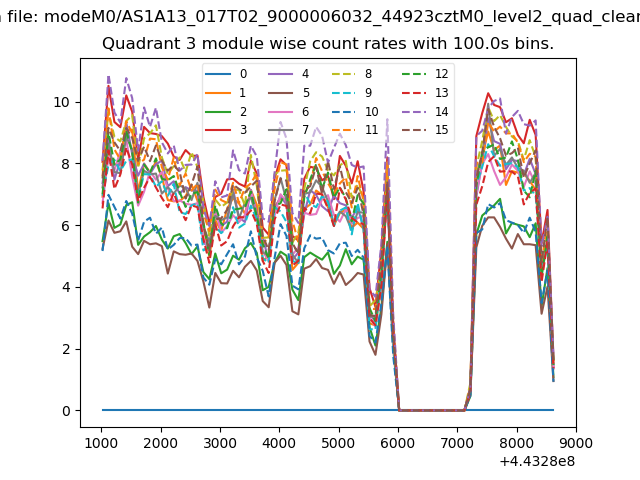
| Module-wise count rates for Quadrant C Data is divided into 100 sec bins |
 |
 |
| Module-wise count rates for Quadrant D Data is divided into 100 sec bins |
 |
 |
| Parameter | Plot |
|---|---|
| CZT HV Monitor | 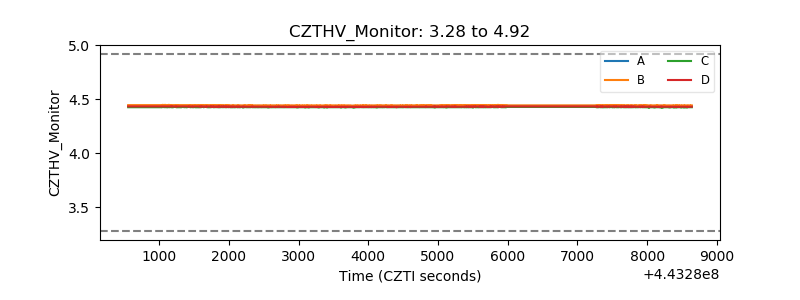 |
| D_VDD | 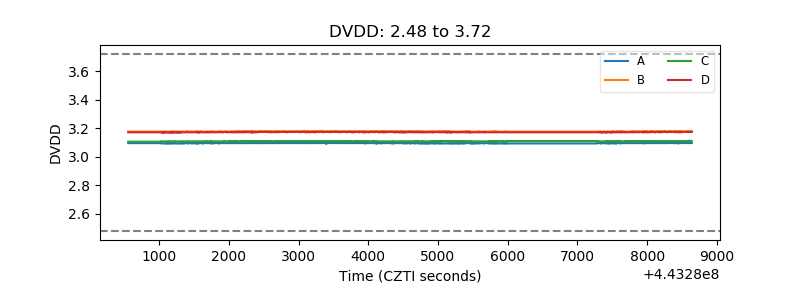 |
| Temperature 1 | 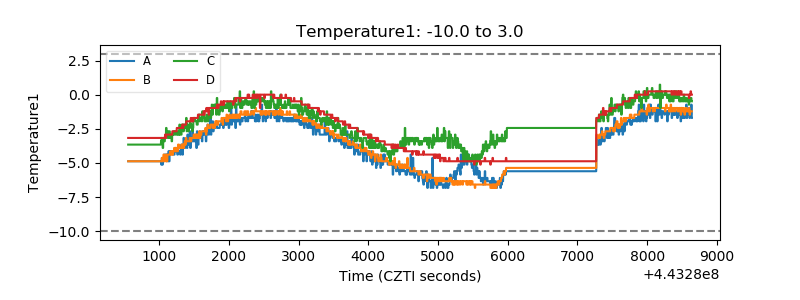 |
| Veto HV Monitor | 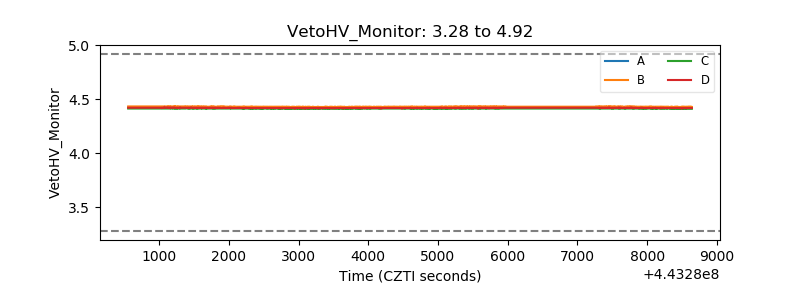 |
| Veto LLD | 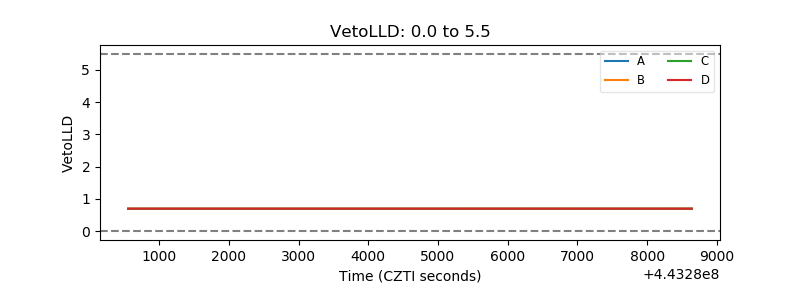 |
| Alpha Counter | 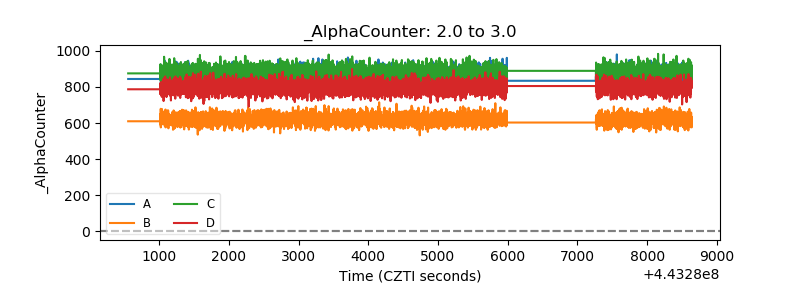 |
| _CPM_Rate | 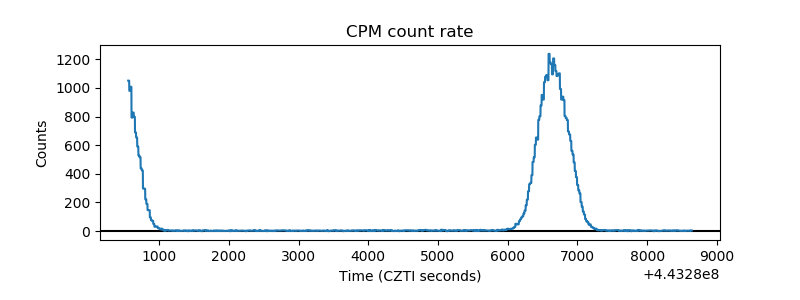 |
| CZT Counter | 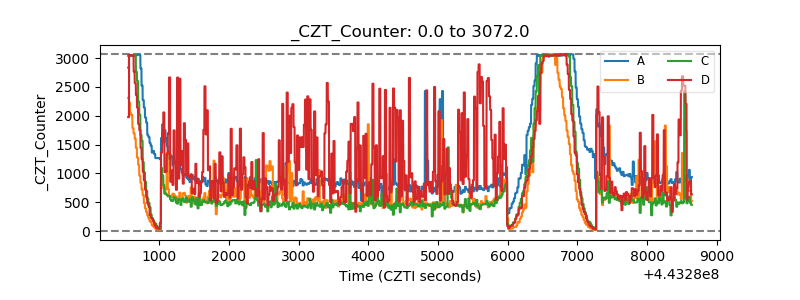 |
| +2.5 Volts monitor | 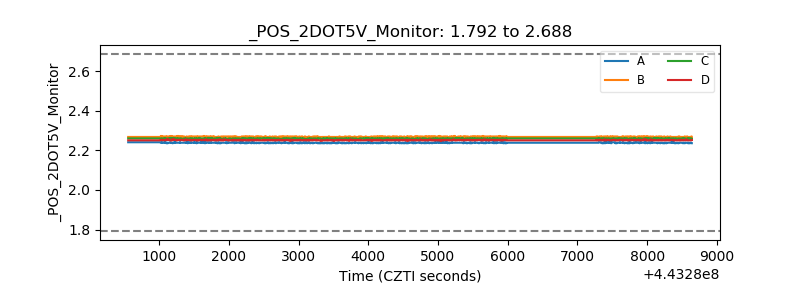 |
| +5 Volts monitor | 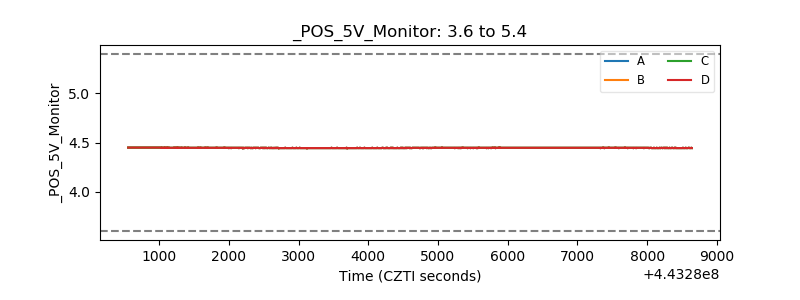 |
| _ROLL_ROT | 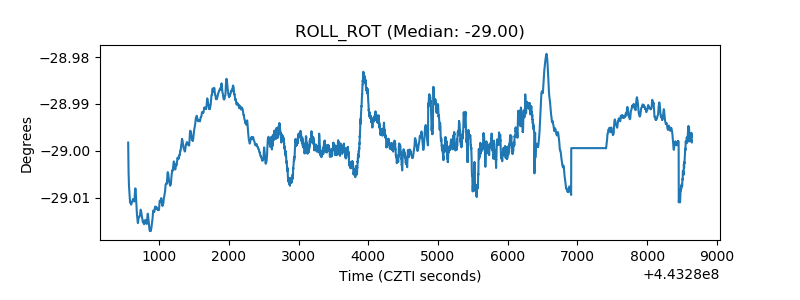 |
| _Roll_DEC | 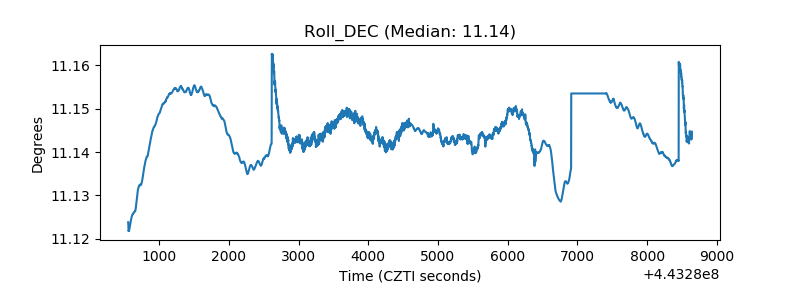 |
| _Roll_RA |  |
| Veto Counter | 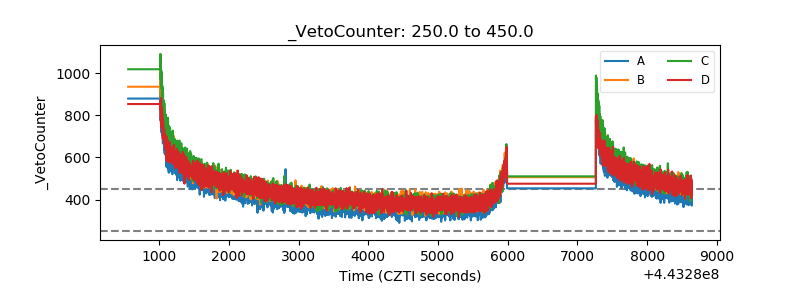 |