| Param | Original file | Final file |
|---|---|---|
| Filename | modeM0/AS1A13_017T02_9000006032_44924cztM0_level2.fits | modeM0/AS1A13_017T02_9000006032_44924cztM0_level2_quad_clean.evt |
| Size (bytes) | 531,622,080 | 117,498,240 |
| Size | 507.0 MB | 112.1 MB |
| Events in quadrant A | 5,816,152 | 796,926 |
| Events in quadrant B | 3,957,806 | 824,115 |
| Events in quadrant C | 3,327,762 | 801,113 |
| Events in quadrant D | 6,067,326 | 676,966 |
| Mode SS | |||
|---|---|---|---|
| Quadrant | BADHDUFLAG | Total packets | Discarded packets |
| A | 0 | 134 | 0 |
| B | 0 | 134 | 0 |
| C | 0 | 134 | 0 |
| D | 0 | 134 | 0 |
| Mode M0 | |||
|---|---|---|---|
| Quadrant | BADHDUFLAG | Total packets | Discarded packets |
| A | 0 | 21456 | 3 |
| B | 0 | 16057 | 1 |
| C | 0 | 13962 | 1 |
| D | 0 | 22677 | 1 |
| Mode M9 | |||
|---|---|---|---|
| Quadrant | BADHDUFLAG | Total packets | Discarded packets |
| A | 0 | 12 | 0 |
| B | 0 | 12 | 0 |
| C | 0 | 12 | 0 |
| D | 0 | 12 | 0 |
| Quadrant | Total seconds | Saturated seconds | Saturation percentage |
|---|---|---|---|
| A | 6578 | 212 | 3.222864% |
| B | 6579 | 188 | 2.857577% |
| C | 6579 | 75 | 1.139991% |
| D | 6579 | 659 | 10.016720% |
Noise dominated data is calculated using 1-second bins in cleaned event files. If a bin has >2000 counts, and if more than 50% of those come from <1% of pixels, then it is considered to be noise-dominated and hence unusable.
| Quadrant | # 1 sec bins | Bins with >0 counts | Bins with >2000 counts | High rate bins dominated by noise | Noise dominated (total time) | Noise dominated (detector-on time) | Marked lightcurve |
|---|---|---|---|---|---|---|---|
| A | 7773 | 6579 | 11 | 11 | 0.14% | 0.17% | 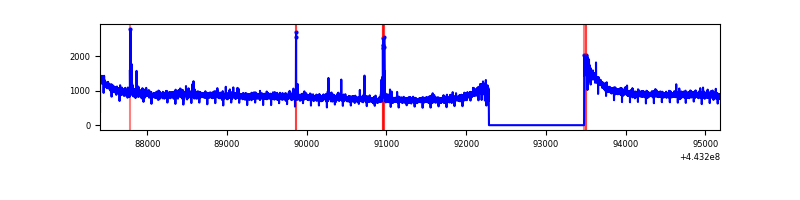 |
| B | 7774 | 6580 | 40 | 40 | 0.51% | 0.61% | 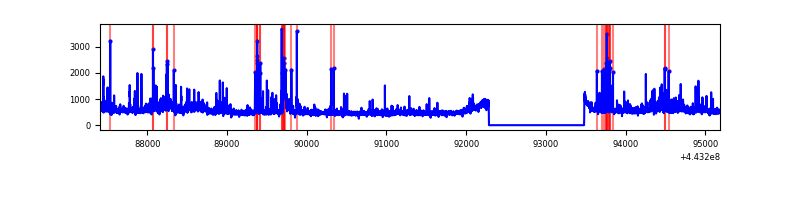 |
| C | 7774 | 6580 | 4 | 4 | 0.05% | 0.06% | 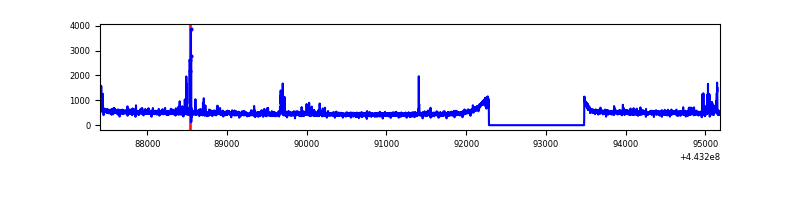 |
| D | 7774 | 6580 | 445 | 445 | 5.72% | 6.76% | 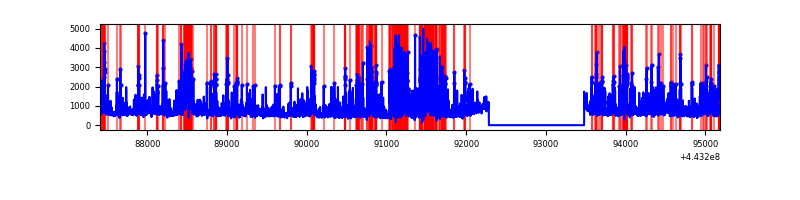 |
Top three noisy pixels from each quadrant. If the there are fewer than three noisy pixels in the level2.evt file, extra rows are filled as -1
| Pixel properties | Quadrant properties | ||||||
|---|---|---|---|---|---|---|---|
| Quadrant | DetID | PixID | Counts | Sigma | Mean | Median | Sigma |
| A | 10 | 83 | 2527058 | 14805.56 | 819 | 803 | 170.6 |
| A | 13 | 248 | 58398 | 337.55 | 819 | 803 | 170.6 |
| A | 0 | 247 | 43510 | 250.29 | 819 | 803 | 170.6 |
| B | 4 | 171 | 144383 | 895.4 | 816 | 793 | 160.4 |
| B | 0 | 183 | 144292 | 894.83 | 816 | 793 | 160.4 |
| B | 0 | 168 | 80943 | 499.8 | 816 | 793 | 160.4 |
| C | 15 | 208 | 58258 | 301.21 | 815 | 822 | 190.7 |
| C | 12 | 2 | 43589 | 224.28 | 815 | 822 | 190.7 |
| C | 14 | 254 | 30025 | 153.15 | 815 | 822 | 190.7 |
| D | 1 | 52 | 843074 | 4297.38 | 787 | 763 | 196.0 |
| D | 2 | 249 | 797146 | 4063.06 | 787 | 763 | 196.0 |
| D | 13 | 249 | 627961 | 3199.89 | 787 | 763 | 196.0 |
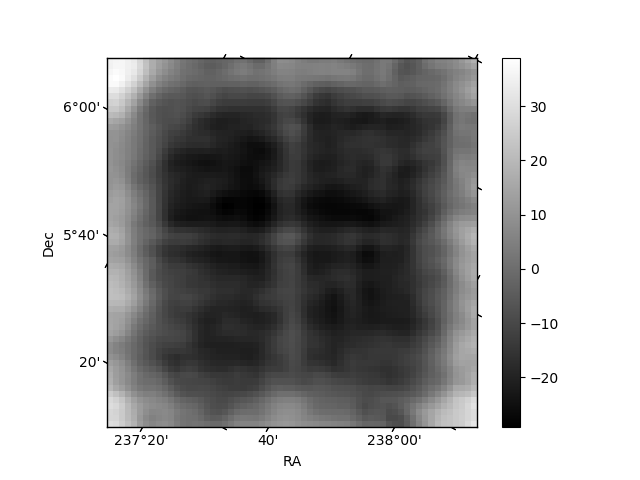
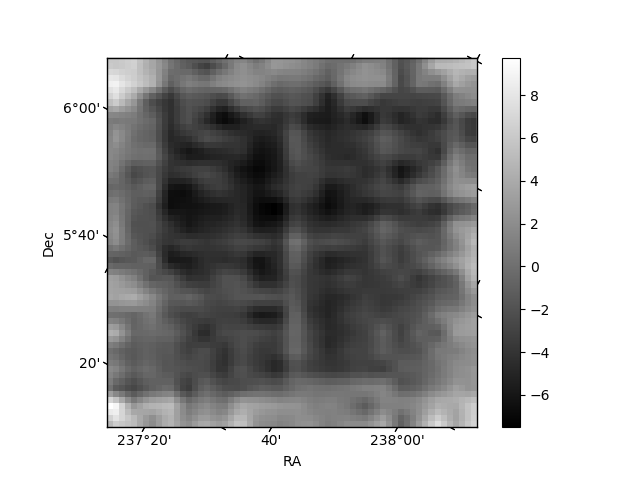
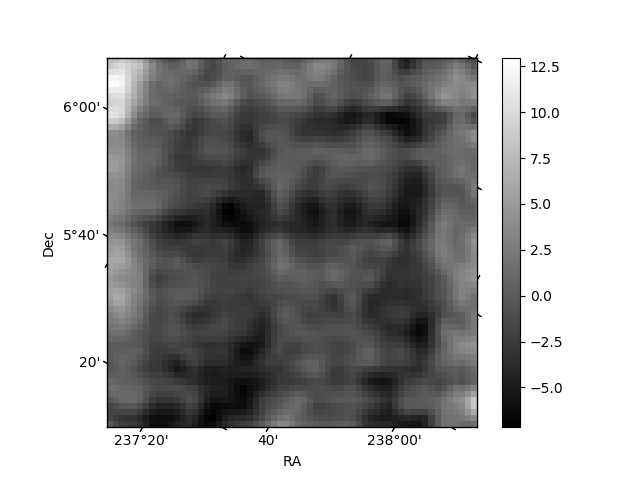
Histogram calculated using DETX and DETY for each event in the final _common_clean file
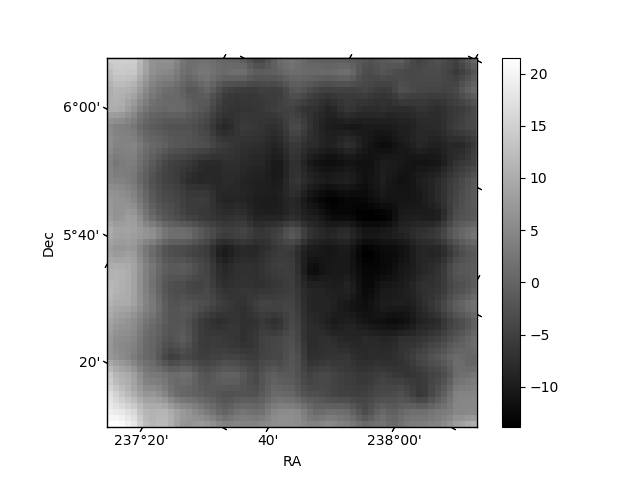
| Quadrant A | 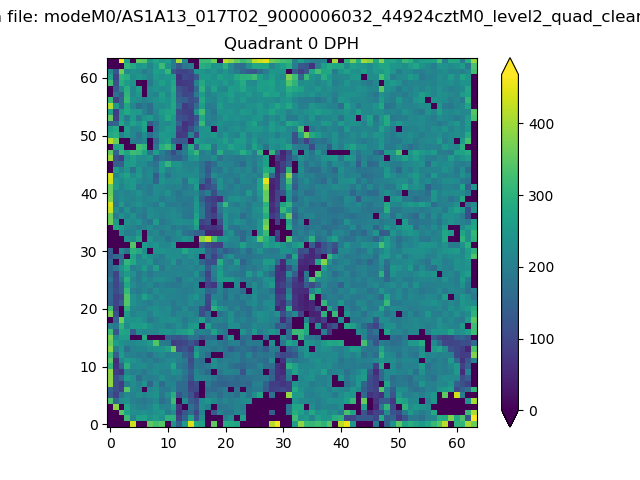 |
 |
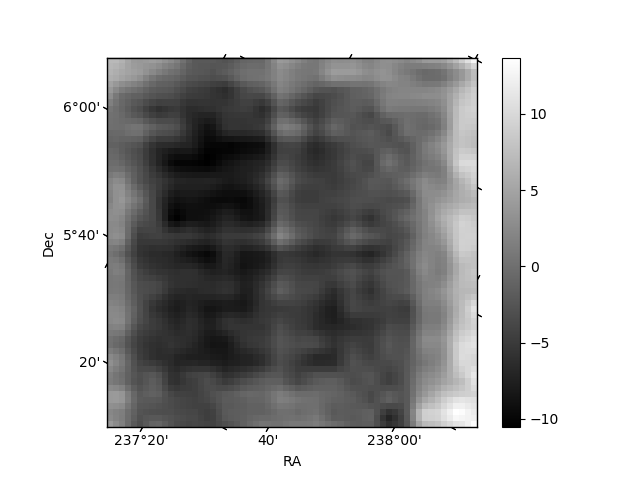
Quadrant B |
|---|---|---|---|
| Quadrant D | 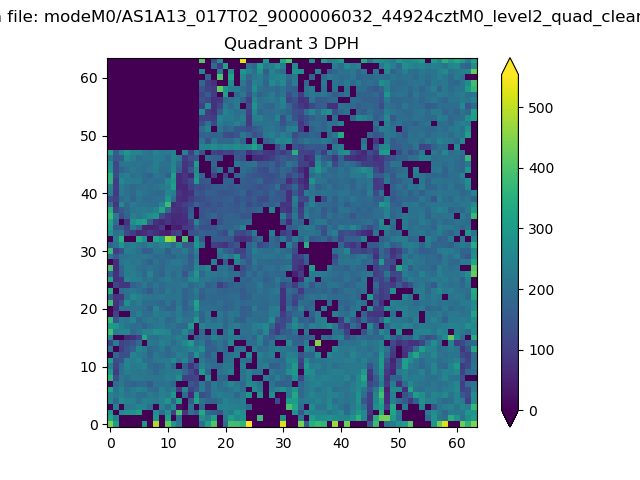 |
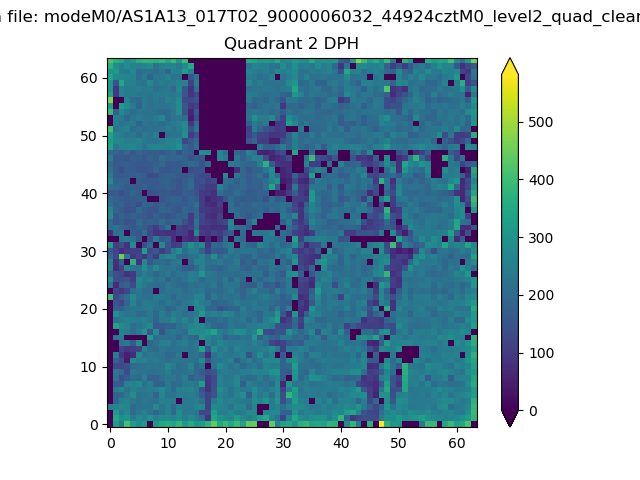 |
Quadrant C |
| Plot type | Count rate plots | Images |
|---|---|---|
| Comparison with Poisson distribution Blue bars denote a histogram of data divided into 1 sec bins. Red curve is a Poisson curve with rate = median count rate of data. |
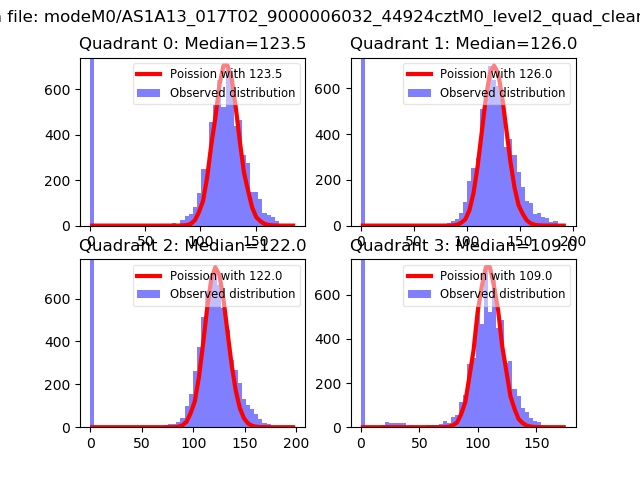 |
 |
| Quadrant-wise count rates Data is divided into 100 sec bins |
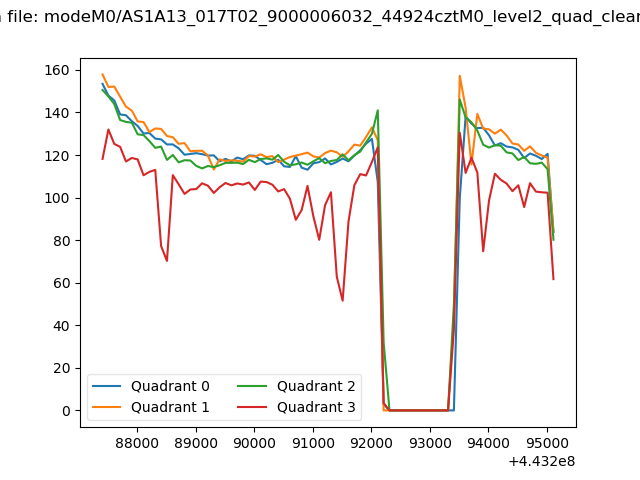 |
|
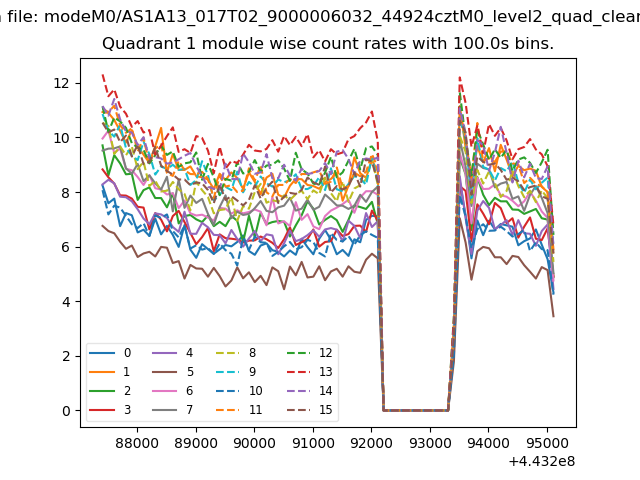
| Module-wise count rates for Quadrant A Data is divided into 100 sec bins |
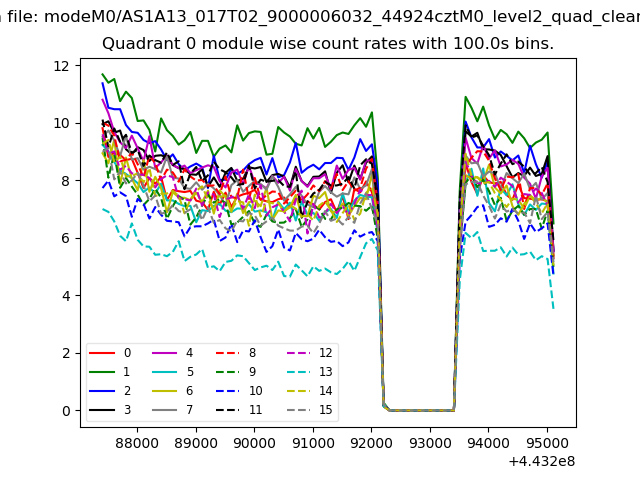 |
 |
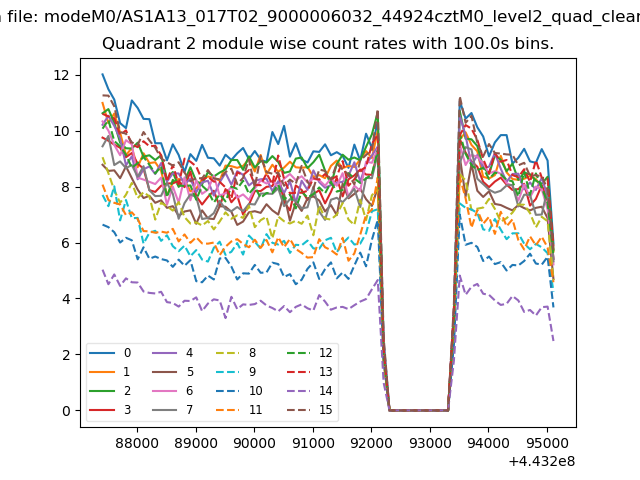
| Module-wise count rates for Quadrant B Data is divided into 100 sec bins |
 |
 |
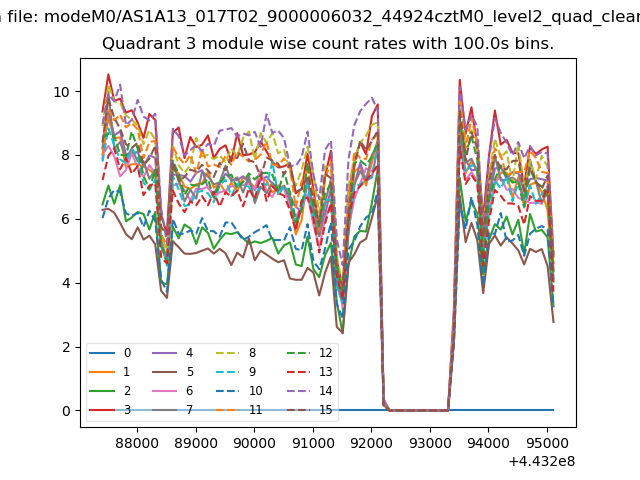
| Module-wise count rates for Quadrant C Data is divided into 100 sec bins |
 |
 |
| Module-wise count rates for Quadrant D Data is divided into 100 sec bins |
 |
 |
| Parameter | Plot |
|---|---|
| CZT HV Monitor | 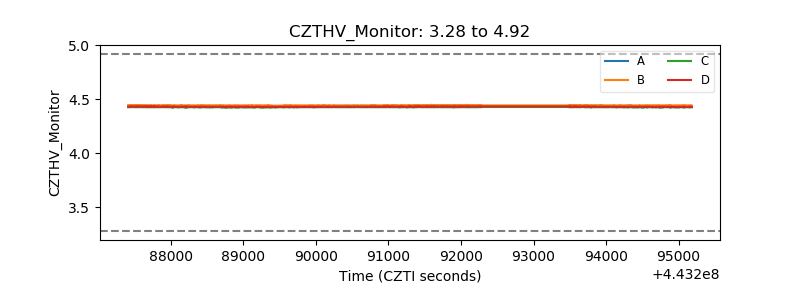 |
| D_VDD | 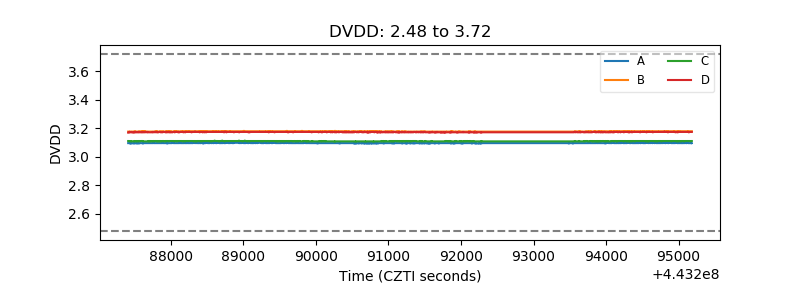 |
| Temperature 1 | 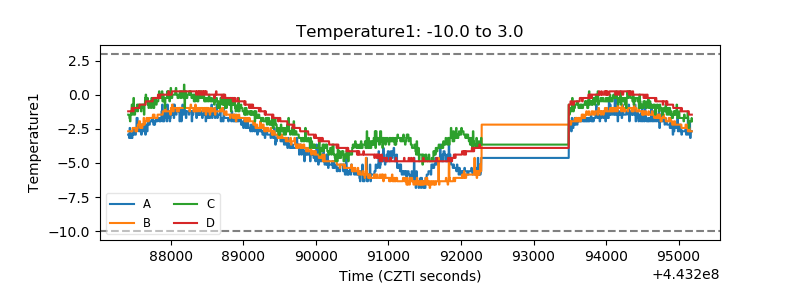 |
| Veto HV Monitor | 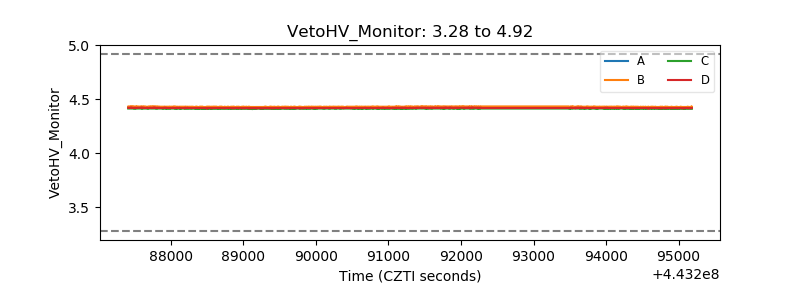 |
| Veto LLD | 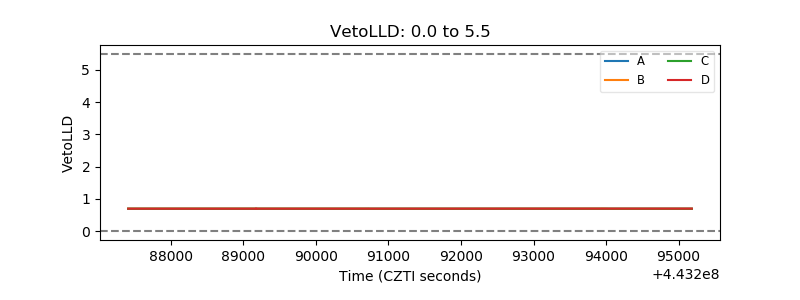 |
| Alpha Counter | 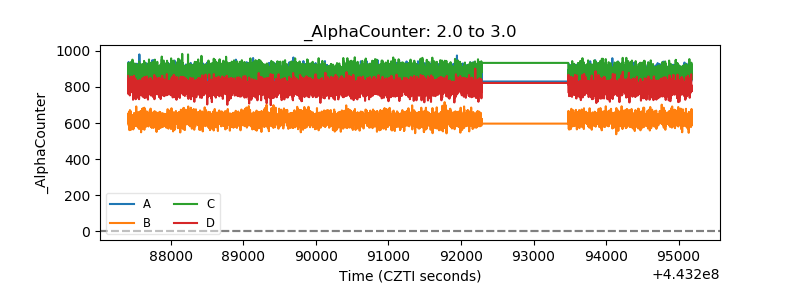 |
| _CPM_Rate | 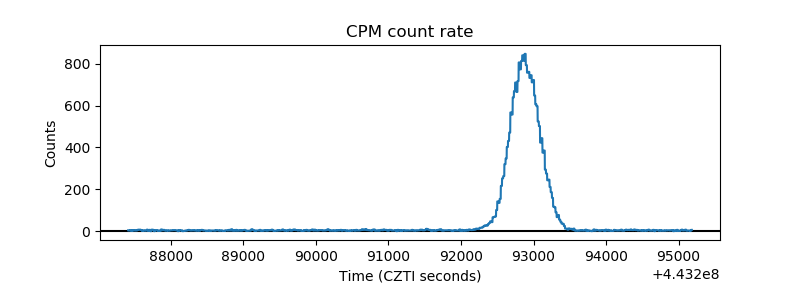 |
| CZT Counter |  |
| +2.5 Volts monitor | 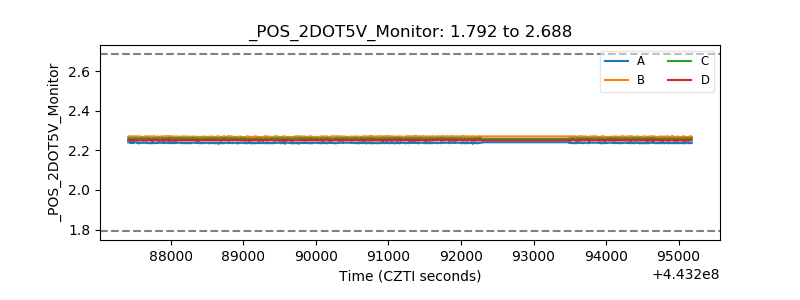 |
| +5 Volts monitor | 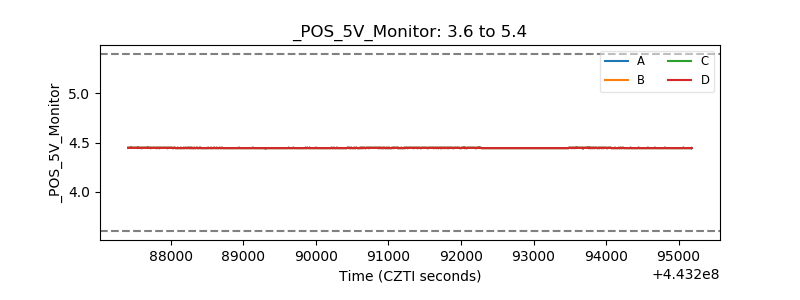 |
| _ROLL_ROT | 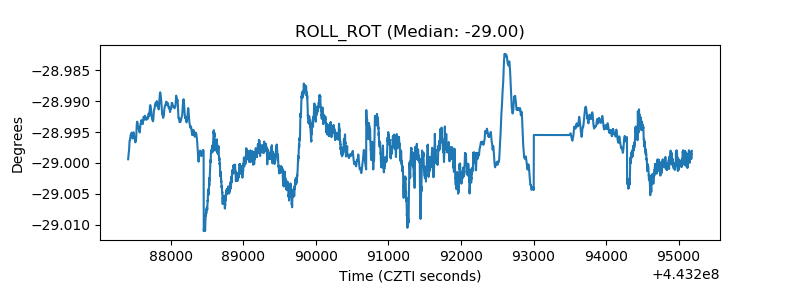 |
| _Roll_DEC | 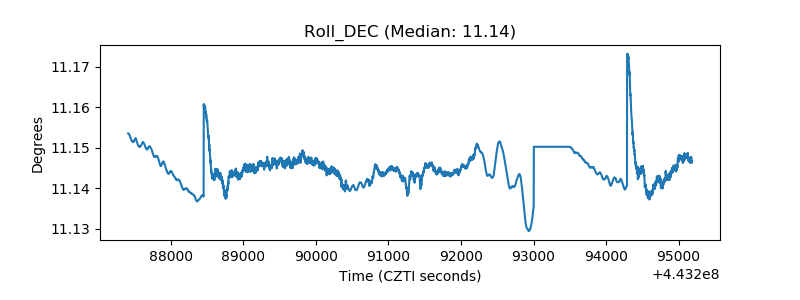 |
| _Roll_RA | 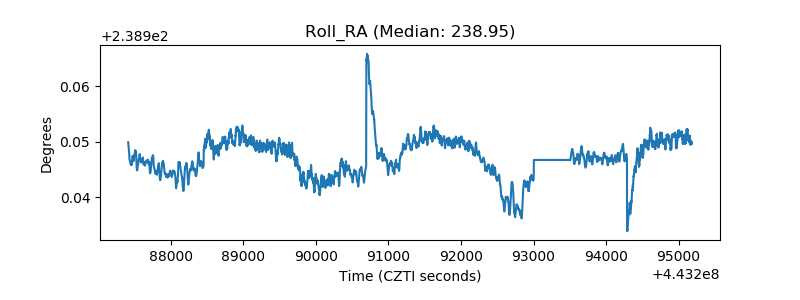 |
| Veto Counter | 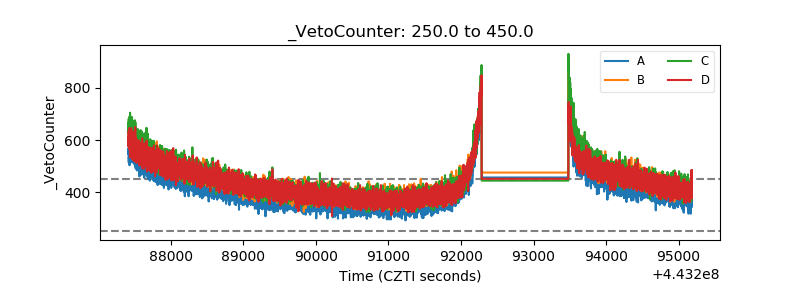 |