| Param | Original file | Final file |
|---|---|---|
| Filename | modeM0/AS1A13_017T02_9000006032_44925cztM0_level2.fits | modeM0/AS1A13_017T02_9000006032_44925cztM0_level2_quad_clean.evt |
| Size (bytes) | 577,437,120 | 114,361,920 |
| Size | 550.7 MB | 109.1 MB |
| Events in quadrant A | 5,963,505 | 771,473 |
| Events in quadrant B | 4,195,853 | 801,408 |
| Events in quadrant C | 3,345,716 | 784,544 |
| Events in quadrant D | 7,348,791 | 636,607 |
| Mode SS | |||
|---|---|---|---|
| Quadrant | BADHDUFLAG | Total packets | Discarded packets |
| A | 0 | 136 | 0 |
| B | 0 | 136 | 0 |
| C | 0 | 136 | 0 |
| D | 0 | 136 | 0 |
| Mode M0 | |||
|---|---|---|---|
| Quadrant | BADHDUFLAG | Total packets | Discarded packets |
| A | 0 | 22267 | 2 |
| B | 0 | 16991 | 2 |
| C | 0 | 14309 | 2 |
| D | 0 | 26585 | 6 |
| Mode M9 | |||
|---|---|---|---|
| Quadrant | BADHDUFLAG | Total packets | Discarded packets |
| A | 0 | 11 | 0 |
| B | 0 | 11 | 0 |
| C | 0 | 11 | 0 |
| D | 0 | 11 | 0 |
| Quadrant | Total seconds | Saturated seconds | Saturation percentage |
|---|---|---|---|
| A | 6725 | 284 | 4.223048% |
| B | 6726 | 261 | 3.880464% |
| C | 6726 | 96 | 1.427297% |
| D | 6725 | 1025 | 15.241636% |
Noise dominated data is calculated using 1-second bins in cleaned event files. If a bin has >2000 counts, and if more than 50% of those come from <1% of pixels, then it is considered to be noise-dominated and hence unusable.
| Quadrant | # 1 sec bins | Bins with >0 counts | Bins with >2000 counts | High rate bins dominated by noise | Noise dominated (total time) | Noise dominated (detector-on time) | Marked lightcurve |
|---|---|---|---|---|---|---|---|
| A | 7780 | 6727 | 0 | 0 | 0.00% | 0.00% | 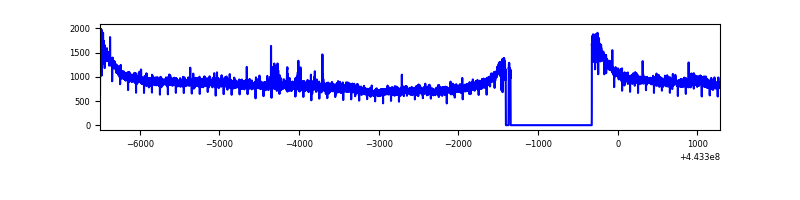 |
| B | 7781 | 6728 | 49 | 49 | 0.63% | 0.73% | 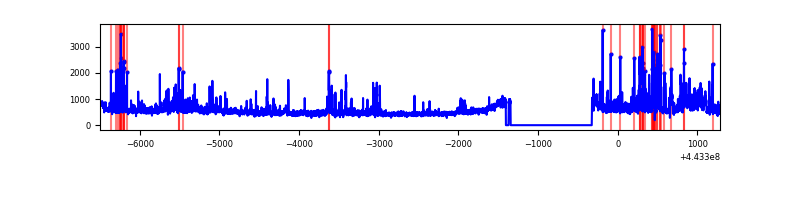 |
| C | 7781 | 6728 | 1 | 1 | 0.01% | 0.01% | 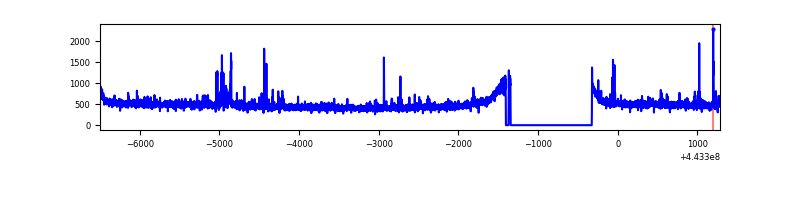 |
| D | 7780 | 6727 | 601 | 601 | 7.72% | 8.93% | 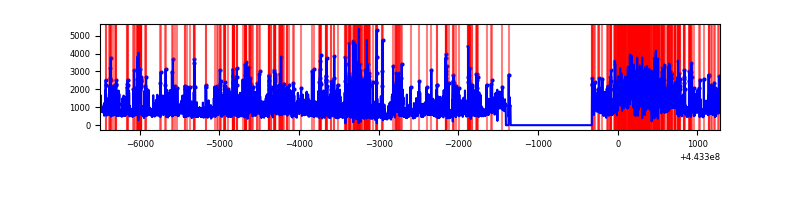 |
Top three noisy pixels from each quadrant. If the there are fewer than three noisy pixels in the level2.evt file, extra rows are filled as -1
| Pixel properties | Quadrant properties | ||||||
|---|---|---|---|---|---|---|---|
| Quadrant | DetID | PixID | Counts | Sigma | Mean | Median | Sigma |
| A | 10 | 83 | 2615902 | 15323.39 | 821 | 802 | 170.7 |
| A | 0 | 247 | 99804 | 580.11 | 821 | 802 | 170.7 |
| A | 0 | 243 | 52504 | 302.95 | 821 | 802 | 170.7 |
| B | 4 | 171 | 338674 | 2104.28 | 821 | 799 | 160.6 |
| B | 0 | 219 | 166020 | 1029.0 | 821 | 799 | 160.6 |
| B | 0 | 183 | 113689 | 703.08 | 821 | 799 | 160.6 |
| C | 15 | 208 | 67172 | 346.45 | 820 | 825 | 191.5 |
| C | 12 | 2 | 33051 | 168.28 | 820 | 825 | 191.5 |
| C | 3 | 233 | 23107 | 116.35 | 820 | 825 | 191.5 |
| D | 1 | 52 | 2365761 | 12044.77 | 776 | 751 | 196.4 |
| D | 1 | 47 | 540407 | 2748.42 | 776 | 751 | 196.4 |
| D | 13 | 171 | 235153 | 1193.79 | 776 | 751 | 196.4 |
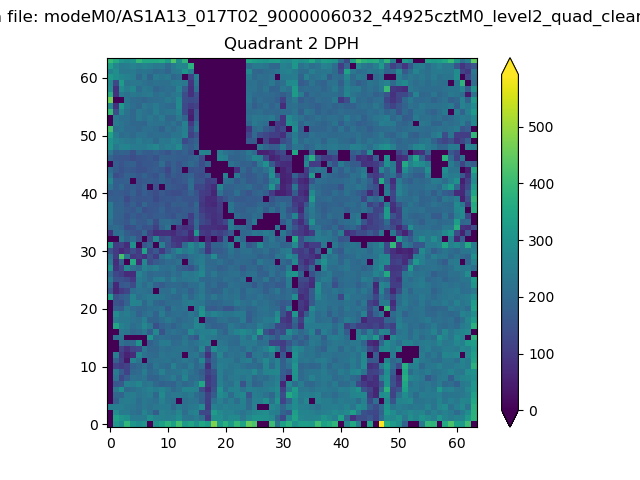
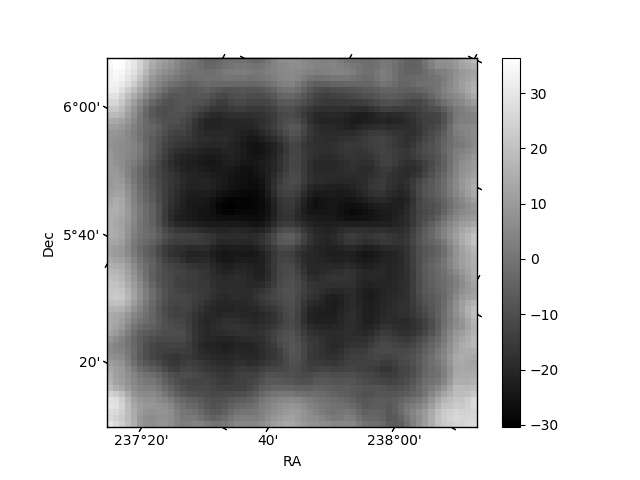
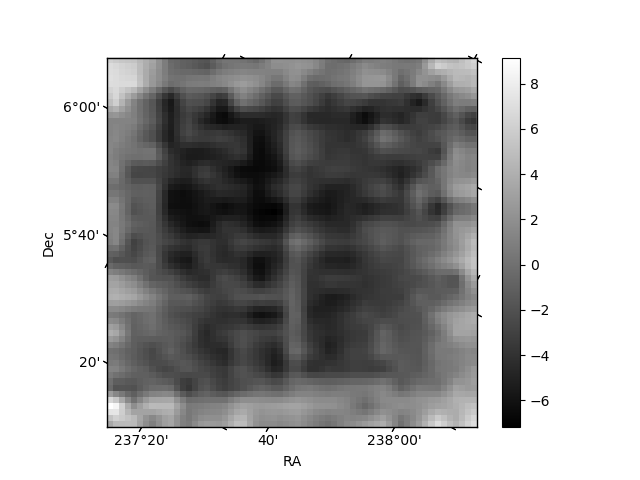
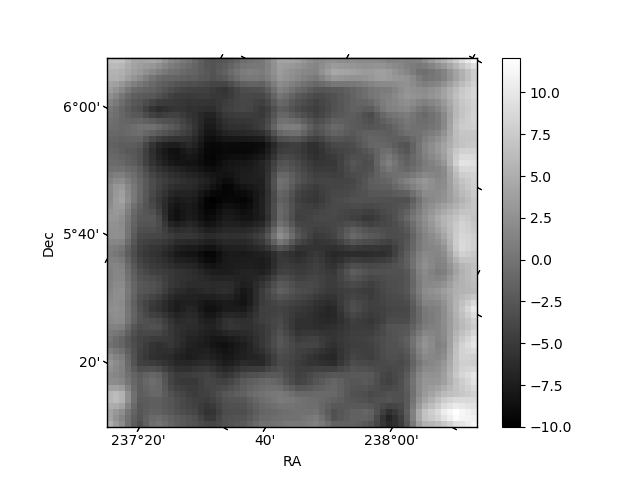
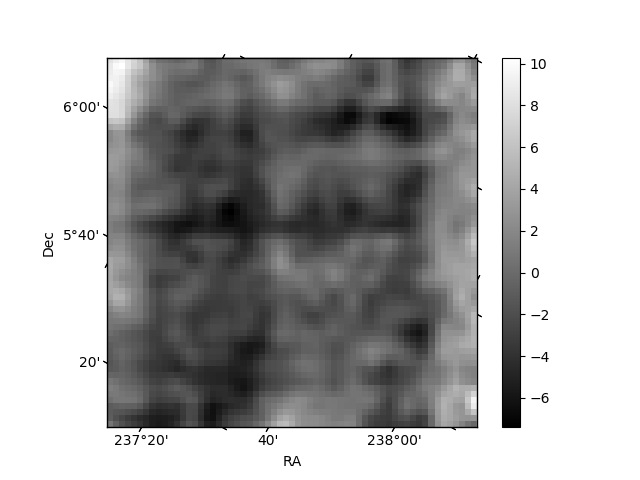
Histogram calculated using DETX and DETY for each event in the final _common_clean file
| Quadrant A | 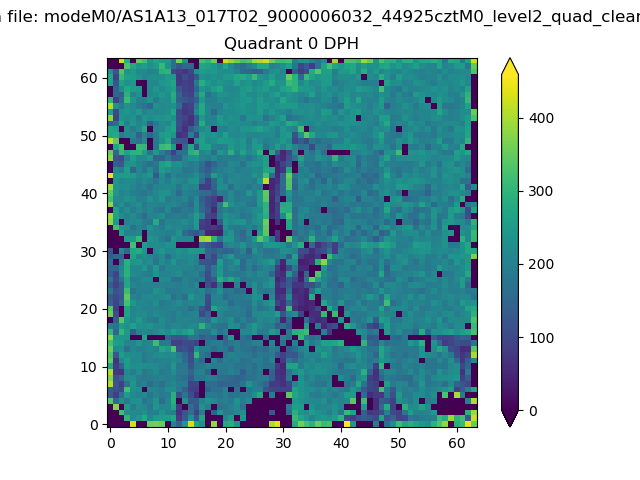 |
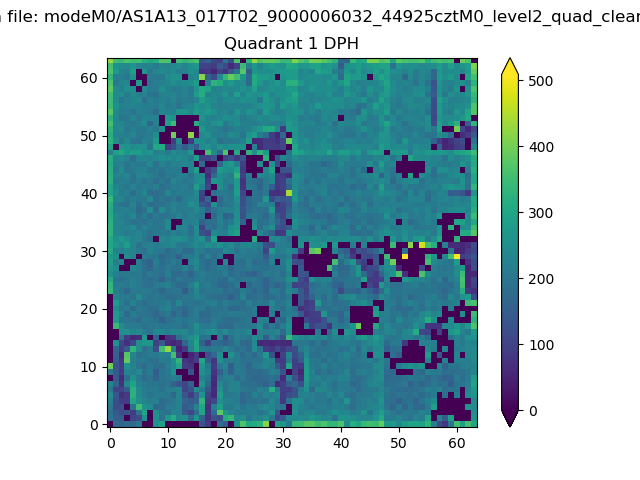 |
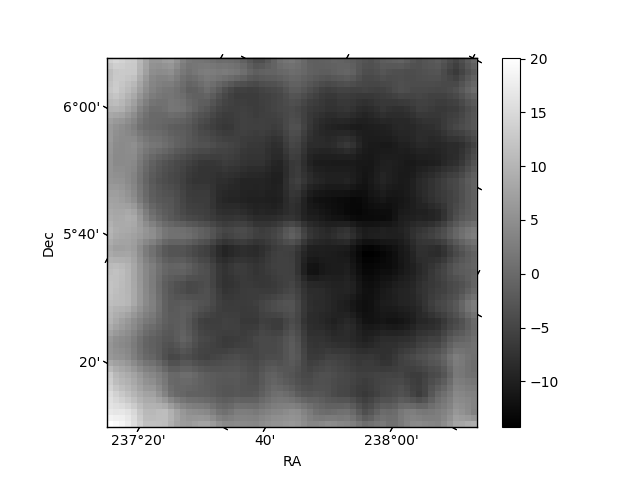
Quadrant B |
|---|---|---|---|
| Quadrant D | 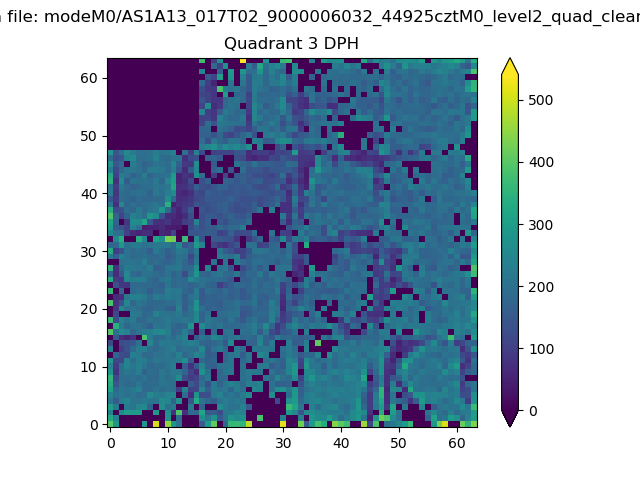 |
 |
Quadrant C |
| Plot type | Count rate plots | Images |
|---|---|---|
| Comparison with Poisson distribution Blue bars denote a histogram of data divided into 1 sec bins. Red curve is a Poisson curve with rate = median count rate of data. |
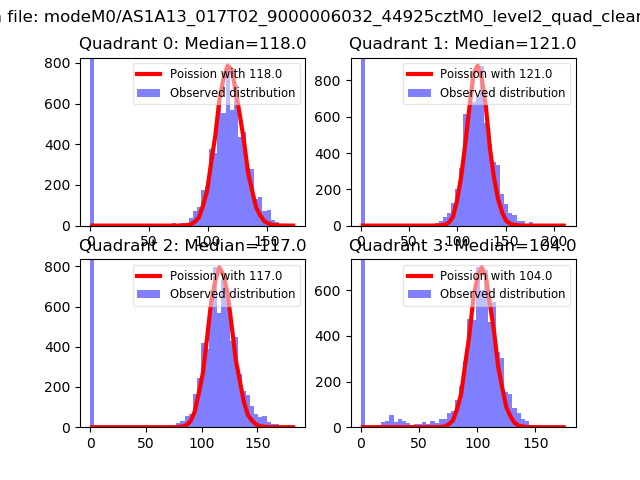 |
 |
| Quadrant-wise count rates Data is divided into 100 sec bins |
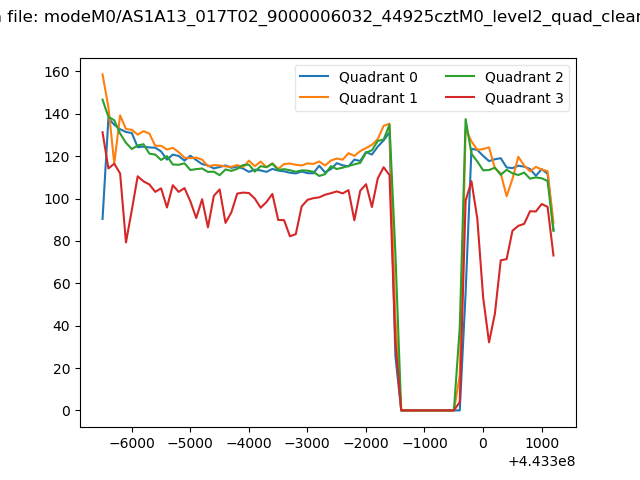 |
|
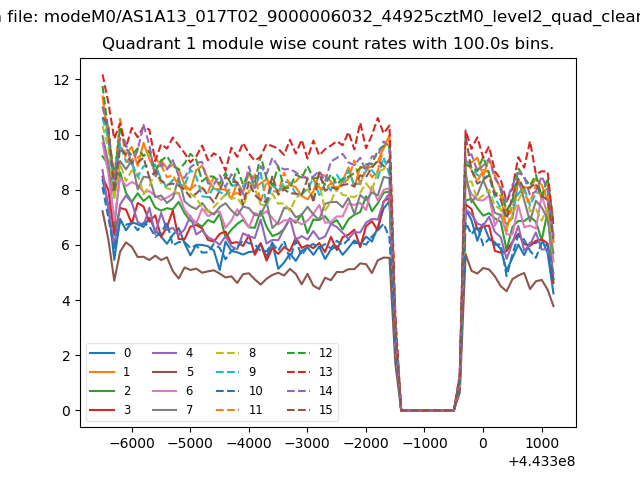
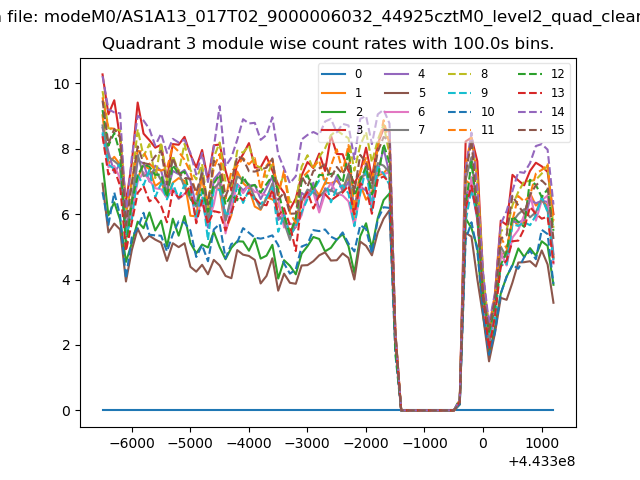
| Module-wise count rates for Quadrant A Data is divided into 100 sec bins |
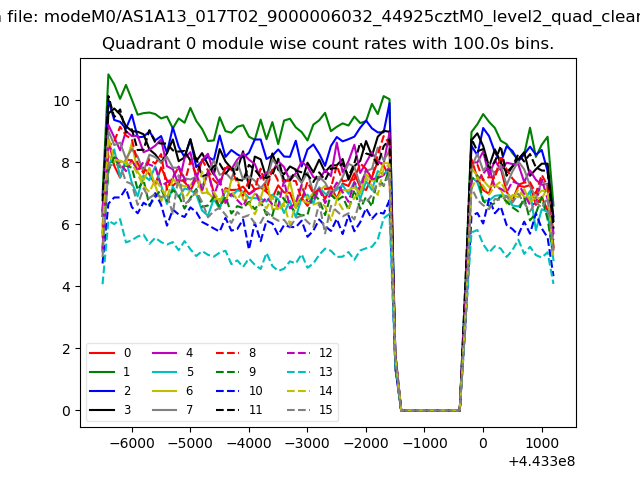 |
 |
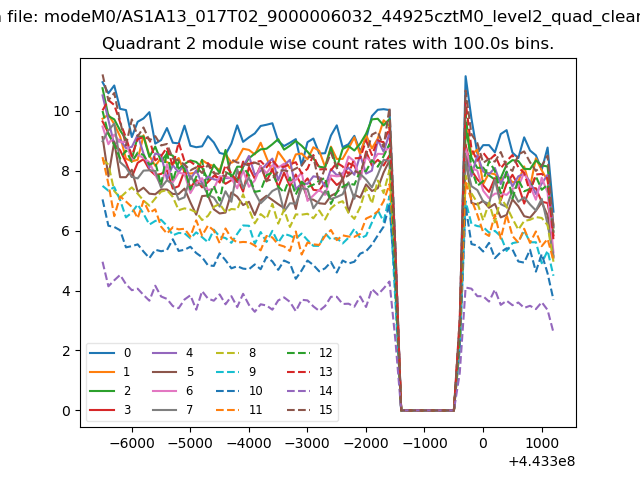
| Module-wise count rates for Quadrant B Data is divided into 100 sec bins |
 |
 |
| Module-wise count rates for Quadrant C Data is divided into 100 sec bins |
 |
 |
| Module-wise count rates for Quadrant D Data is divided into 100 sec bins |
 |
 |
| Parameter | Plot |
|---|---|
| CZT HV Monitor | 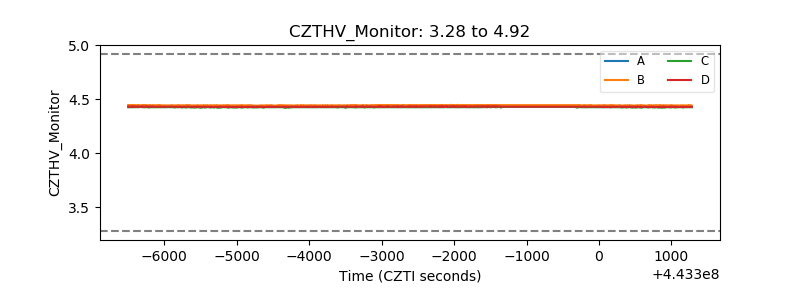 |
| D_VDD | 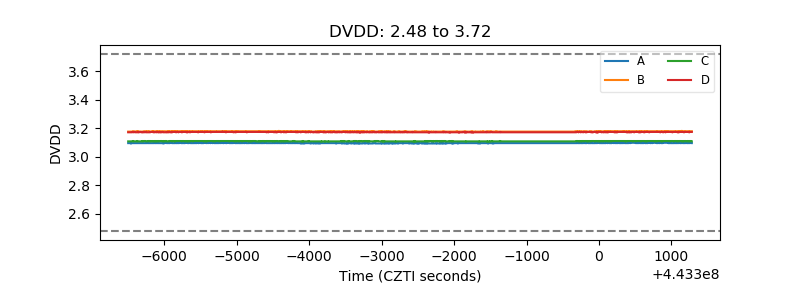 |
| Temperature 1 | 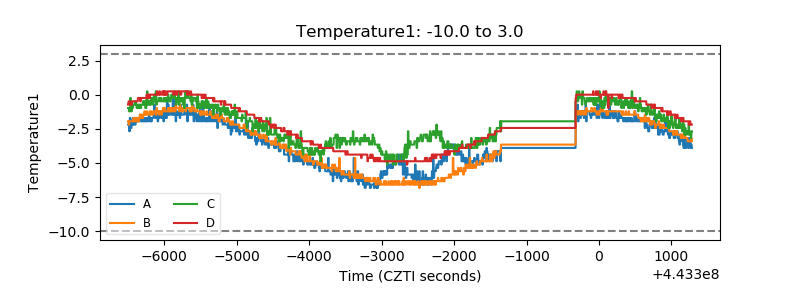 |
| Veto HV Monitor | 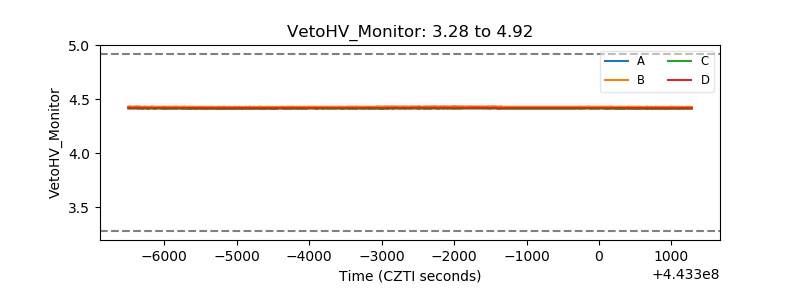 |
| Veto LLD | 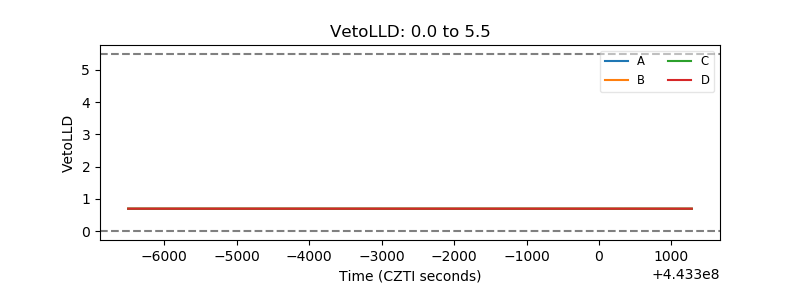 |
| Alpha Counter | 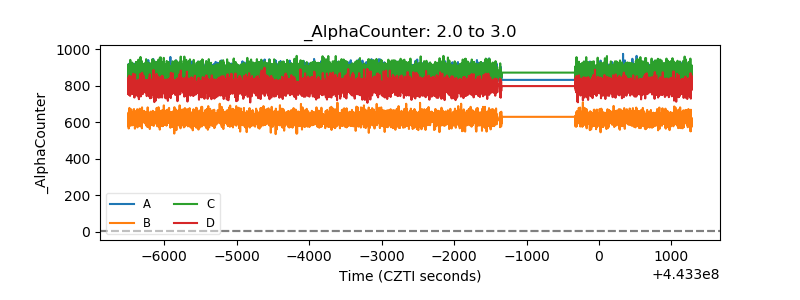 |
| _CPM_Rate | 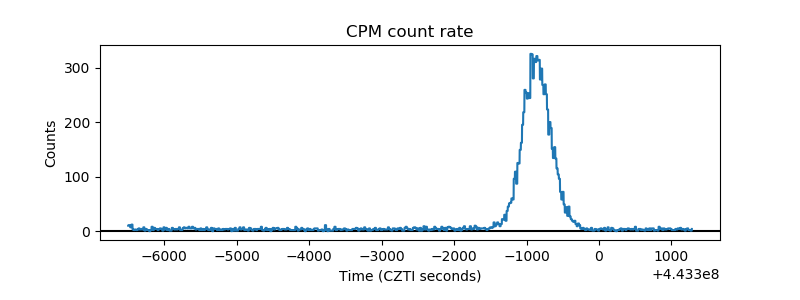 |
| CZT Counter | 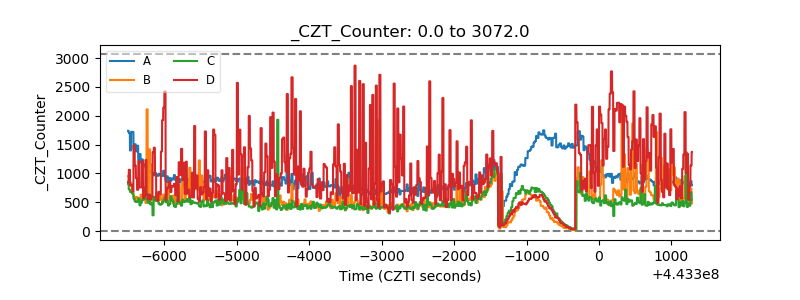 |
| +2.5 Volts monitor | 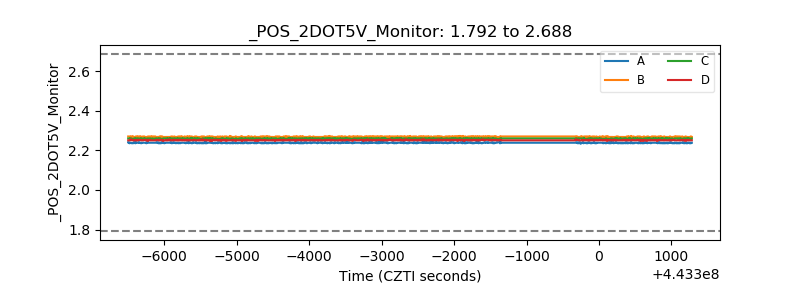 |
| +5 Volts monitor | 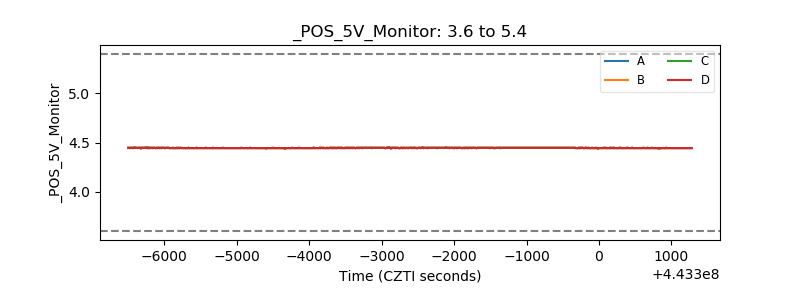 |
| _ROLL_ROT | 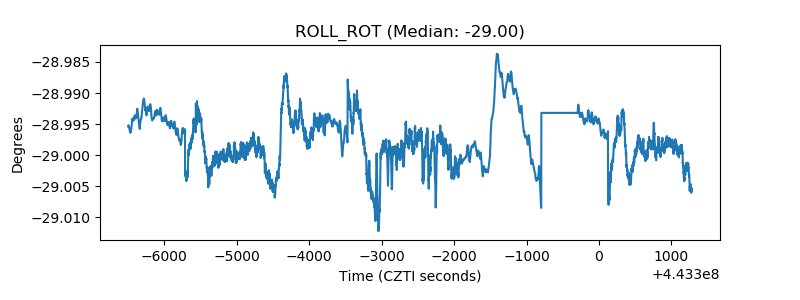 |
| _Roll_DEC | 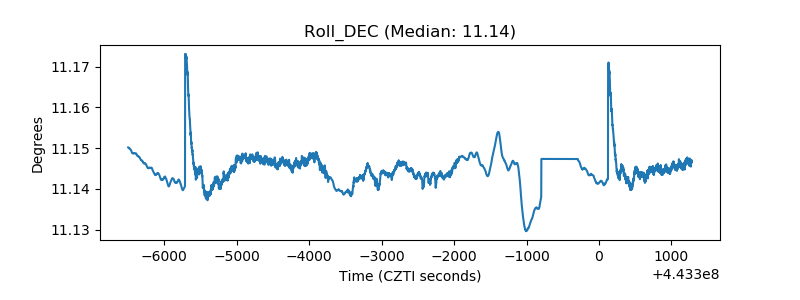 |
| _Roll_RA | 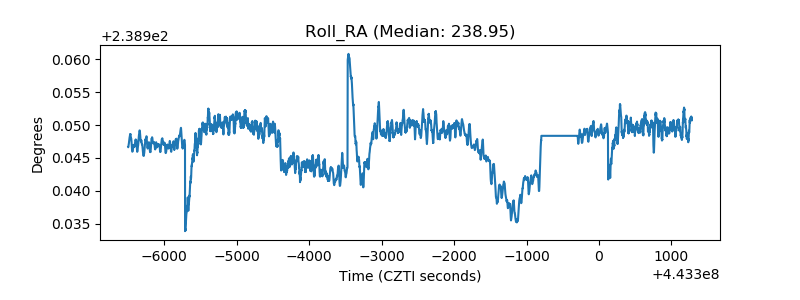 |
| Veto Counter | 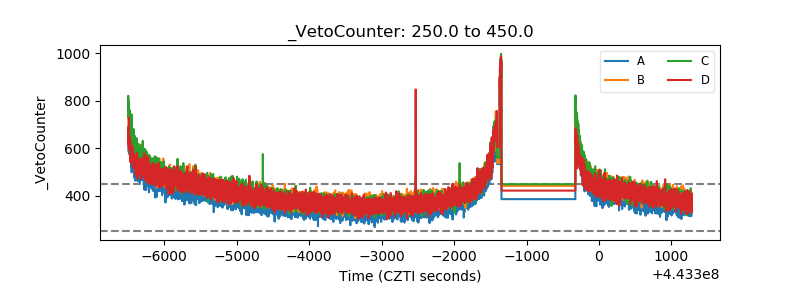 |