| Param | Original file | Final file |
|---|---|---|
| Filename | modeM0/AS1A13_017T02_9000006032_44926cztM0_level2.fits | modeM0/AS1A13_017T02_9000006032_44926cztM0_level2_quad_clean.evt |
| Size (bytes) | 601,297,920 | 113,425,920 |
| Size | 573.4 MB | 108.2 MB |
| Events in quadrant A | 5,928,919 | 762,385 |
| Events in quadrant B | 4,341,784 | 789,157 |
| Events in quadrant C | 3,355,792 | 781,894 |
| Events in quadrant D | 8,092,308 | 616,091 |
| Mode SS | |||
|---|---|---|---|
| Quadrant | BADHDUFLAG | Total packets | Discarded packets |
| A | 0 | 140 | 0 |
| B | 0 | 140 | 0 |
| C | 0 | 140 | 0 |
| D | 0 | 140 | 0 |
| Mode M0 | |||
|---|---|---|---|
| Quadrant | BADHDUFLAG | Total packets | Discarded packets |
| A | 0 | 22716 | 1 |
| B | 0 | 17683 | 1 |
| C | 0 | 14709 | 1 |
| D | 0 | 28914 | 1 |
| Mode M9 | |||
|---|---|---|---|
| Quadrant | BADHDUFLAG | Total packets | Discarded packets |
| A | 0 | 8 | 0 |
| B | 0 | 8 | 0 |
| C | 0 | 8 | 0 |
| D | 0 | 8 | 0 |
| Quadrant | Total seconds | Saturated seconds | Saturation percentage |
|---|---|---|---|
| A | 6963 | 291 | 4.179233% |
| B | 6962 | 282 | 4.050560% |
| C | 6963 | 73 | 1.048399% |
| D | 6963 | 1269 | 18.224903% |
Noise dominated data is calculated using 1-second bins in cleaned event files. If a bin has >2000 counts, and if more than 50% of those come from <1% of pixels, then it is considered to be noise-dominated and hence unusable.
| Quadrant | # 1 sec bins | Bins with >0 counts | Bins with >2000 counts | High rate bins dominated by noise | Noise dominated (total time) | Noise dominated (detector-on time) | Marked lightcurve |
|---|---|---|---|---|---|---|---|
| A | 7703 | 6964 | 2 | 2 | 0.03% | 0.03% | 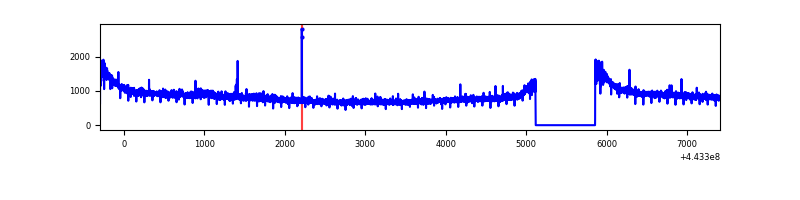 |
| B | 7702 | 6963 | 70 | 70 | 0.91% | 1.01% | 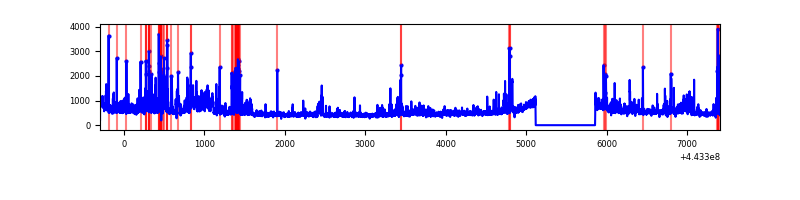 |
| C | 7703 | 6964 | 8 | 8 | 0.10% | 0.11% | 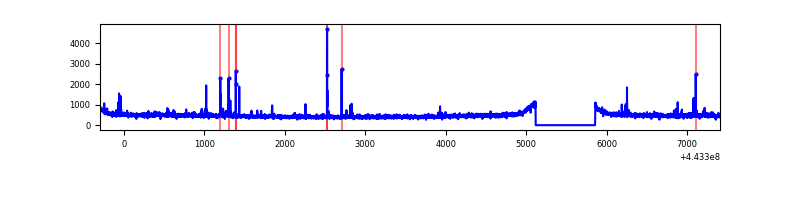 |
| D | 7703 | 6963 | 826 | 826 | 10.72% | 11.86% | 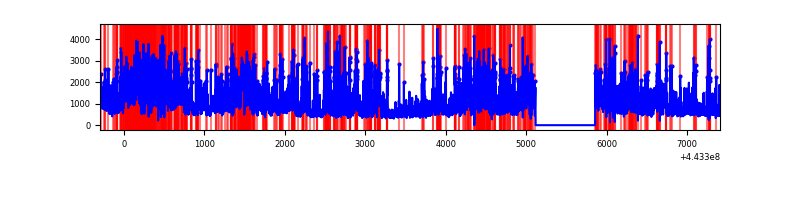 |
Top three noisy pixels from each quadrant. If the there are fewer than three noisy pixels in the level2.evt file, extra rows are filled as -1
| Pixel properties | Quadrant properties | ||||||
|---|---|---|---|---|---|---|---|
| Quadrant | DetID | PixID | Counts | Sigma | Mean | Median | Sigma |
| A | 10 | 83 | 2650880 | 15404.02 | 824 | 804 | 172.0 |
| A | 0 | 247 | 40897 | 233.05 | 824 | 804 | 172.0 |
| A | 0 | 243 | 36889 | 209.75 | 824 | 804 | 172.0 |
| B | 4 | 171 | 430463 | 2653.03 | 824 | 799 | 162.0 |
| B | 0 | 219 | 181709 | 1117.06 | 824 | 799 | 162.0 |
| B | 0 | 183 | 99981 | 612.41 | 824 | 799 | 162.0 |
| C | 12 | 2 | 62687 | 321.3 | 821 | 827 | 192.5 |
| C | 3 | 233 | 33149 | 167.88 | 821 | 827 | 192.5 |
| C | 15 | 208 | 31748 | 160.61 | 821 | 827 | 192.5 |
| D | 1 | 52 | 2286425 | 11790.26 | 766 | 741 | 193.9 |
| D | 1 | 47 | 1078532 | 5559.57 | 766 | 741 | 193.9 |
| D | 13 | 249 | 805924 | 4153.38 | 766 | 741 | 193.9 |
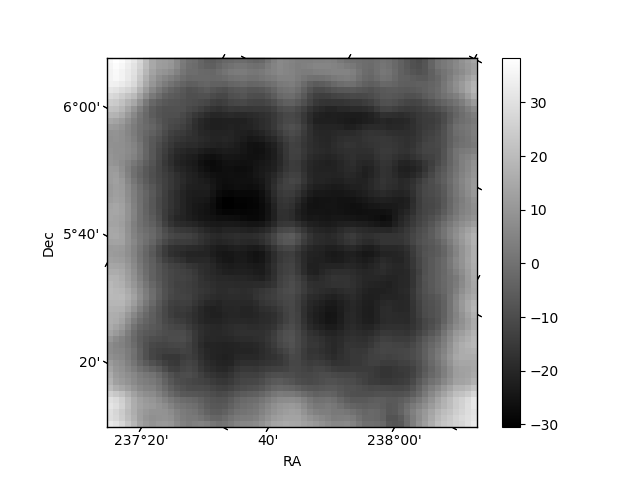
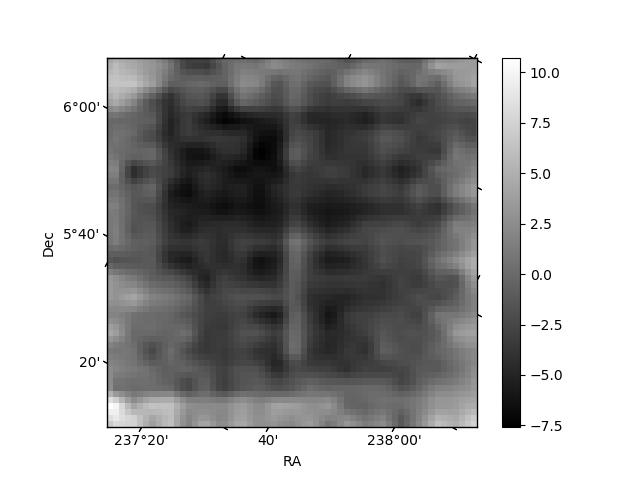
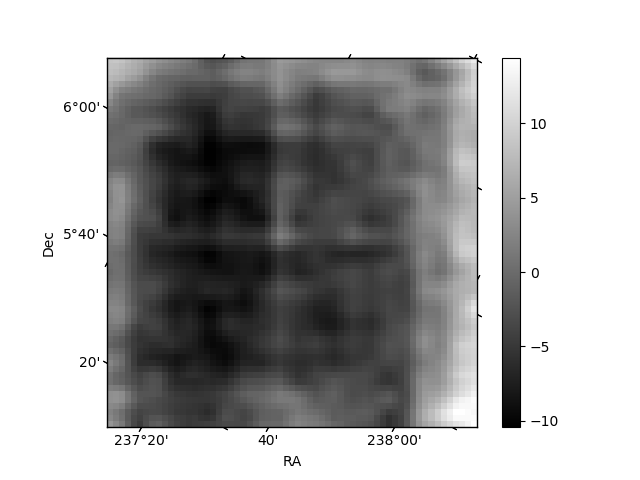
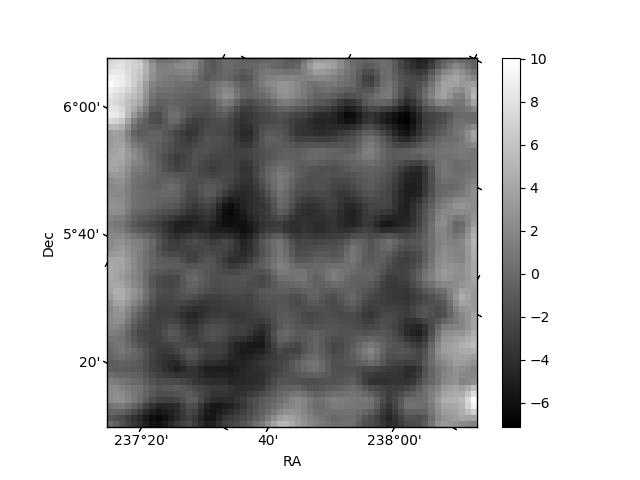
Histogram calculated using DETX and DETY for each event in the final _common_clean file
| Quadrant A | 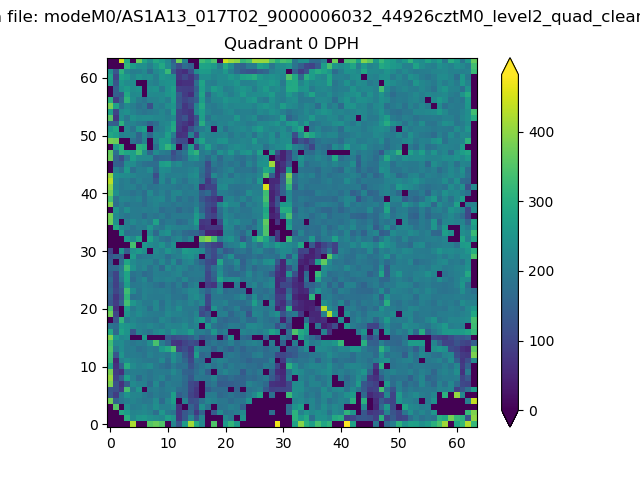 |
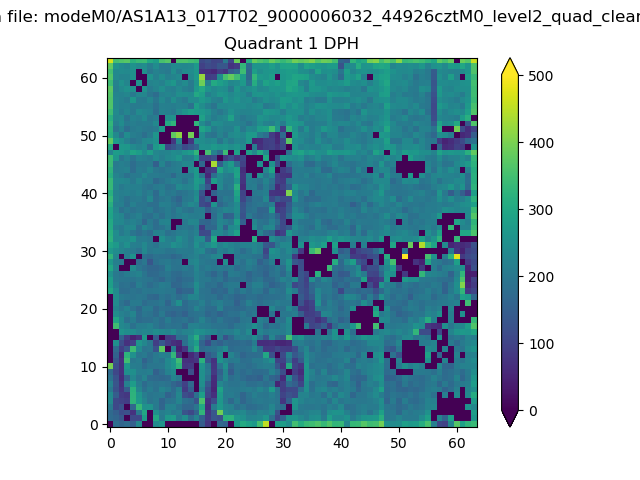 |
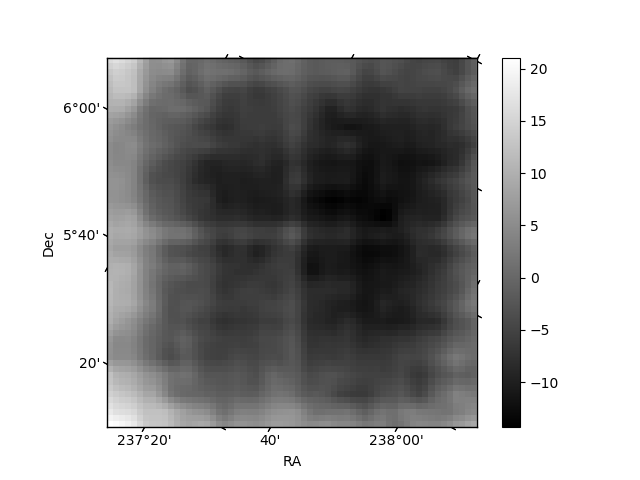
Quadrant B |
|---|---|---|---|
| Quadrant D | 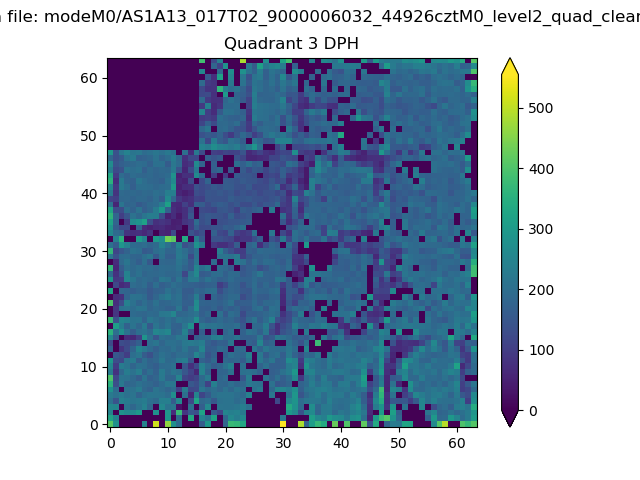 |
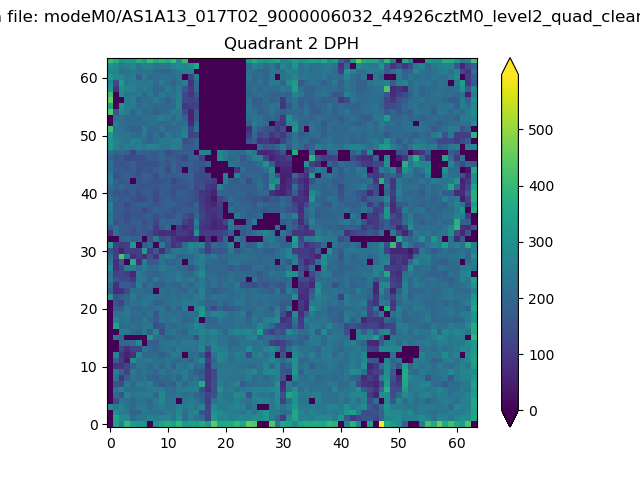 |
Quadrant C |
| Plot type | Count rate plots | Images |
|---|---|---|
| Comparison with Poisson distribution Blue bars denote a histogram of data divided into 1 sec bins. Red curve is a Poisson curve with rate = median count rate of data. |
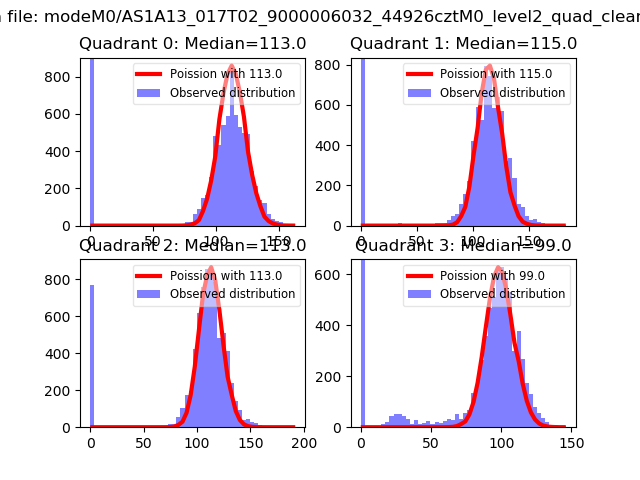 |
 |
| Quadrant-wise count rates Data is divided into 100 sec bins |
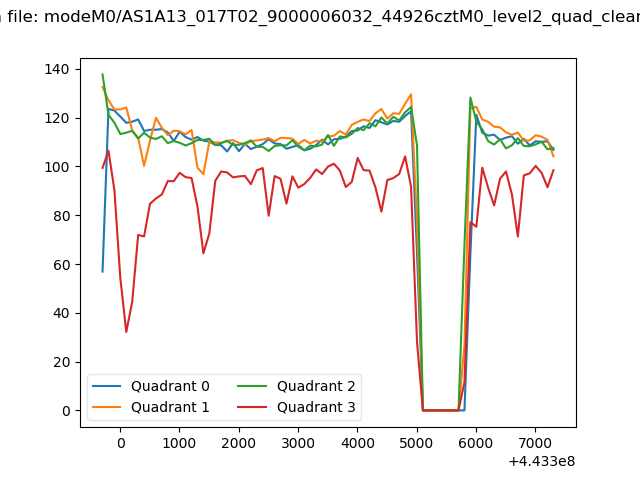 |
|
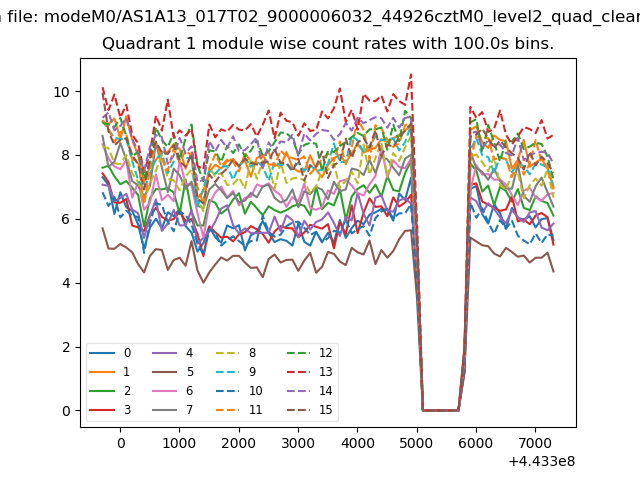
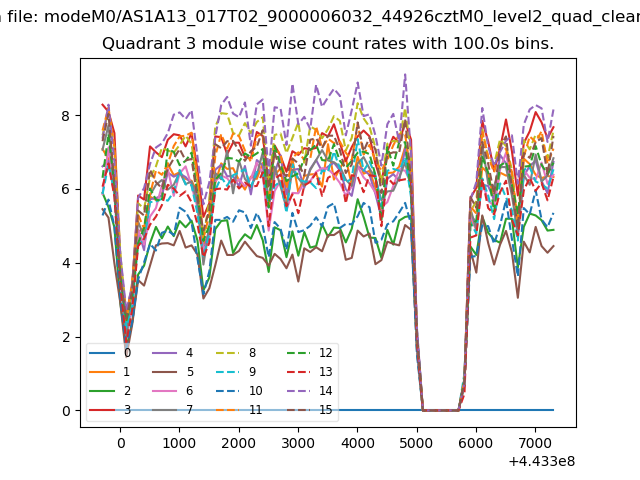
| Module-wise count rates for Quadrant A Data is divided into 100 sec bins |
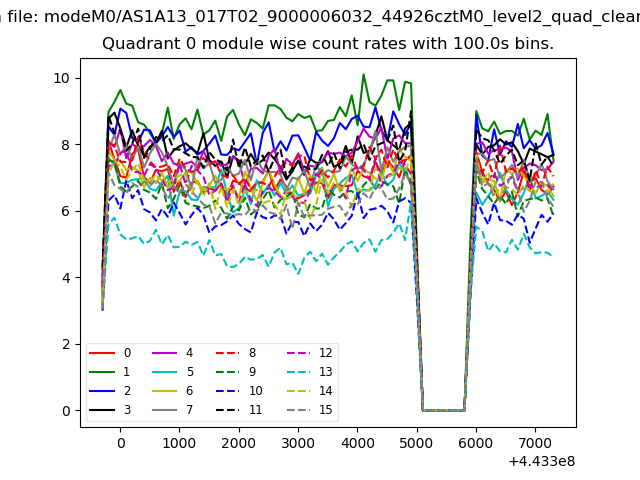 |
 |
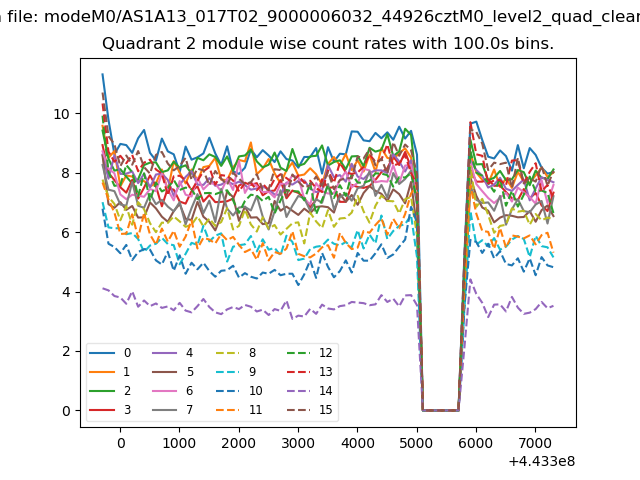
| Module-wise count rates for Quadrant B Data is divided into 100 sec bins |
 |
 |
| Module-wise count rates for Quadrant C Data is divided into 100 sec bins |
 |
 |
| Module-wise count rates for Quadrant D Data is divided into 100 sec bins |
 |
 |
| Parameter | Plot |
|---|---|
| CZT HV Monitor | 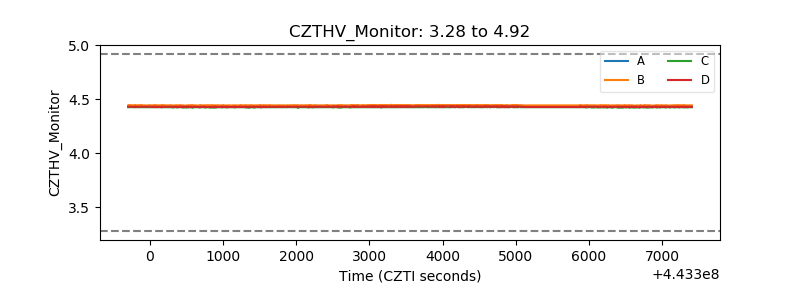 |
| D_VDD | 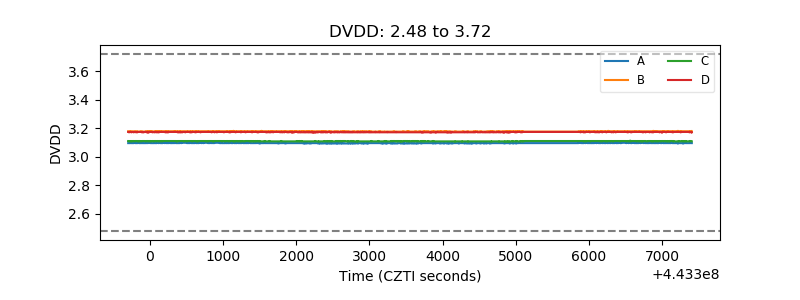 |
| Temperature 1 | 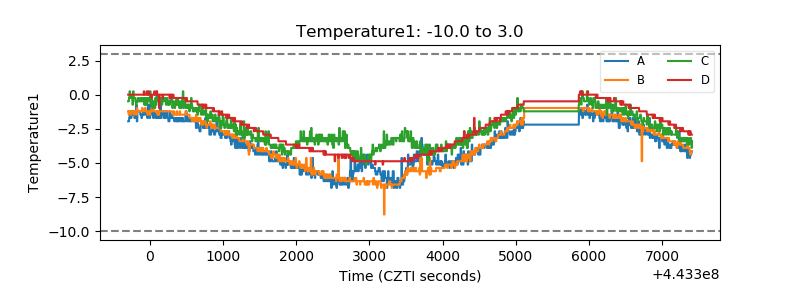 |
| Veto HV Monitor | 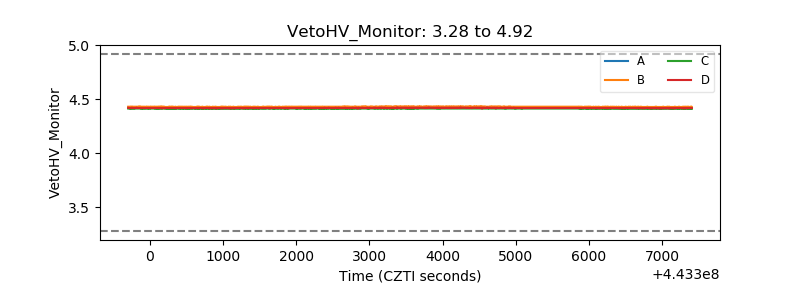 |
| Veto LLD | 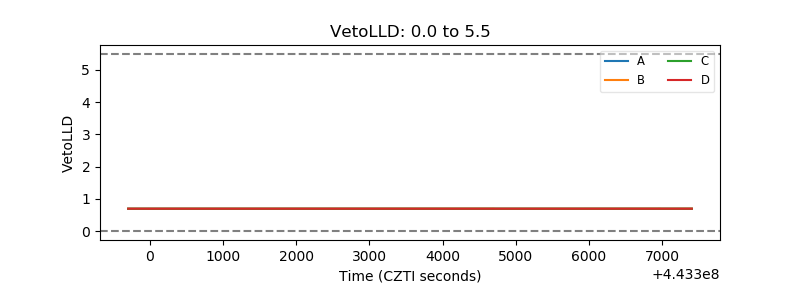 |
| Alpha Counter | 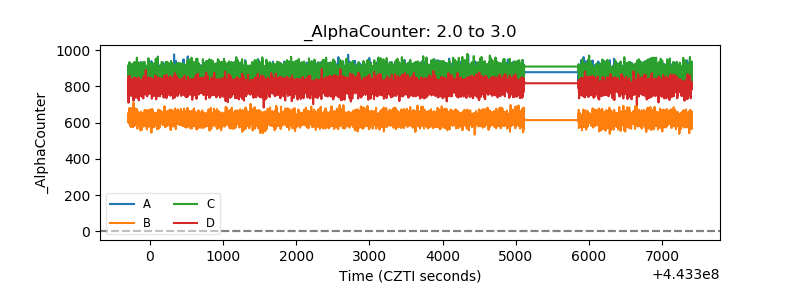 |
| _CPM_Rate | 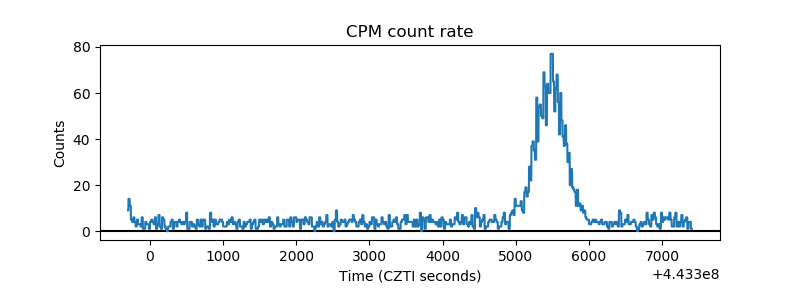 |
| CZT Counter | 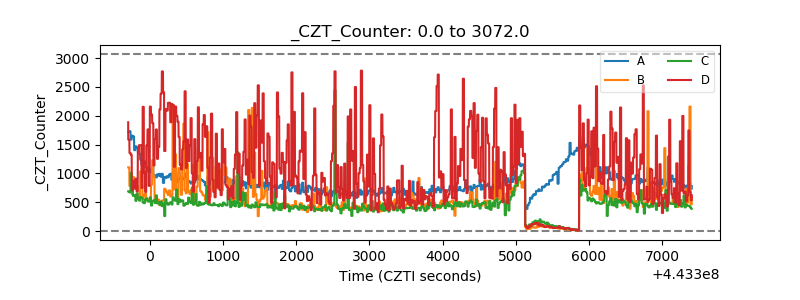 |
| +2.5 Volts monitor | 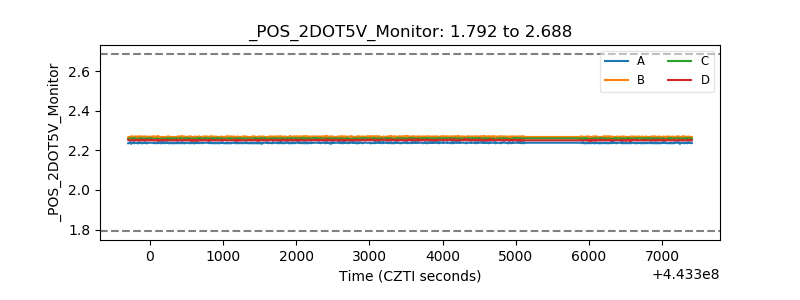 |
| +5 Volts monitor | 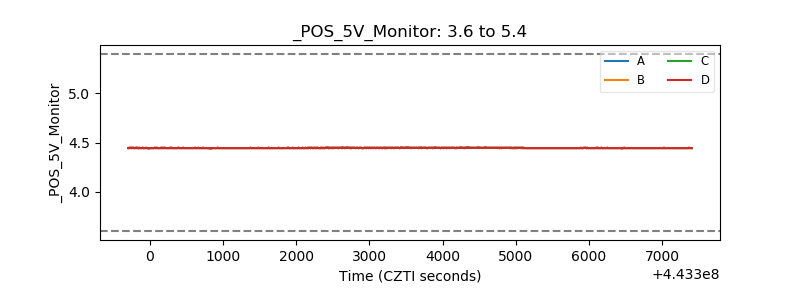 |
| _ROLL_ROT | 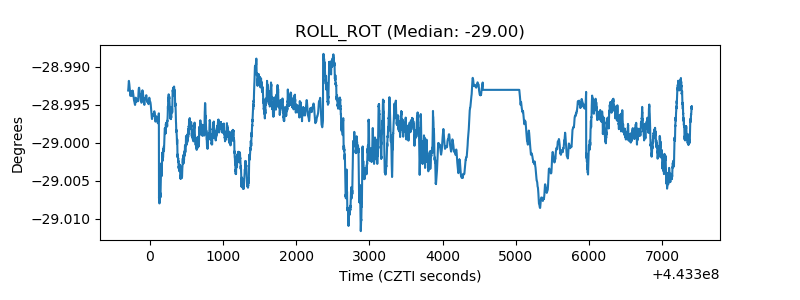 |
| _Roll_DEC | 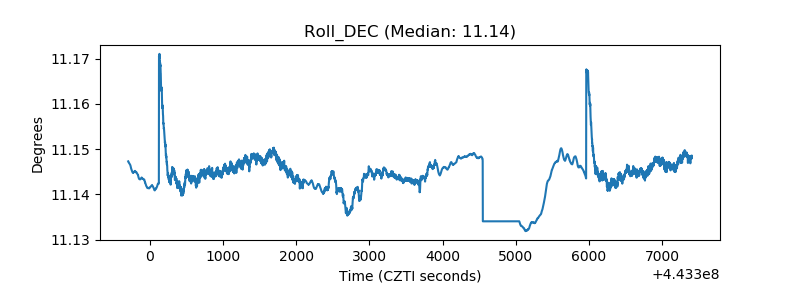 |
| _Roll_RA | 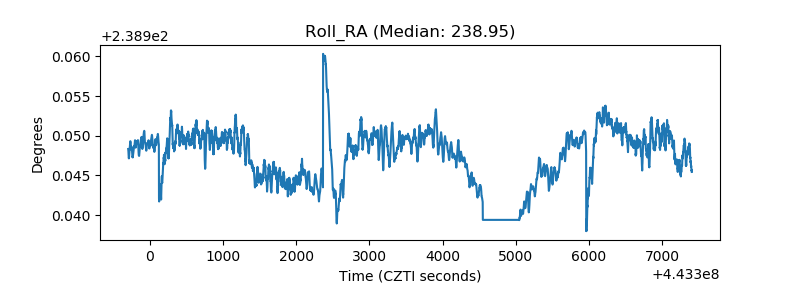 |
| Veto Counter | 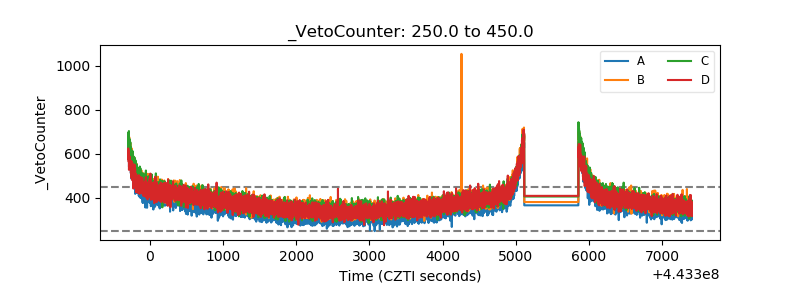 |