| Param | Original file | Final file |
|---|---|---|
| Filename | modeM0/AS1A13_017T02_9000006032_44927cztM0_level2.fits | modeM0/AS1A13_017T02_9000006032_44927cztM0_level2_quad_clean.evt |
| Size (bytes) | 670,397,760 | 121,371,840 |
| Size | 639.3 MB | 115.7 MB |
| Events in quadrant A | 6,435,498 | 827,774 |
| Events in quadrant B | 4,623,711 | 848,705 |
| Events in quadrant C | 3,810,028 | 853,229 |
| Events in quadrant D | 9,345,108 | 605,672 |
| Mode SS | |||
|---|---|---|---|
| Quadrant | BADHDUFLAG | Total packets | Discarded packets |
| A | 0 | 158 | 0 |
| B | 0 | 158 | 0 |
| C | 0 | 158 | 0 |
| D | 0 | 158 | 0 |
| Mode M0 | |||
|---|---|---|---|
| Quadrant | BADHDUFLAG | Total packets | Discarded packets |
| A | 0 | 24876 | 1 |
| B | 0 | 19095 | 1 |
| C | 0 | 16793 | 1 |
| D | 0 | 33156 | 1 |
| Mode M9 | |||
|---|---|---|---|
| Quadrant | BADHDUFLAG | Total packets | Discarded packets |
| A | 0 | 9 | 0 |
| B | 0 | 9 | 0 |
| C | 0 | 9 | 0 |
| D | 0 | 9 | 0 |
| Quadrant | Total seconds | Saturated seconds | Saturation percentage |
|---|---|---|---|
| A | 7760 | 449 | 5.786082% |
| B | 7761 | 440 | 5.669373% |
| C | 7760 | 142 | 1.829897% |
| D | 7760 | 1957 | 25.219072% |
Noise dominated data is calculated using 1-second bins in cleaned event files. If a bin has >2000 counts, and if more than 50% of those come from <1% of pixels, then it is considered to be noise-dominated and hence unusable.
| Quadrant | # 1 sec bins | Bins with >0 counts | Bins with >2000 counts | High rate bins dominated by noise | Noise dominated (total time) | Noise dominated (detector-on time) | Marked lightcurve |
|---|---|---|---|---|---|---|---|
| A | 8550 | 7762 | 8 | 8 | 0.09% | 0.10% | 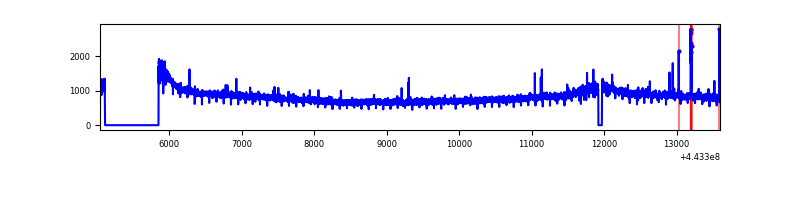 |
| B | 8551 | 7763 | 64 | 64 | 0.75% | 0.82% | 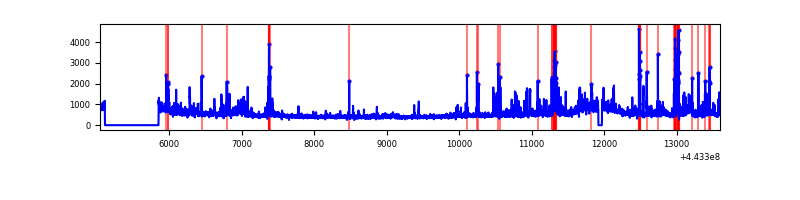 |
| C | 8550 | 7762 | 10 | 10 | 0.12% | 0.13% | 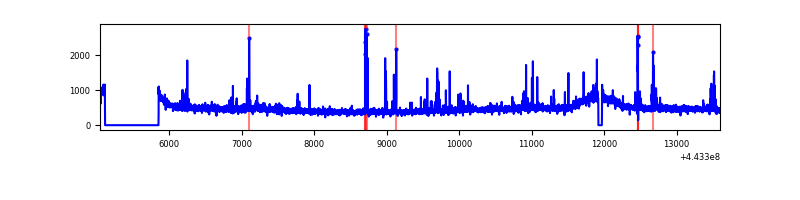 |
| D | 8550 | 7762 | 1378 | 1378 | 16.12% | 17.75% | 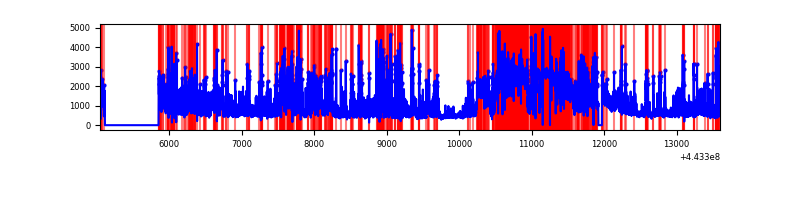 |
Top three noisy pixels from each quadrant. If the there are fewer than three noisy pixels in the level2.evt file, extra rows are filled as -1
| Pixel properties | Quadrant properties | ||||||
|---|---|---|---|---|---|---|---|
| Quadrant | DetID | PixID | Counts | Sigma | Mean | Median | Sigma |
| A | 10 | 83 | 2769060 | 14341.48 | 923 | 901 | 193.0 |
| A | 0 | 243 | 33519 | 168.99 | 923 | 901 | 193.0 |
| A | 9 | 254 | 28387 | 142.4 | 923 | 901 | 193.0 |
| B | 0 | 183 | 185092 | 1018.91 | 921 | 892 | 180.8 |
| B | 5 | 172 | 125483 | 689.18 | 921 | 892 | 180.8 |
| B | 10 | 3 | 111808 | 613.54 | 921 | 892 | 180.8 |
| C | 14 | 254 | 56828 | 257.28 | 920 | 927 | 217.3 |
| C | 12 | 2 | 49251 | 222.41 | 920 | 927 | 217.3 |
| C | 2 | 14 | 34969 | 156.68 | 920 | 927 | 217.3 |
| D | 13 | 187 | 2137442 | 10455.01 | 807 | 782 | 204.4 |
| D | 1 | 52 | 1681840 | 8225.68 | 807 | 782 | 204.4 |
| D | 13 | 249 | 726683 | 3551.95 | 807 | 782 | 204.4 |
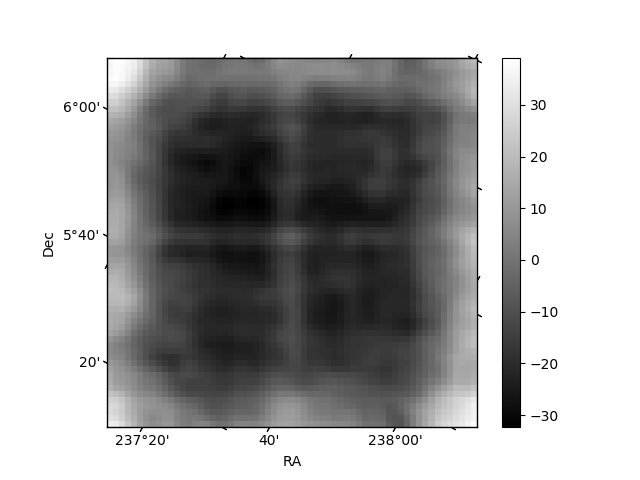
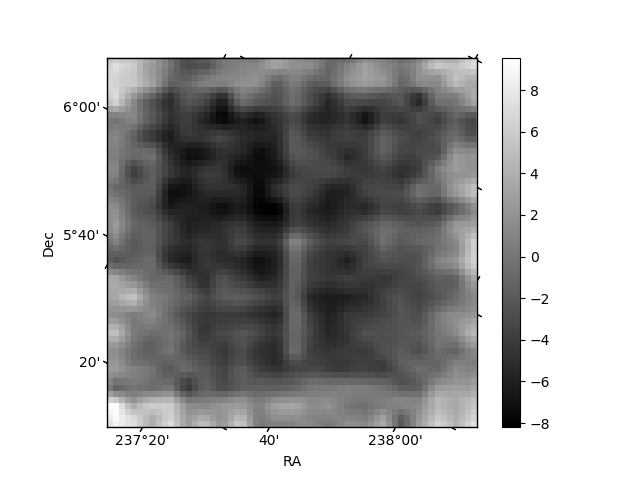
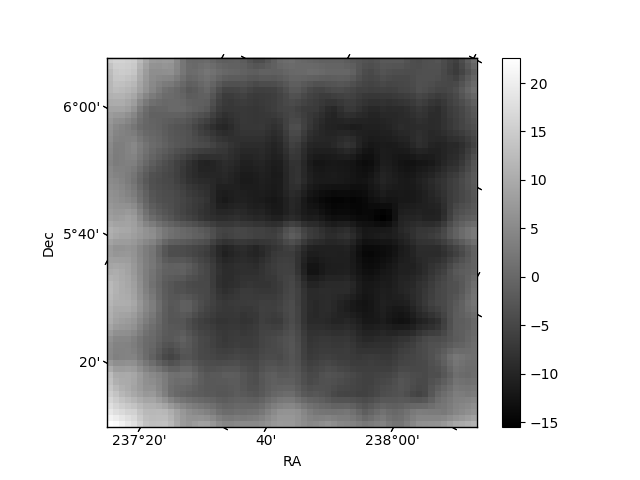
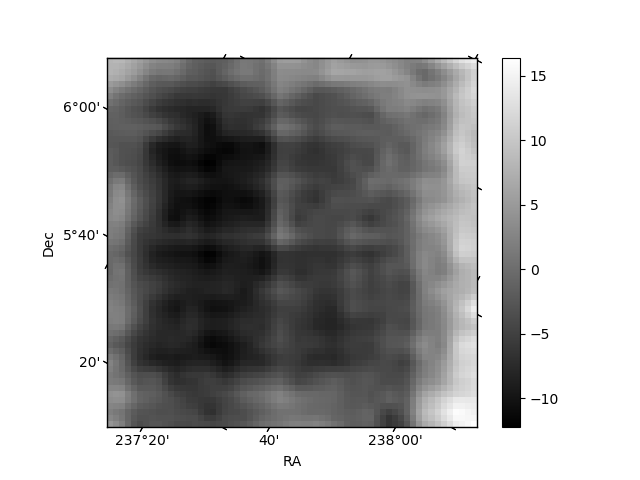
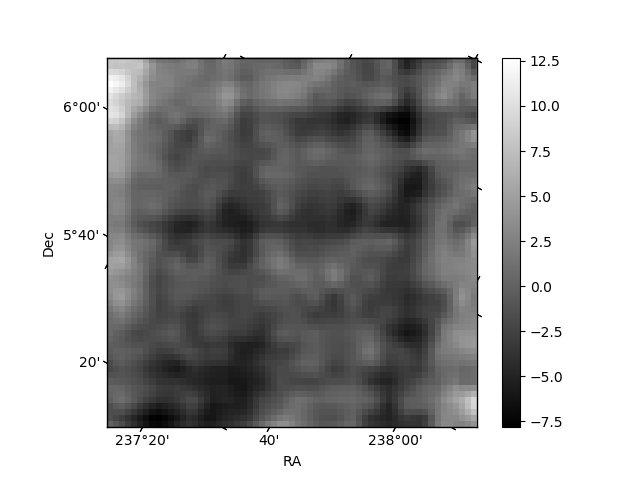
Histogram calculated using DETX and DETY for each event in the final _common_clean file
| Quadrant A | 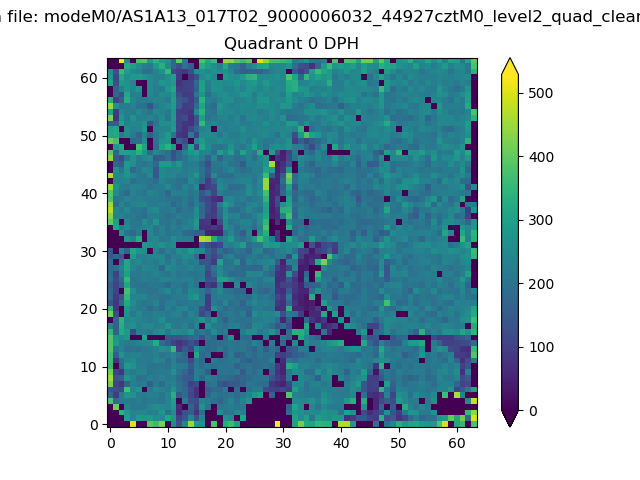 |
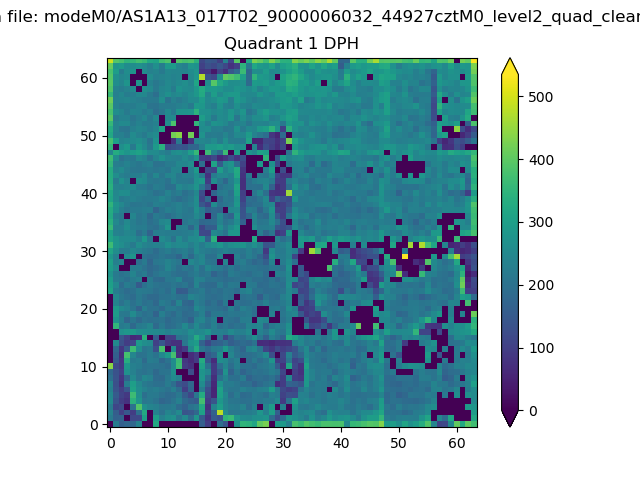 |
Quadrant B |
|---|---|---|---|
| Quadrant D | 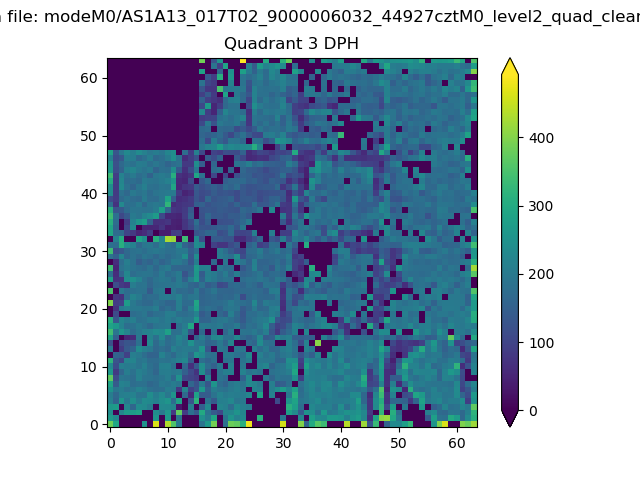 |
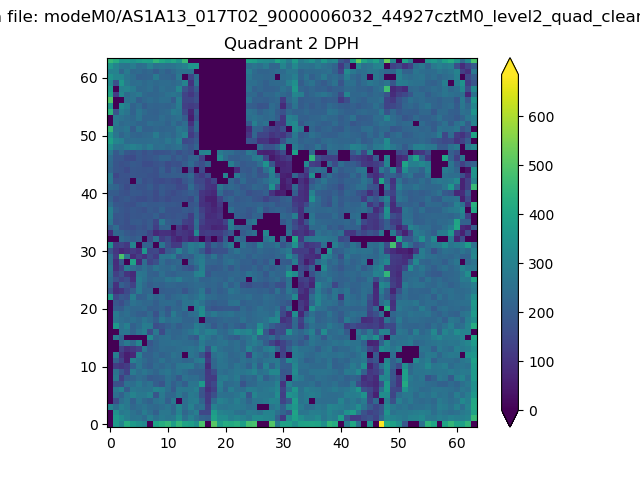 |
Quadrant C |
| Plot type | Count rate plots | Images |
|---|---|---|
| Comparison with Poisson distribution Blue bars denote a histogram of data divided into 1 sec bins. Red curve is a Poisson curve with rate = median count rate of data. |
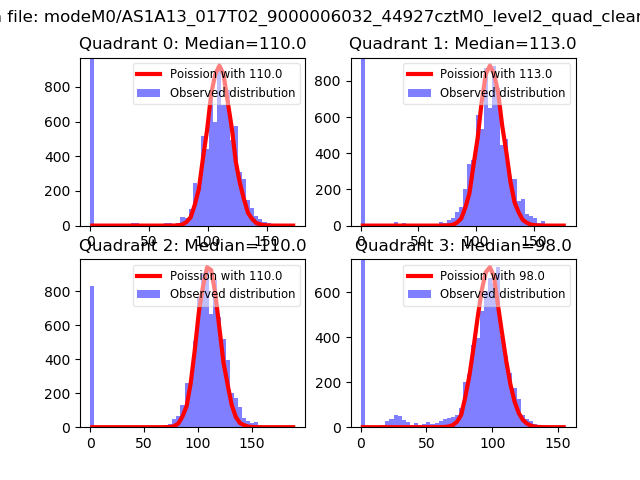 |
 |
| Quadrant-wise count rates Data is divided into 100 sec bins |
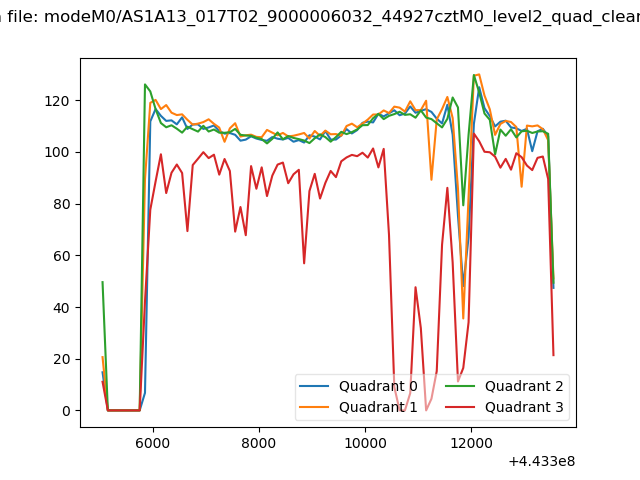 |
|
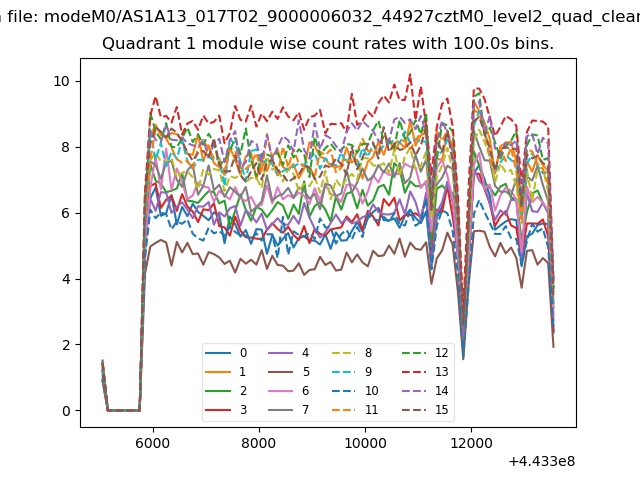
| Module-wise count rates for Quadrant A Data is divided into 100 sec bins |
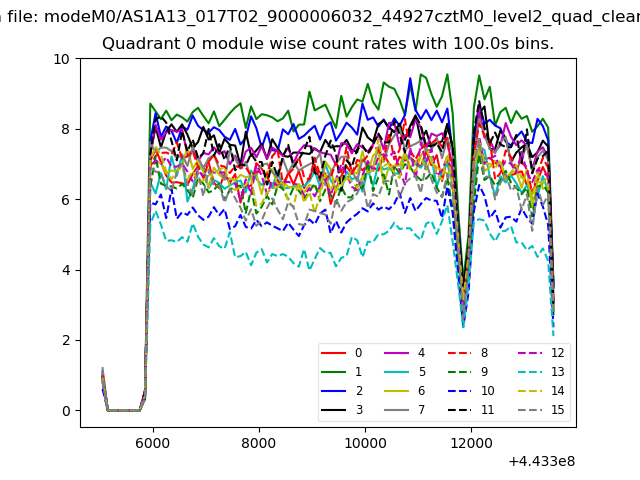 |
 |
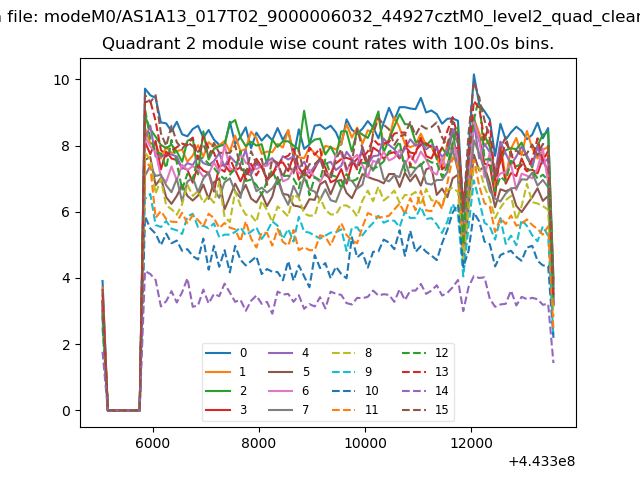
| Module-wise count rates for Quadrant B Data is divided into 100 sec bins |
 |
 |
| Module-wise count rates for Quadrant C Data is divided into 100 sec bins |
 |
 |
| Module-wise count rates for Quadrant D Data is divided into 100 sec bins |
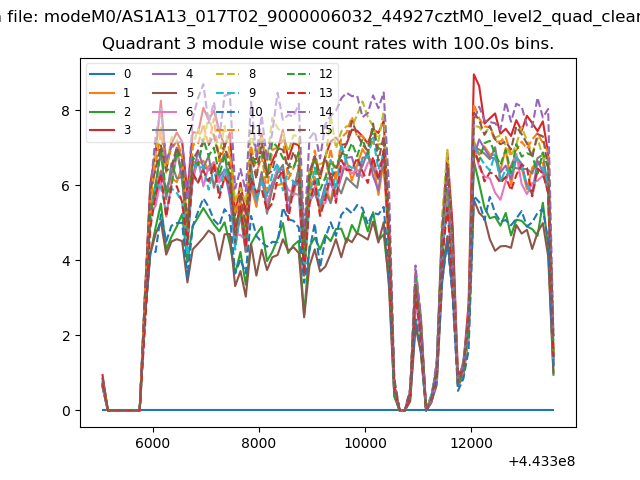 |
 |
| Parameter | Plot |
|---|---|
| CZT HV Monitor | 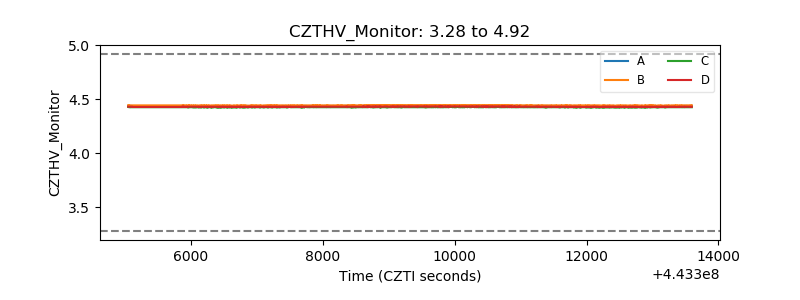 |
| D_VDD | 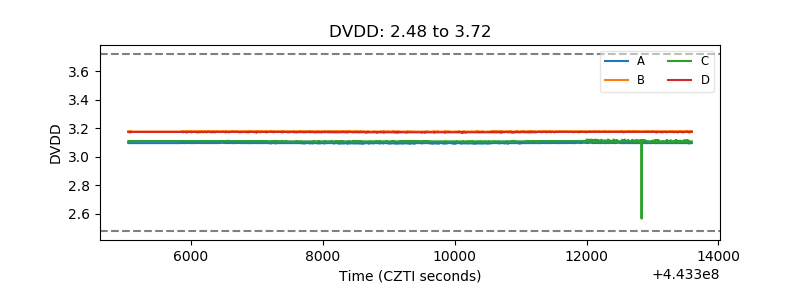 |
| Temperature 1 | 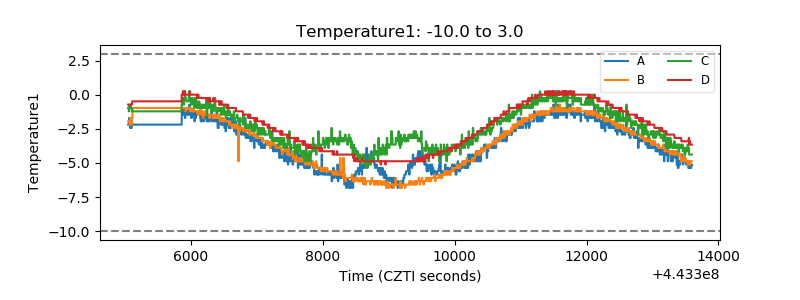 |
| Veto HV Monitor | 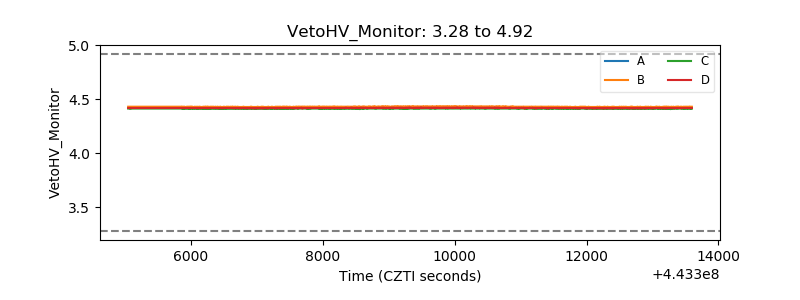 |
| Veto LLD | 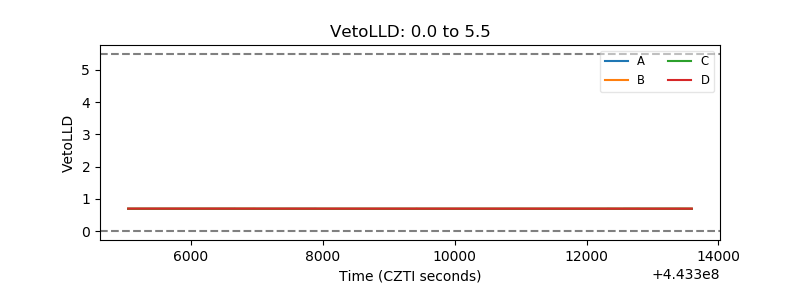 |
| Alpha Counter | 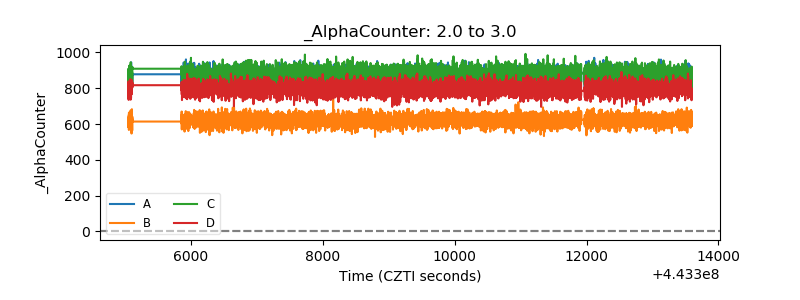 |
| _CPM_Rate | 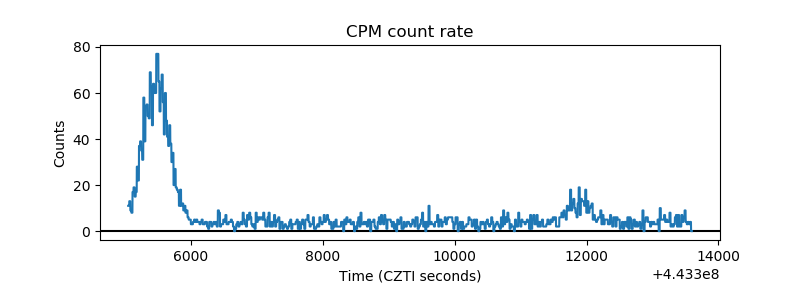 |
| CZT Counter | 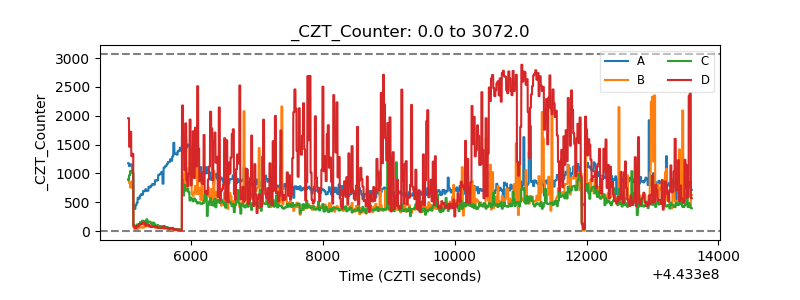 |
| +2.5 Volts monitor | 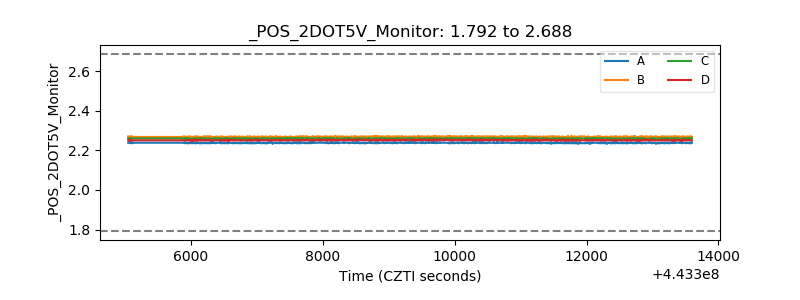 |
| +5 Volts monitor | 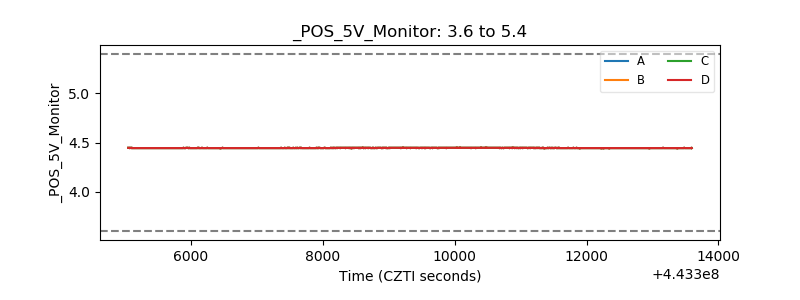 |
| _ROLL_ROT | 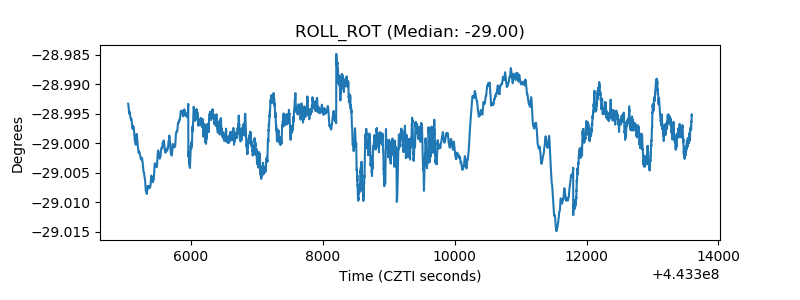 |
| _Roll_DEC | 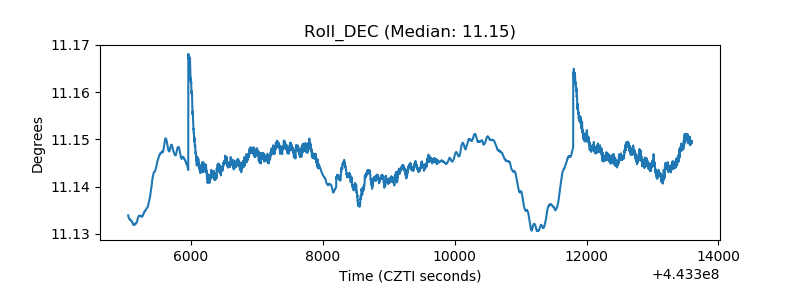 |
| _Roll_RA | 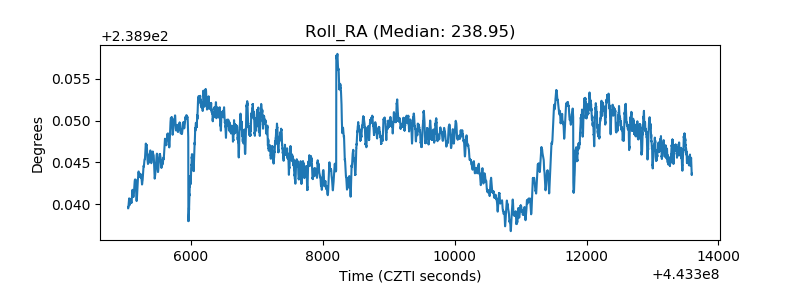 |
| Veto Counter | 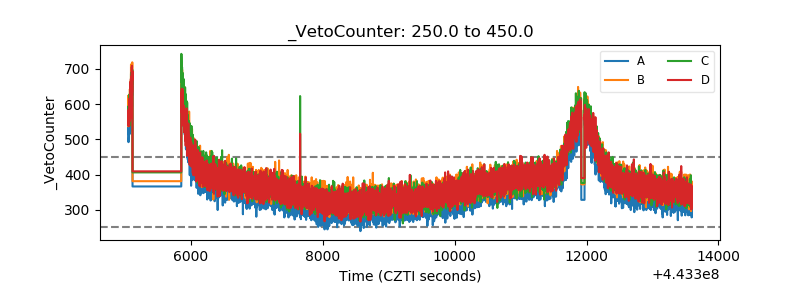 |