| Param | Original file | Final file |
|---|---|---|
| Filename | modeM0/AS1A13_017T02_9000006032_44928cztM0_level2.fits | modeM0/AS1A13_017T02_9000006032_44928cztM0_level2_quad_clean.evt |
| Size (bytes) | 642,830,400 | 130,544,640 |
| Size | 613.1 MB | 124.5 MB |
| Events in quadrant A | 6,534,448 | 882,086 |
| Events in quadrant B | 4,687,501 | 900,899 |
| Events in quadrant C | 3,861,559 | 885,076 |
| Events in quadrant D | 8,081,534 | 718,940 |
| Mode SS | |||
|---|---|---|---|
| Quadrant | BADHDUFLAG | Total packets | Discarded packets |
| A | 0 | 164 | 0 |
| B | 0 | 164 | 0 |
| C | 0 | 164 | 0 |
| D | 0 | 164 | 0 |
| Mode M0 | |||
|---|---|---|---|
| Quadrant | BADHDUFLAG | Total packets | Discarded packets |
| A | 0 | 25524 | 1 |
| B | 0 | 19479 | 1 |
| C | 0 | 17221 | 1 |
| D | 0 | 29704 | 5 |
| Mode M9 | |||
|---|---|---|---|
| Quadrant | BADHDUFLAG | Total packets | Discarded packets |
| A | 0 | 1 | 0 |
| B | 0 | 1 | 0 |
| C | 0 | 1 | 0 |
| D | 0 | 1 | 0 |
| Quadrant | Total seconds | Saturated seconds | Saturation percentage |
|---|---|---|---|
| A | 8138 | 223 | 2.740231% |
| B | 8139 | 259 | 3.182209% |
| C | 8139 | 67 | 0.823197% |
| D | 8138 | 1097 | 13.479971% |
Noise dominated data is calculated using 1-second bins in cleaned event files. If a bin has >2000 counts, and if more than 50% of those come from <1% of pixels, then it is considered to be noise-dominated and hence unusable.
| Quadrant | # 1 sec bins | Bins with >0 counts | Bins with >2000 counts | High rate bins dominated by noise | Noise dominated (total time) | Noise dominated (detector-on time) | Marked lightcurve |
|---|---|---|---|---|---|---|---|
| A | 8188 | 8139 | 15 | 15 | 0.18% | 0.18% | 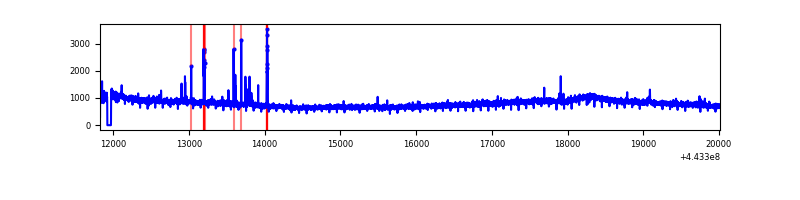 |
| B | 8189 | 8140 | 55 | 55 | 0.67% | 0.68% | 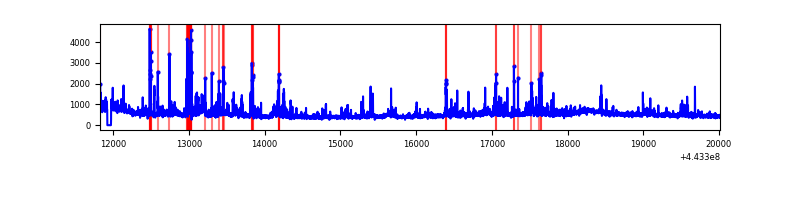 |
| C | 8189 | 8140 | 6 | 6 | 0.07% | 0.07% | 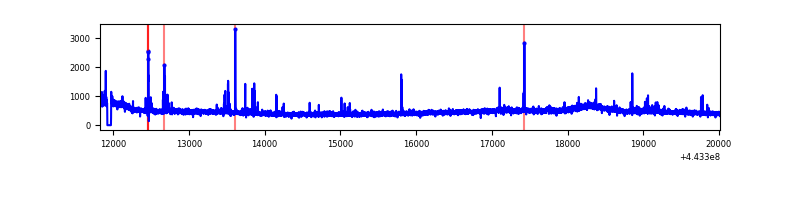 |
| D | 8189 | 8140 | 757 | 757 | 9.24% | 9.30% | 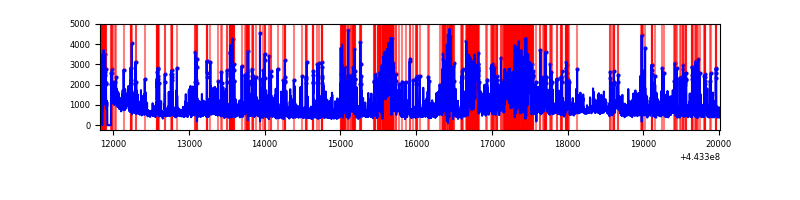 |
Top three noisy pixels from each quadrant. If the there are fewer than three noisy pixels in the level2.evt file, extra rows are filled as -1
| Pixel properties | Quadrant properties | ||||||
|---|---|---|---|---|---|---|---|
| Quadrant | DetID | PixID | Counts | Sigma | Mean | Median | Sigma |
| A | 10 | 83 | 2705853 | 13636.8 | 951 | 928 | 198.4 |
| A | 7 | 191 | 28480 | 138.9 | 951 | 928 | 198.4 |
| A | 9 | 254 | 26782 | 130.34 | 951 | 928 | 198.4 |
| B | 4 | 171 | 244228 | 1304.17 | 948 | 920 | 186.6 |
| B | 0 | 183 | 141686 | 754.53 | 948 | 920 | 186.6 |
| B | 10 | 3 | 107625 | 571.96 | 948 | 920 | 186.6 |
| C | 3 | 233 | 60934 | 269.57 | 941 | 947 | 222.5 |
| C | 14 | 254 | 39076 | 171.34 | 941 | 947 | 222.5 |
| C | 12 | 250 | 35353 | 154.61 | 941 | 947 | 222.5 |
| D | 1 | 52 | 1500087 | 6676.09 | 887 | 858 | 224.6 |
| D | 13 | 187 | 714739 | 3178.92 | 887 | 858 | 224.6 |
| D | 13 | 249 | 600170 | 2668.74 | 887 | 858 | 224.6 |
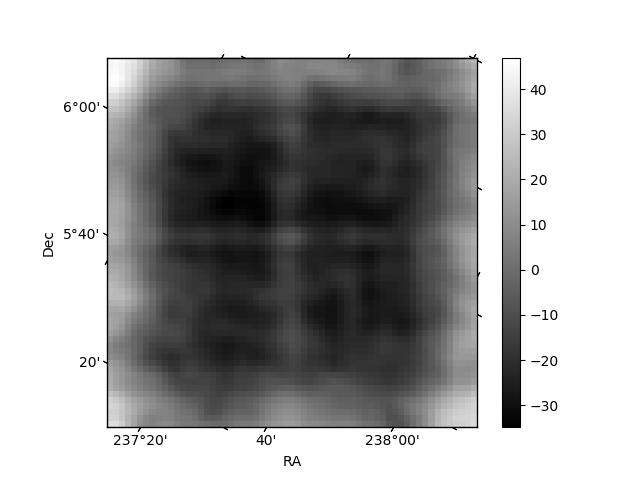
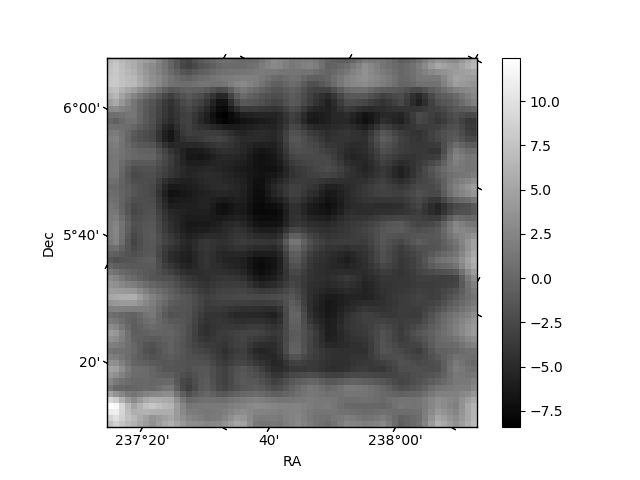
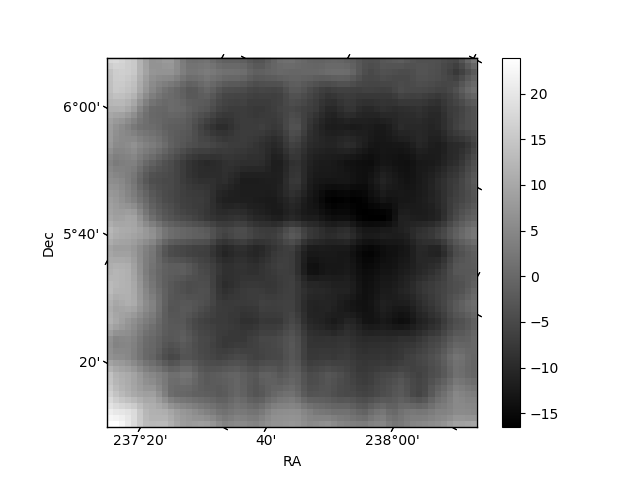
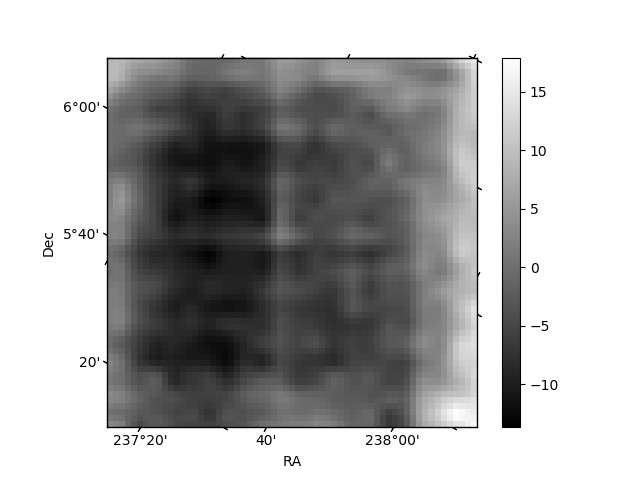
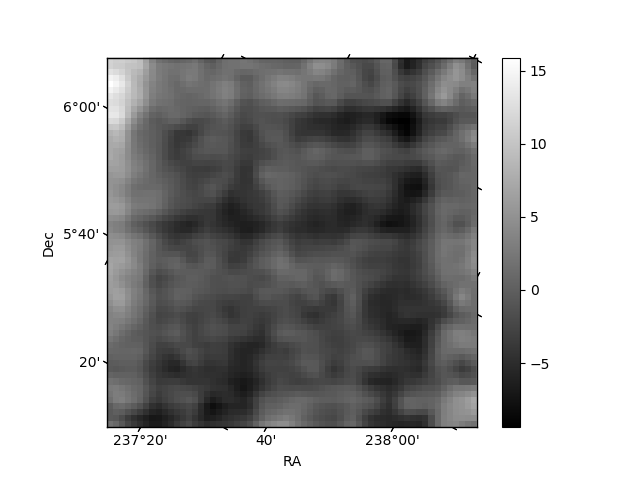
Histogram calculated using DETX and DETY for each event in the final _common_clean file
| Quadrant A | 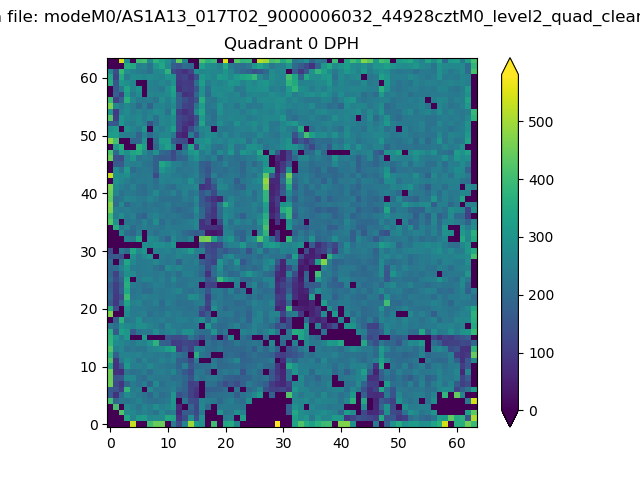 |
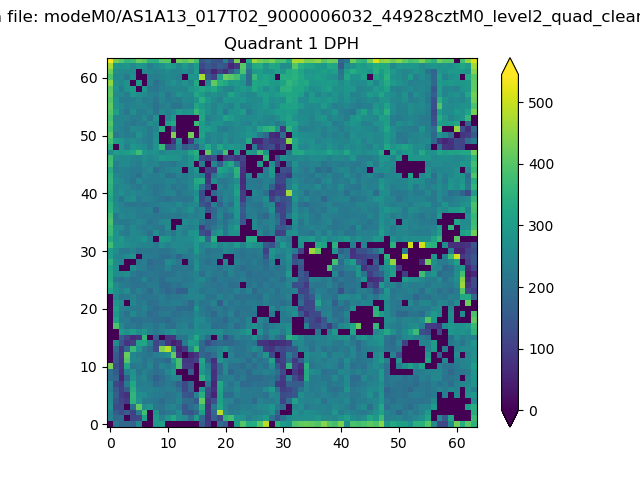 |
Quadrant B |
|---|---|---|---|
| Quadrant D | 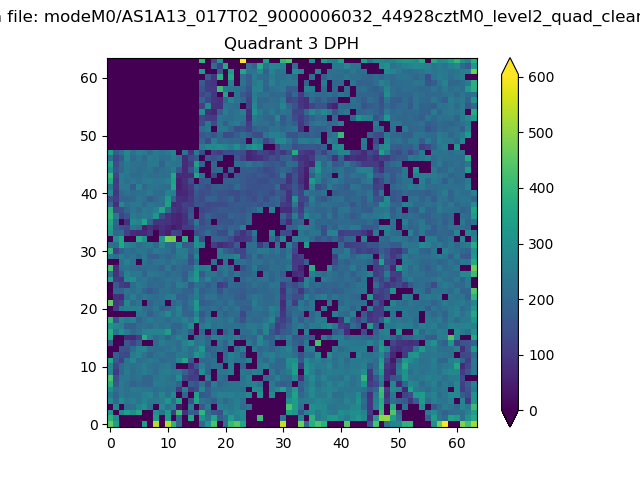 |
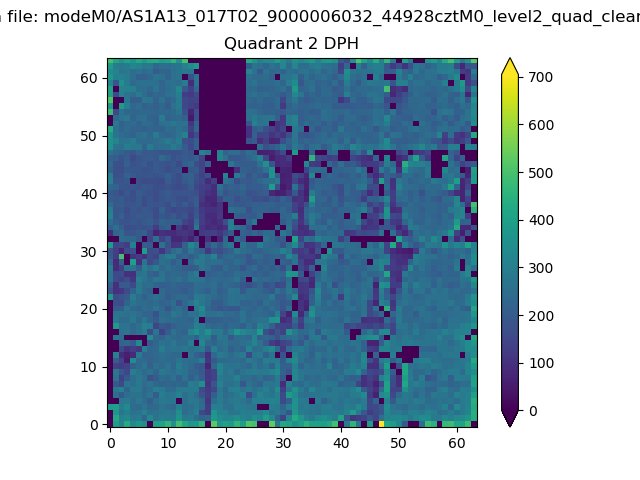 |
Quadrant C |
| Plot type | Count rate plots | Images |
|---|---|---|
| Comparison with Poisson distribution Blue bars denote a histogram of data divided into 1 sec bins. Red curve is a Poisson curve with rate = median count rate of data. |
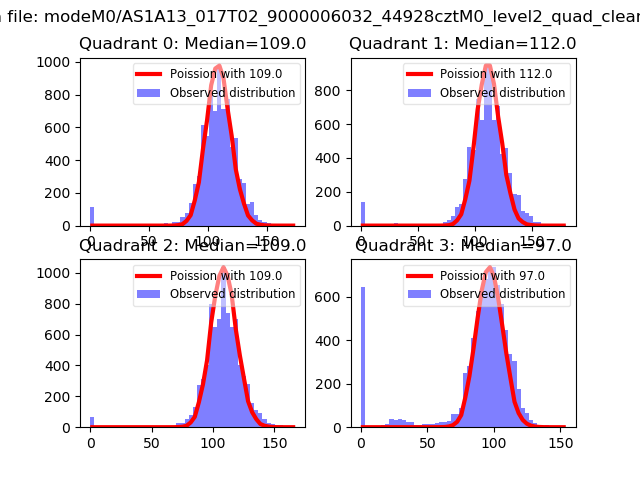 |
 |
| Quadrant-wise count rates Data is divided into 100 sec bins |
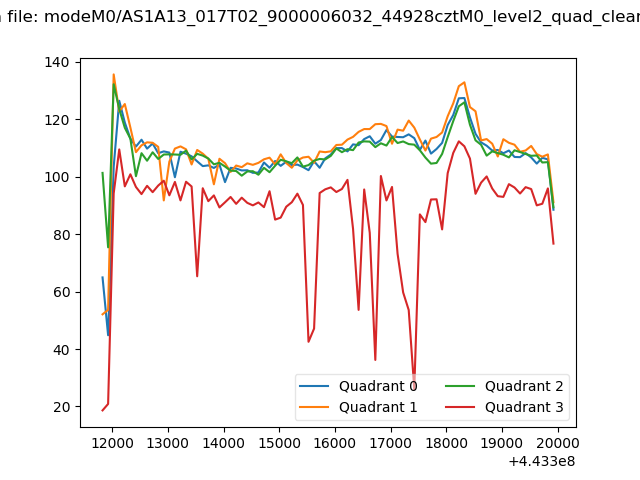 |
|
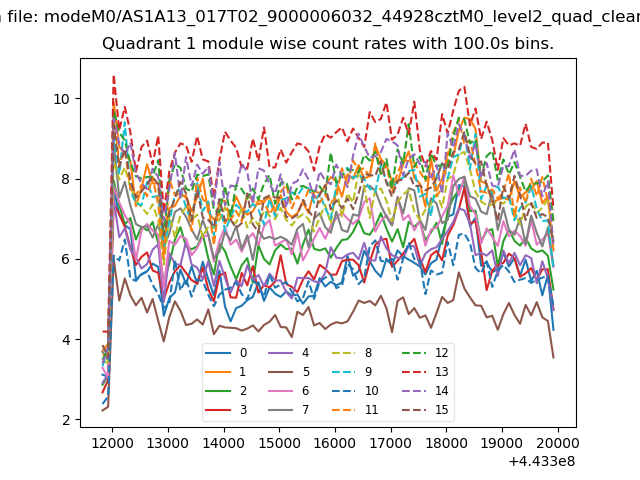
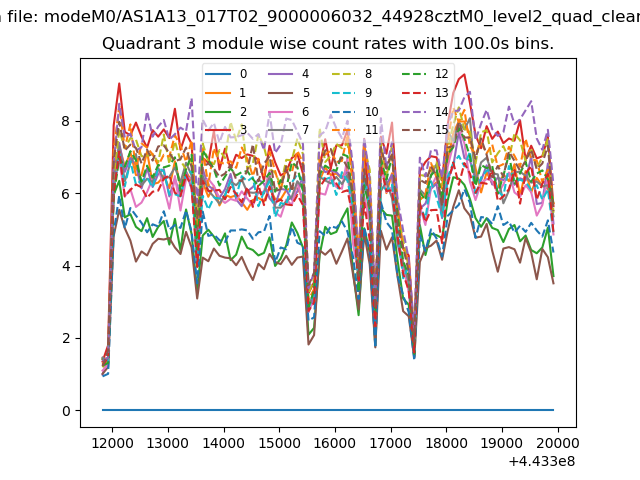
| Module-wise count rates for Quadrant A Data is divided into 100 sec bins |
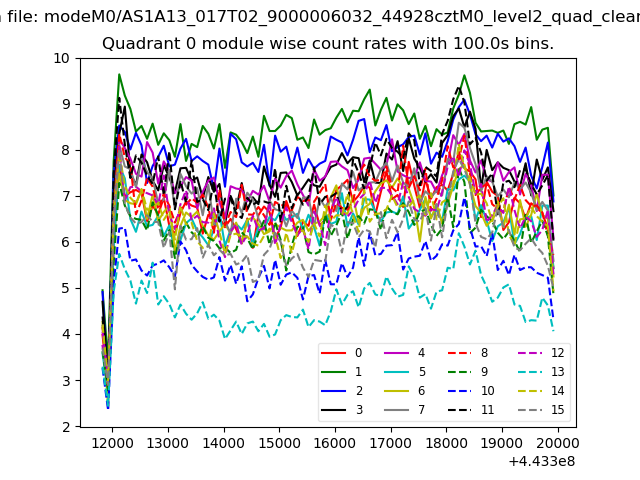 |
 |
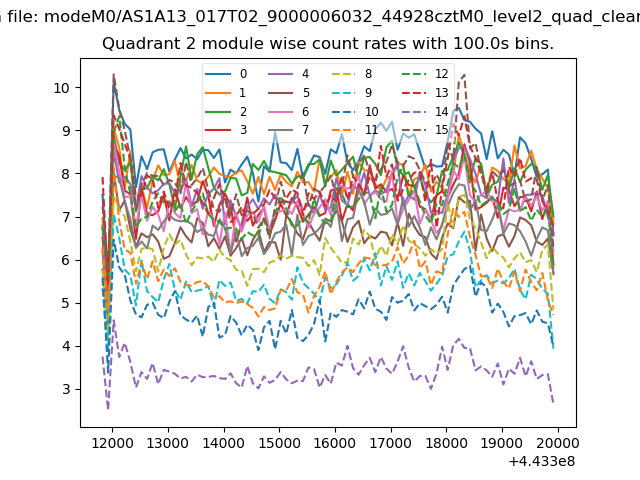
| Module-wise count rates for Quadrant B Data is divided into 100 sec bins |
 |
 |
| Module-wise count rates for Quadrant C Data is divided into 100 sec bins |
 |
 |
| Module-wise count rates for Quadrant D Data is divided into 100 sec bins |
 |
 |
| Parameter | Plot |
|---|---|
| CZT HV Monitor | 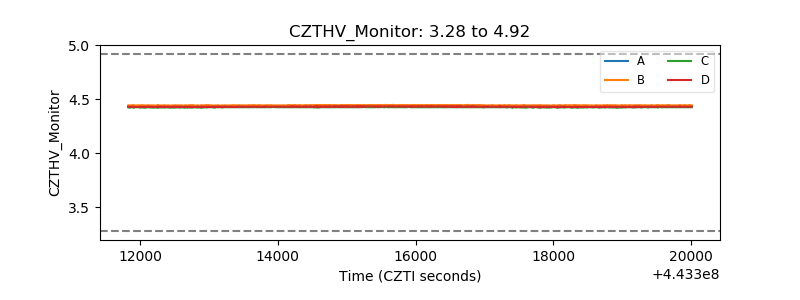 |
| D_VDD | 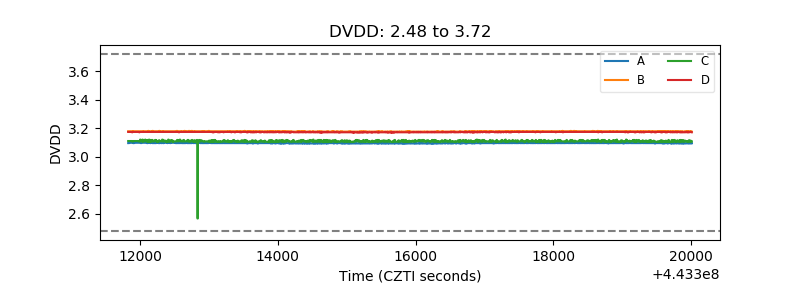 |
| Temperature 1 | 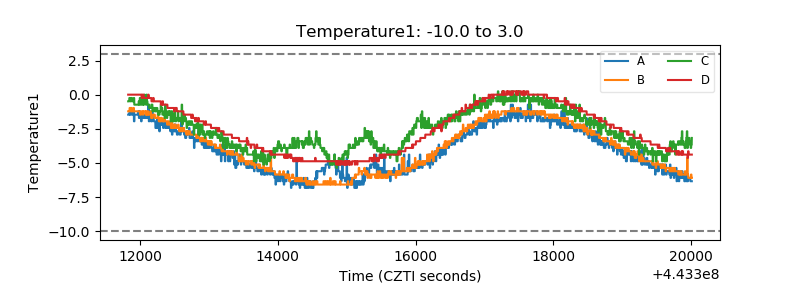 |
| Veto HV Monitor | 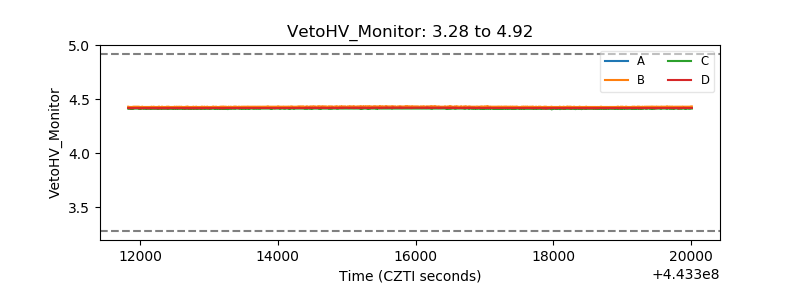 |
| Veto LLD | 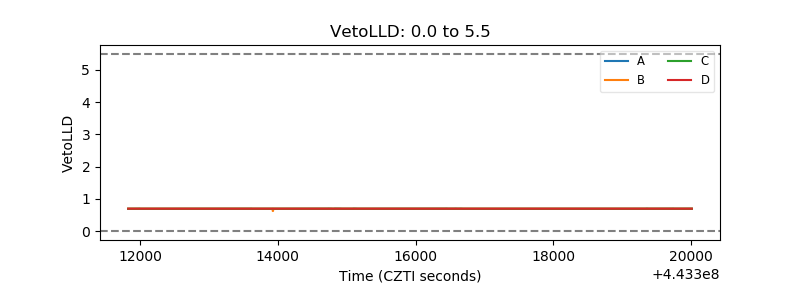 |
| Alpha Counter | 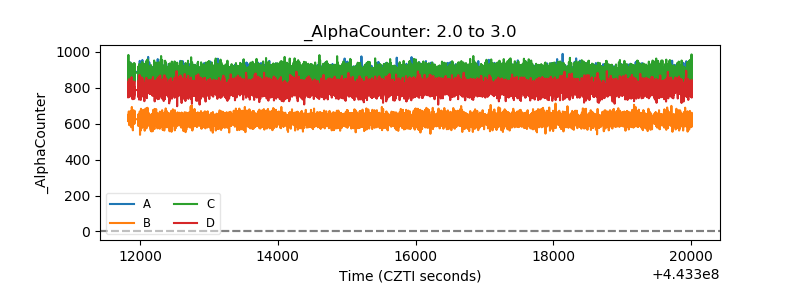 |
| _CPM_Rate | 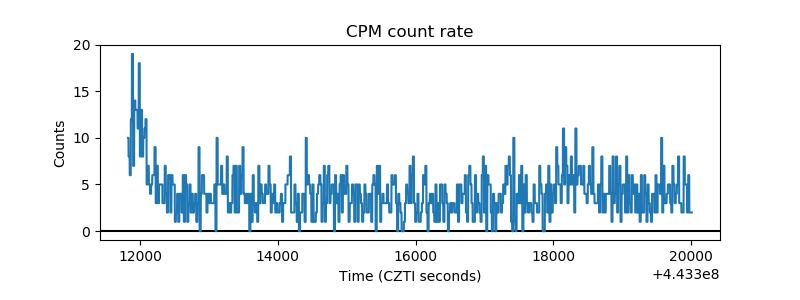 |
| CZT Counter | 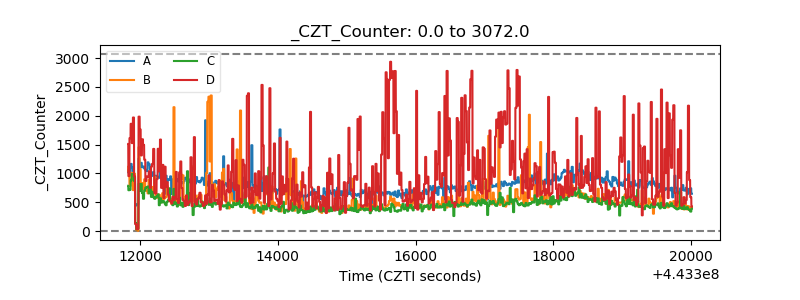 |
| +2.5 Volts monitor | 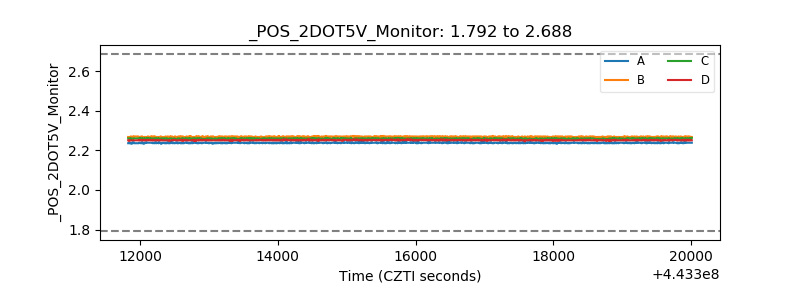 |
| +5 Volts monitor | 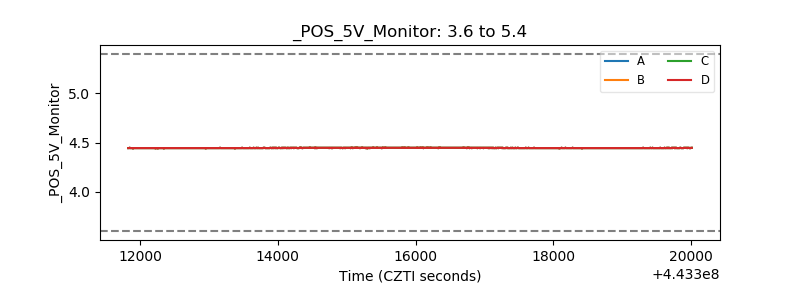 |
| _ROLL_ROT | 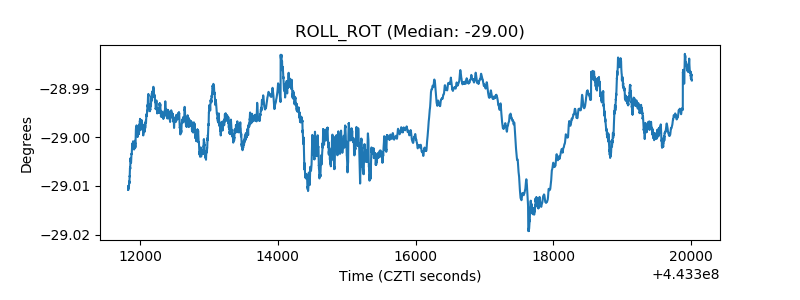 |
| _Roll_DEC | 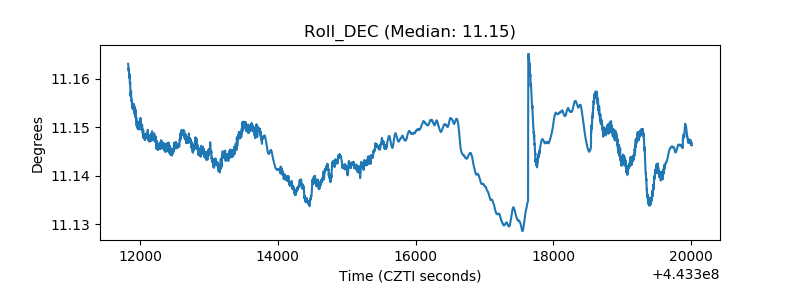 |
| _Roll_RA | 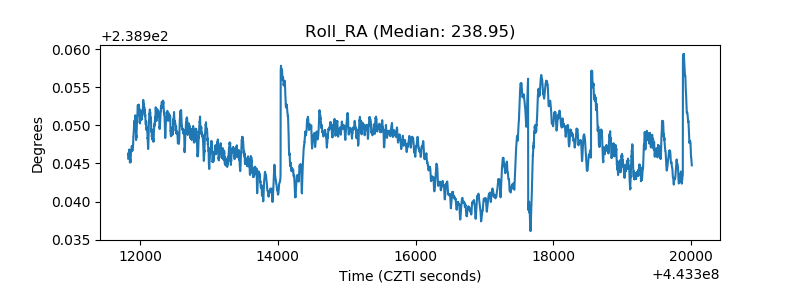 |
| Veto Counter | 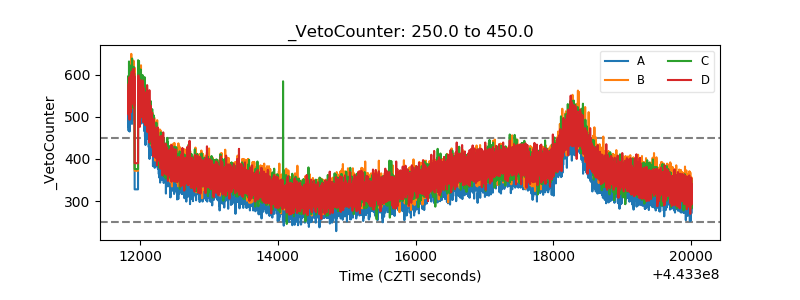 |