| Param | Original file | Final file |
|---|---|---|
| Filename | modeM0/AS1A13_017T02_9000006032_44932cztM0_level2.fits | modeM0/AS1A13_017T02_9000006032_44932cztM0_level2_quad_clean.evt |
| Size (bytes) | 1,969,217,280 | 394,338,240 |
| Size | 1.8 GB | 376.1 MB |
| Events in quadrant A | 19,420,197 | 2,683,871 |
| Events in quadrant B | 14,035,244 | 2,750,859 |
| Events in quadrant C | 11,458,721 | 2,702,482 |
| Events in quadrant D | 26,027,109 | 2,063,094 |
| Mode SS | |||
|---|---|---|---|
| Quadrant | BADHDUFLAG | Total packets | Discarded packets |
| A | 0 | 510 | 0 |
| B | 0 | 510 | 0 |
| C | 0 | 510 | 0 |
| D | 0 | 510 | 0 |
| Mode M0 | |||
|---|---|---|---|
| Quadrant | BADHDUFLAG | Total packets | Discarded packets |
| A | 0 | 77619 | 3 |
| B | 0 | 59324 | 3 |
| C | 0 | 52632 | 3 |
| D | 0 | 95060 | 9 |
| Mode M9 | |||
|---|---|---|---|
| Quadrant | BADHDUFLAG | Total packets | Discarded packets |
| A | 0 | 16 | 0 |
| B | 0 | 16 | 0 |
| C | 0 | 16 | 0 |
| D | 0 | 16 | 0 |
| Quadrant | Total seconds | Saturated seconds | Saturation percentage |
|---|---|---|---|
| A | 25283 | 452 | 1.787763% |
| B | 25284 | 701 | 2.772504% |
| C | 25284 | 143 | 0.565575% |
| D | 25283 | 4693 | 18.561880% |
Noise dominated data is calculated using 1-second bins in cleaned event files. If a bin has >2000 counts, and if more than 50% of those come from <1% of pixels, then it is considered to be noise-dominated and hence unusable.
| Quadrant | # 1 sec bins | Bins with >0 counts | Bins with >2000 counts | High rate bins dominated by noise | Noise dominated (total time) | Noise dominated (detector-on time) | Marked lightcurve |
|---|---|---|---|---|---|---|---|
| A | 26753 | 25287 | 30 | 30 | 0.11% | 0.12% | 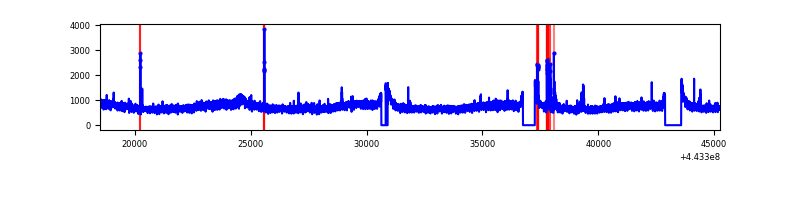 |
| B | 26754 | 25288 | 210 | 210 | 0.78% | 0.83% | 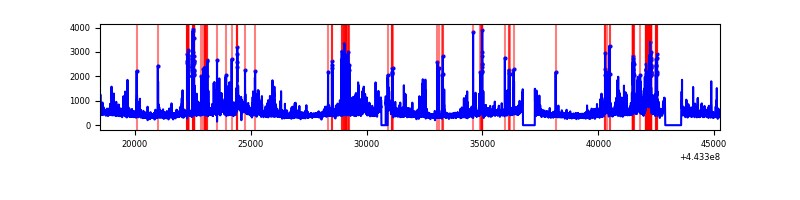 |
| C | 26754 | 25288 | 34 | 34 | 0.13% | 0.13% | 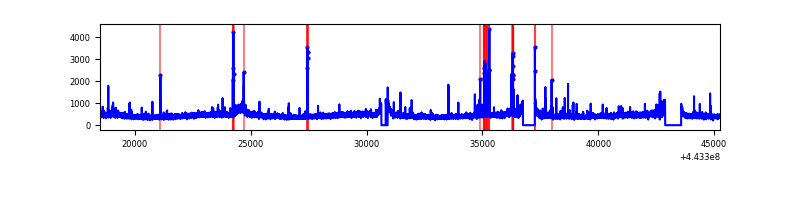 |
| D | 26754 | 25286 | 3209 | 3209 | 11.99% | 12.69% | 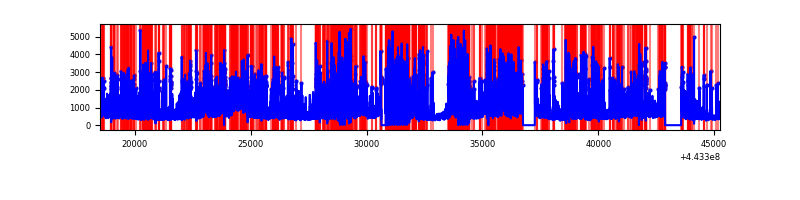 |
Top three noisy pixels from each quadrant. If the there are fewer than three noisy pixels in the level2.evt file, extra rows are filled as -1
| Pixel properties | Quadrant properties | ||||||
|---|---|---|---|---|---|---|---|
| Quadrant | DetID | PixID | Counts | Sigma | Mean | Median | Sigma |
| A | 10 | 83 | 8057067 | 13459.56 | 2866 | 2799 | 598.4 |
| A | 10 | 248 | 134544 | 220.16 | 2866 | 2799 | 598.4 |
| A | 7 | 3 | 69603 | 111.64 | 2866 | 2799 | 598.4 |
| B | 4 | 171 | 1011749 | 1807.64 | 2851 | 2765 | 558.2 |
| B | 0 | 183 | 368835 | 655.83 | 2851 | 2765 | 558.2 |
| B | 5 | 255 | 365681 | 650.18 | 2851 | 2765 | 558.2 |
| C | 1 | 3 | 208899 | 308.78 | 2828 | 2843 | 667.3 |
| C | 14 | 254 | 103792 | 151.28 | 2828 | 2843 | 667.3 |
| C | 0 | 207 | 45803 | 64.38 | 2828 | 2843 | 667.3 |
| D | 13 | 187 | 5414013 | 8589.27 | 2497 | 2422 | 630.0 |
| D | 1 | 52 | 2846771 | 4514.55 | 2497 | 2422 | 630.0 |
| D | 2 | 249 | 2831908 | 4490.96 | 2497 | 2422 | 630.0 |
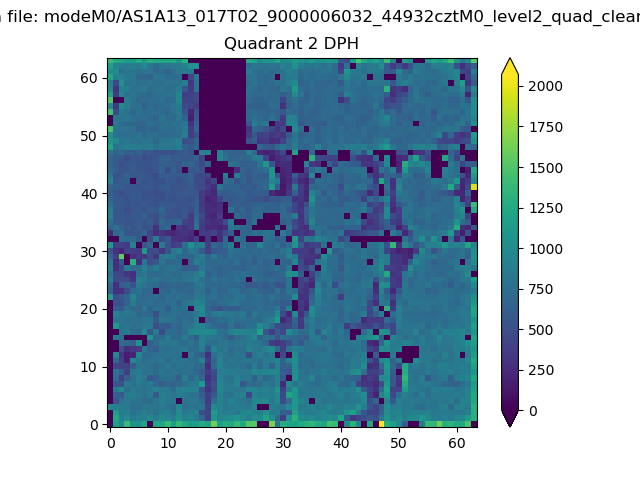
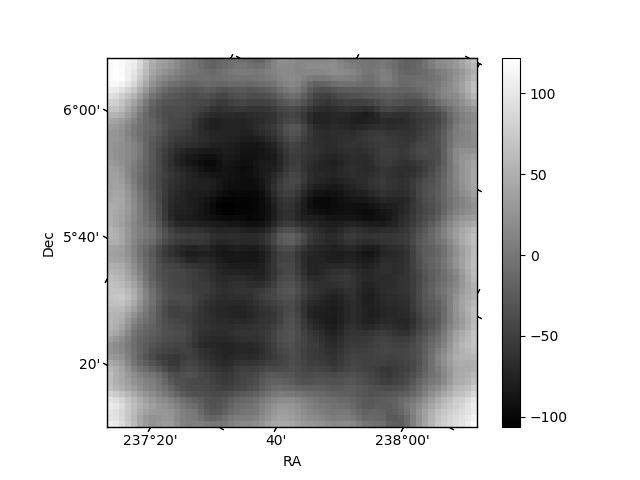
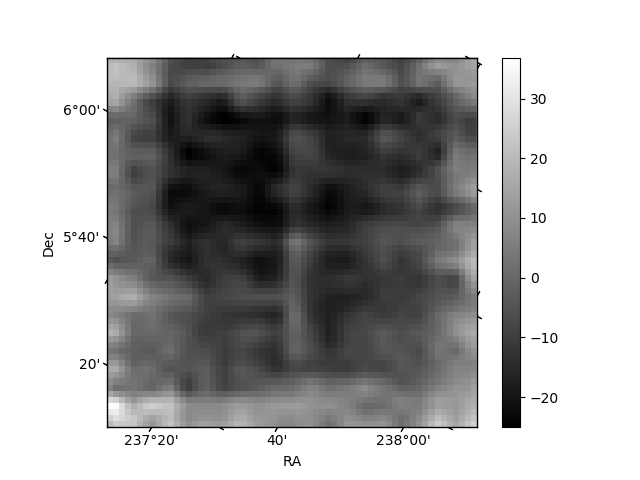
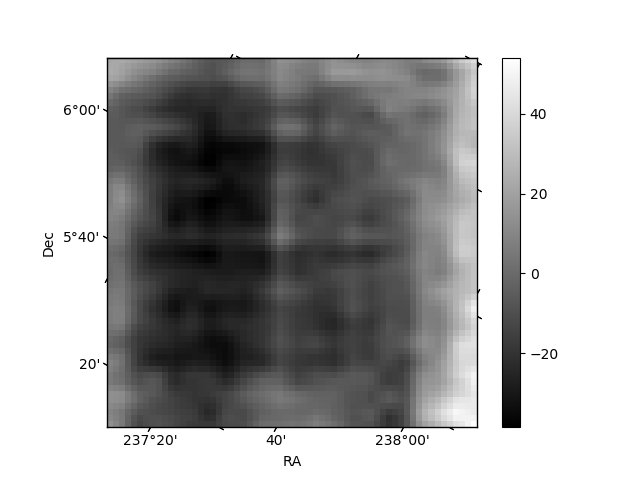
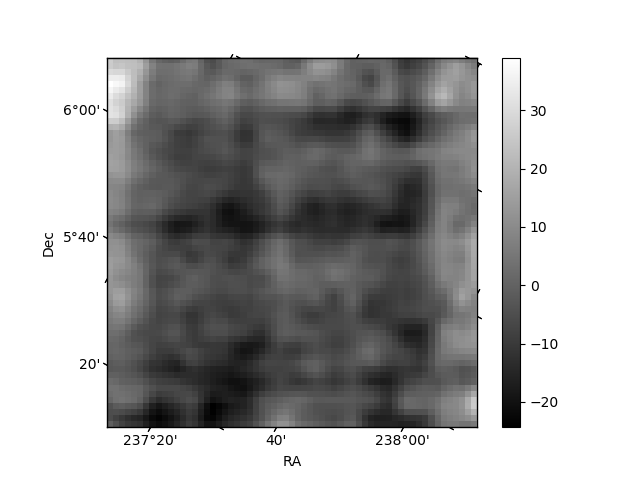
Histogram calculated using DETX and DETY for each event in the final _common_clean file
| Quadrant A | 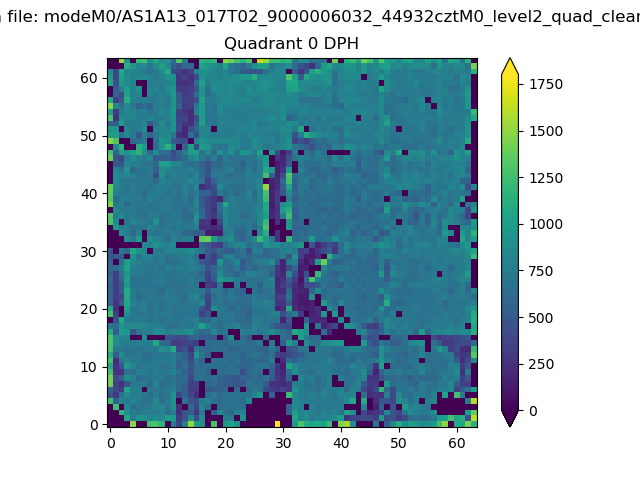 |
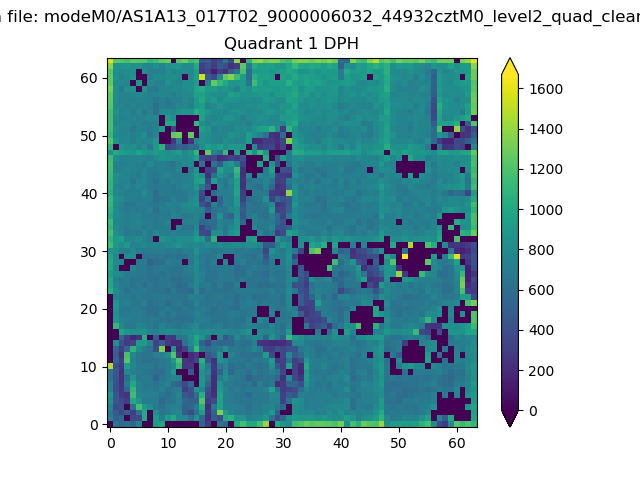 |
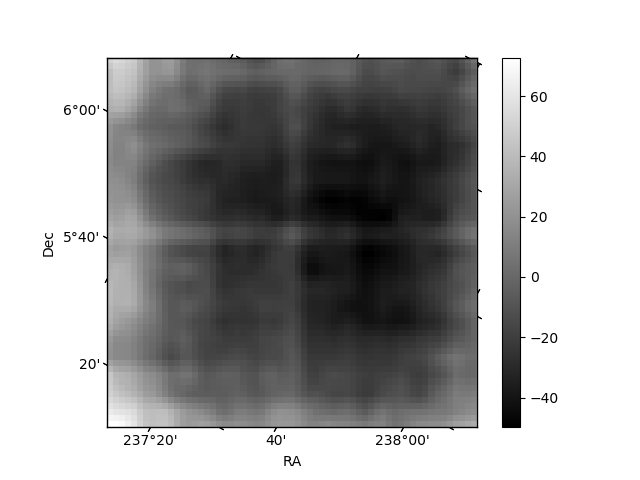
Quadrant B |
|---|---|---|---|
| Quadrant D | 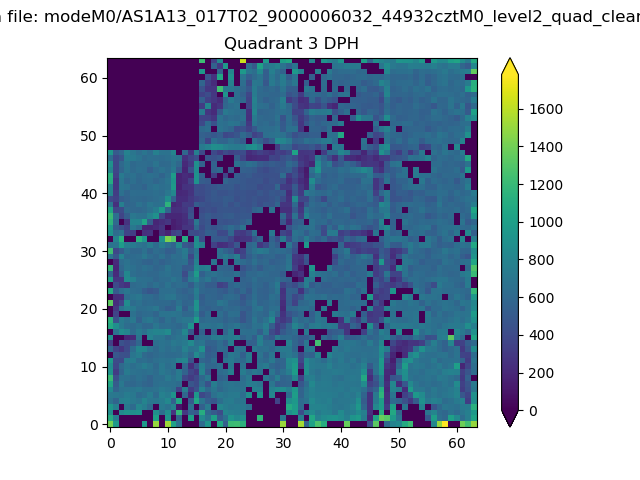 |
 |
Quadrant C |
| Plot type | Count rate plots | Images |
|---|---|---|
| Comparison with Poisson distribution Blue bars denote a histogram of data divided into 1 sec bins. Red curve is a Poisson curve with rate = median count rate of data. |
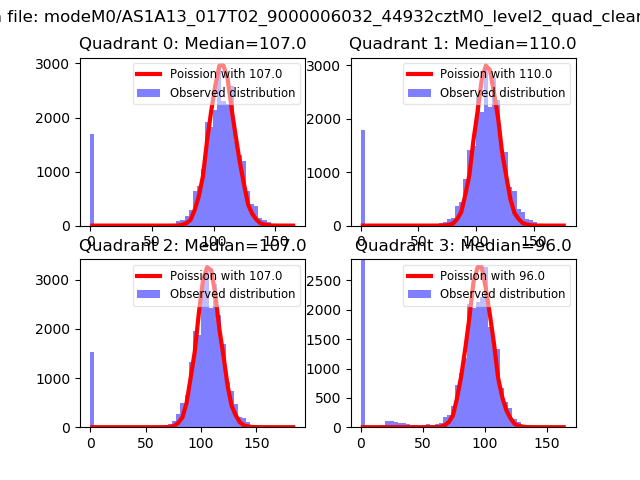 |
 |
| Quadrant-wise count rates Data is divided into 100 sec bins |
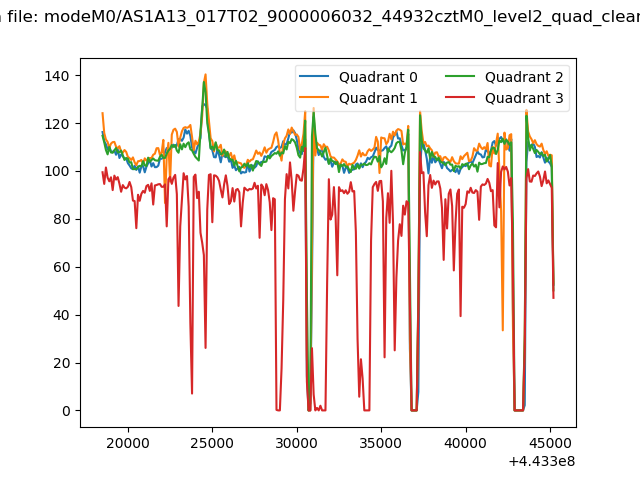 |
|
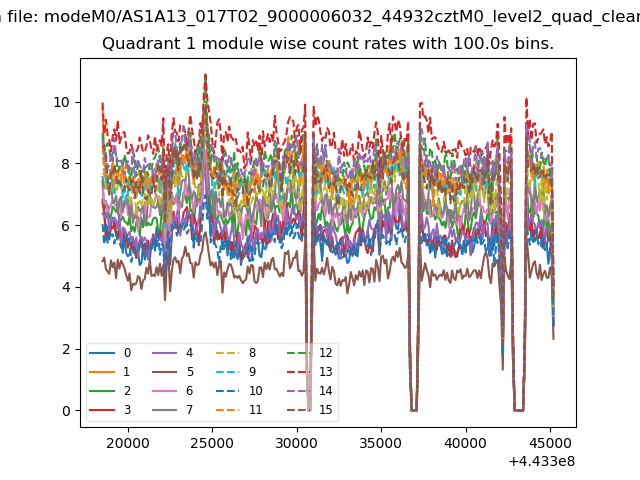
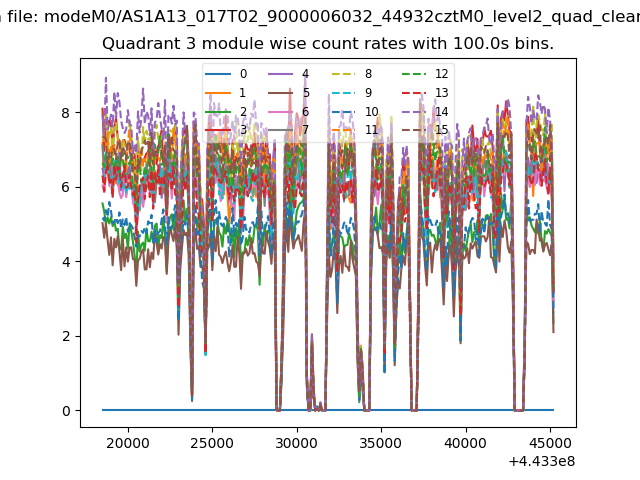
| Module-wise count rates for Quadrant A Data is divided into 100 sec bins |
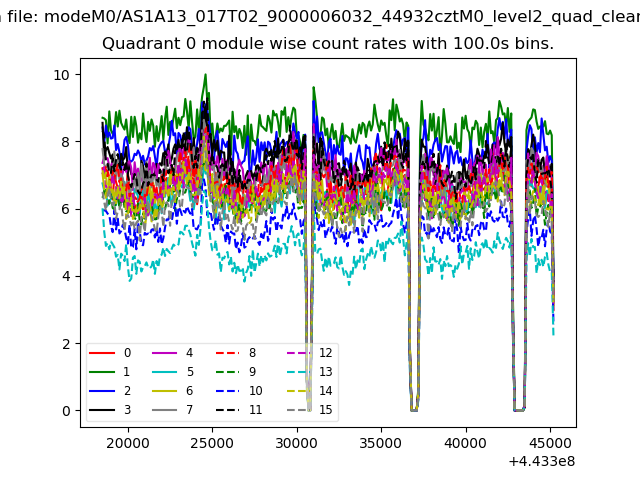 |
 |
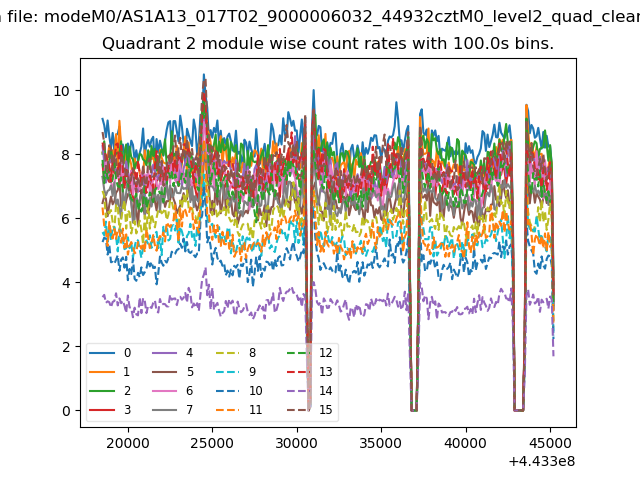
| Module-wise count rates for Quadrant B Data is divided into 100 sec bins |
 |
 |
| Module-wise count rates for Quadrant C Data is divided into 100 sec bins |
 |
 |
| Module-wise count rates for Quadrant D Data is divided into 100 sec bins |
 |
 |
| Parameter | Plot |
|---|---|
| CZT HV Monitor | 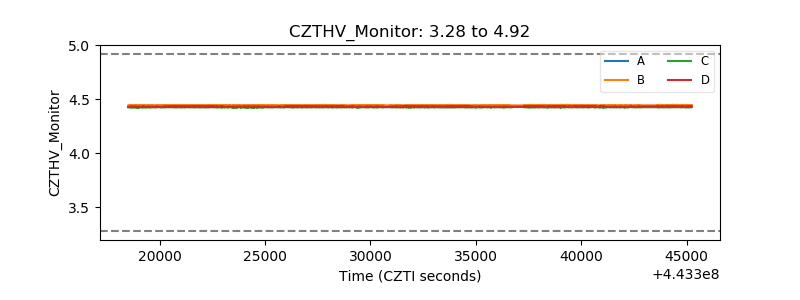 |
| D_VDD | 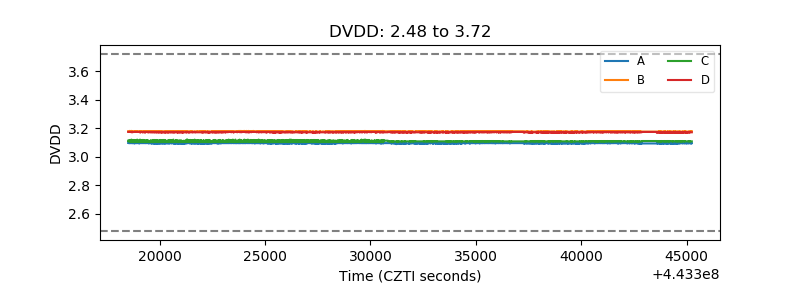 |
| Temperature 1 | 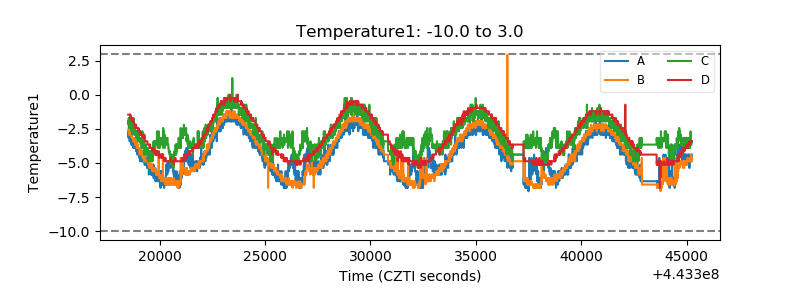 |
| Veto HV Monitor | 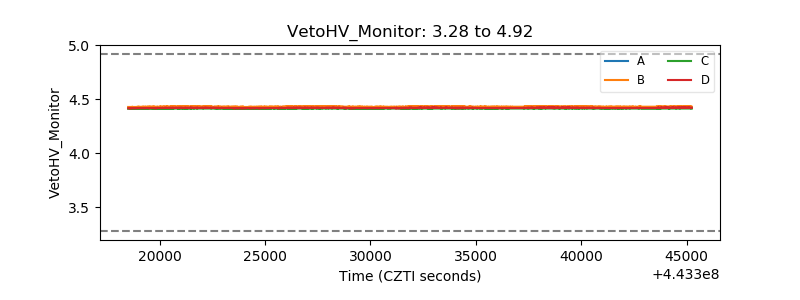 |
| Veto LLD | 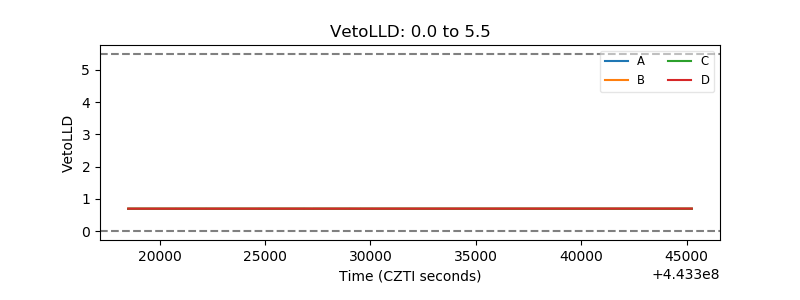 |
| Alpha Counter | 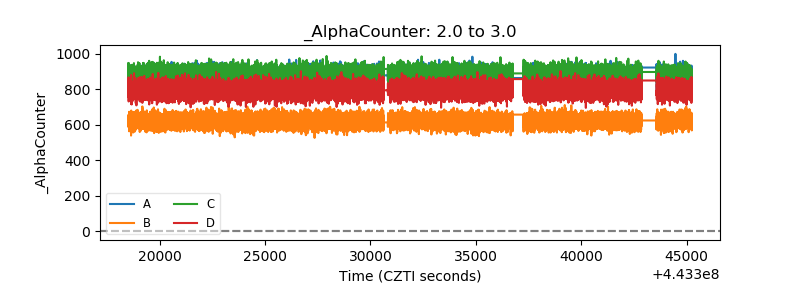 |
| _CPM_Rate | 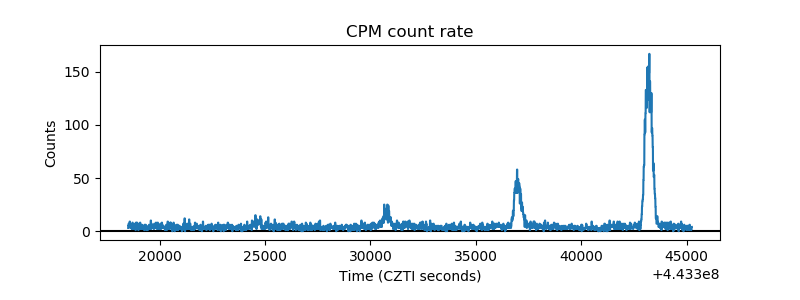 |
| CZT Counter | 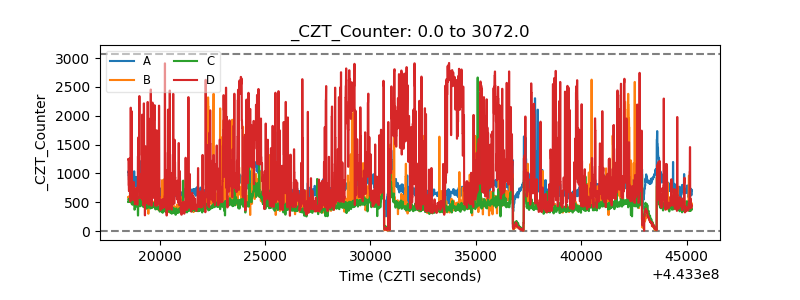 |
| +2.5 Volts monitor | 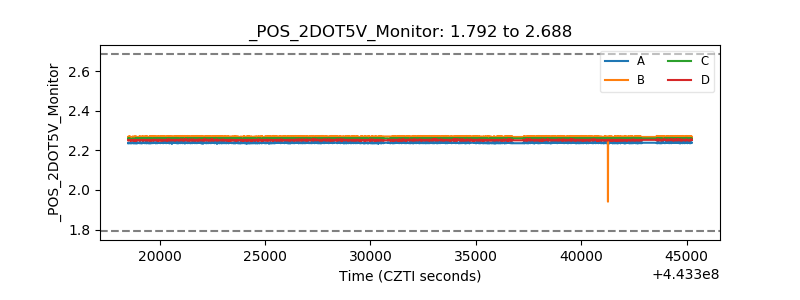 |
| +5 Volts monitor | 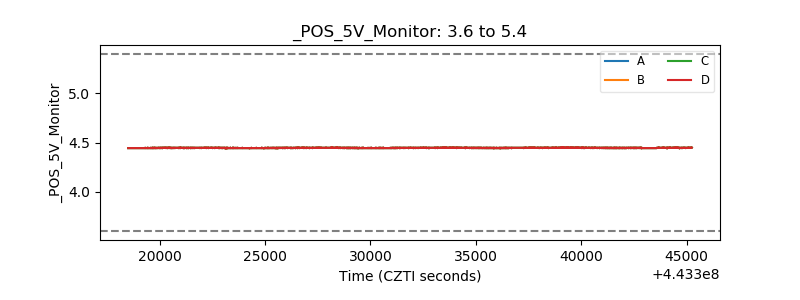 |
| _ROLL_ROT | 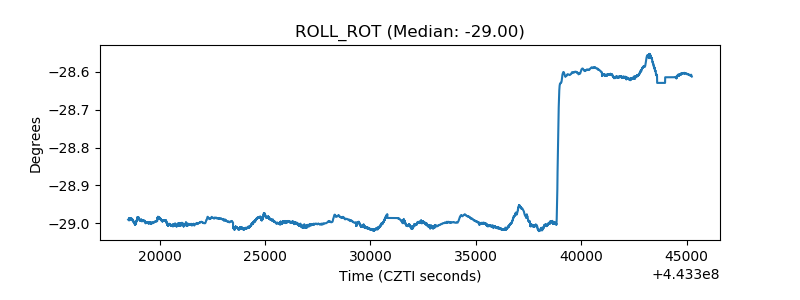 |
| _Roll_DEC | 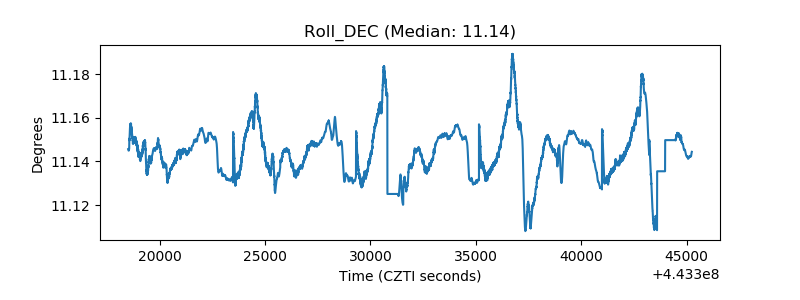 |
| _Roll_RA | 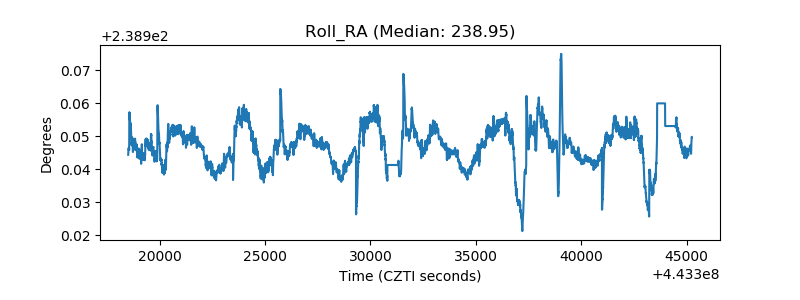 |
| Veto Counter | 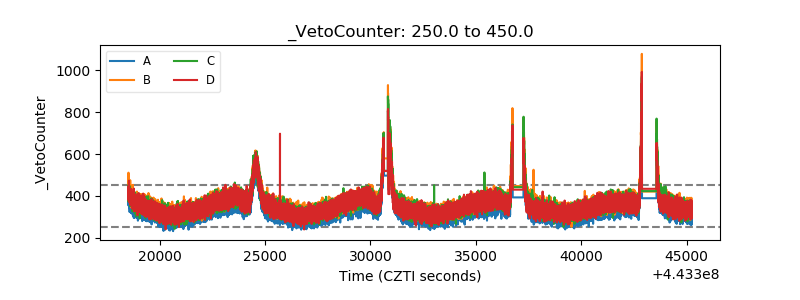 |