| Param | Original file | Final file |
|---|---|---|
| Filename | modeM0/AS1A13_017T02_9000006032_44933cztM0_level2.fits | modeM0/AS1A13_017T02_9000006032_44933cztM0_level2_quad_clean.evt |
| Size (bytes) | 514,584,000 | 91,632,960 |
| Size | 490.7 MB | 87.4 MB |
| Events in quadrant A | 4,641,258 | 637,233 |
| Events in quadrant B | 3,693,183 | 640,143 |
| Events in quadrant C | 2,704,164 | 638,538 |
| Events in quadrant D | 7,547,392 | 442,493 |
| Mode SS | |||
|---|---|---|---|
| Quadrant | BADHDUFLAG | Total packets | Discarded packets |
| A | 0 | 120 | 0 |
| B | 0 | 120 | 0 |
| C | 0 | 120 | 0 |
| D | 0 | 120 | 0 |
| Mode M0 | |||
|---|---|---|---|
| Quadrant | BADHDUFLAG | Total packets | Discarded packets |
| A | 0 | 18356 | 1 |
| B | 0 | 14869 | 1 |
| C | 0 | 12364 | 1 |
| D | 0 | 26496 | 1 |
| Mode M9 | |||
|---|---|---|---|
| Quadrant | BADHDUFLAG | Total packets | Discarded packets |
| A | 0 | 9 | 0 |
| B | 0 | 9 | 0 |
| C | 0 | 9 | 0 |
| D | 0 | 9 | 0 |
| Quadrant | Total seconds | Saturated seconds | Saturation percentage |
|---|---|---|---|
| A | 5956 | 102 | 1.712559% |
| B | 5957 | 261 | 4.381400% |
| C | 5957 | 47 | 0.788988% |
| D | 5957 | 1507 | 25.297969% |
Noise dominated data is calculated using 1-second bins in cleaned event files. If a bin has >2000 counts, and if more than 50% of those come from <1% of pixels, then it is considered to be noise-dominated and hence unusable.
| Quadrant | # 1 sec bins | Bins with >0 counts | Bins with >2000 counts | High rate bins dominated by noise | Noise dominated (total time) | Noise dominated (detector-on time) | Marked lightcurve |
|---|---|---|---|---|---|---|---|
| A | 6856 | 5957 | 2 | 2 | 0.03% | 0.03% | 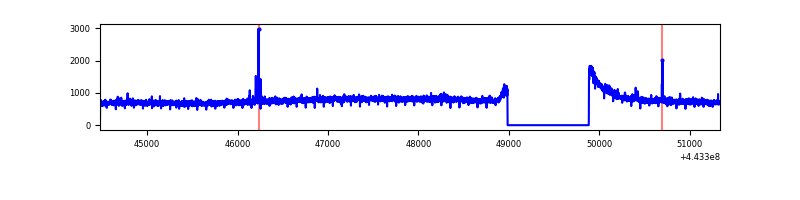 |
| B | 6857 | 5958 | 147 | 147 | 2.14% | 2.47% | 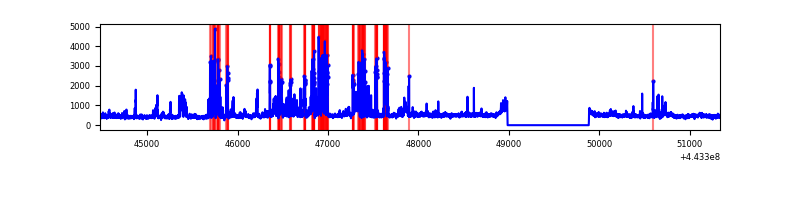 |
| C | 6857 | 5958 | 17 | 17 | 0.25% | 0.29% | 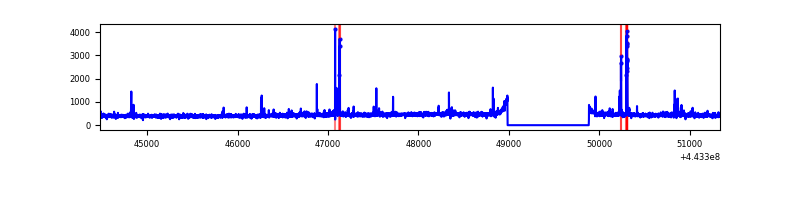 |
| D | 6857 | 5958 | 1351 | 1351 | 19.70% | 22.68% | 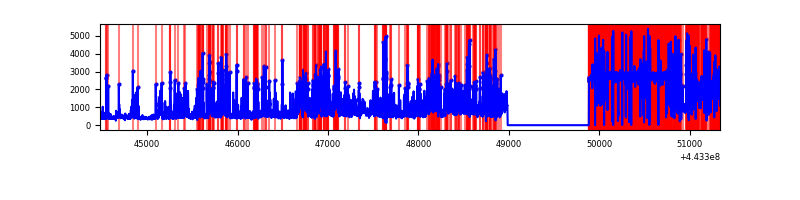 |
Top three noisy pixels from each quadrant. If the there are fewer than three noisy pixels in the level2.evt file, extra rows are filled as -1
| Pixel properties | Quadrant properties | ||||||
|---|---|---|---|---|---|---|---|
| Quadrant | DetID | PixID | Counts | Sigma | Mean | Median | Sigma |
| A | 10 | 83 | 2016124 | 14404.46 | 667 | 653 | 139.9 |
| A | 7 | 3 | 24202 | 168.3 | 667 | 653 | 139.9 |
| A | 0 | 247 | 14932 | 102.05 | 667 | 653 | 139.9 |
| B | 4 | 171 | 666597 | 5070.67 | 654 | 635 | 131.3 |
| B | 5 | 172 | 121045 | 916.81 | 654 | 635 | 131.3 |
| B | 0 | 183 | 107065 | 810.36 | 654 | 635 | 131.3 |
| C | 1 | 3 | 83478 | 531.87 | 656 | 660 | 155.7 |
| C | 14 | 254 | 58079 | 368.76 | 656 | 660 | 155.7 |
| C | 3 | 233 | 6865 | 39.85 | 656 | 660 | 155.7 |
| D | 13 | 187 | 2960441 | 20994.87 | 549 | 530 | 141.0 |
| D | 13 | 249 | 640782 | 4541.36 | 549 | 530 | 141.0 |
| D | 1 | 52 | 607334 | 4304.11 | 549 | 530 | 141.0 |
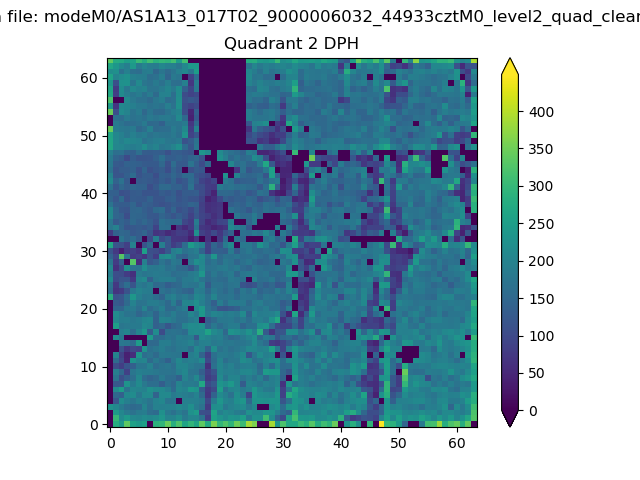
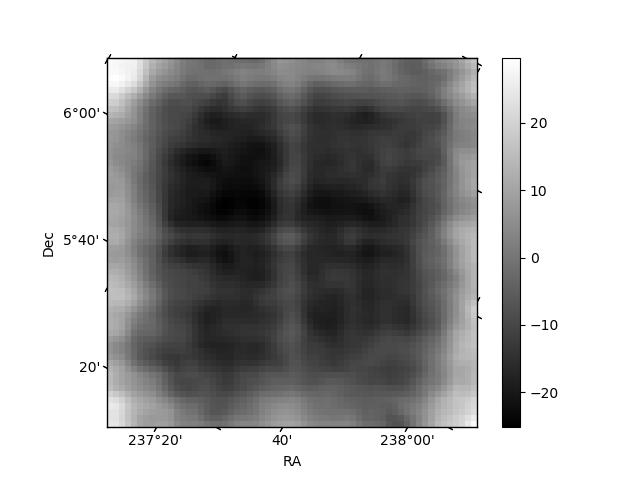
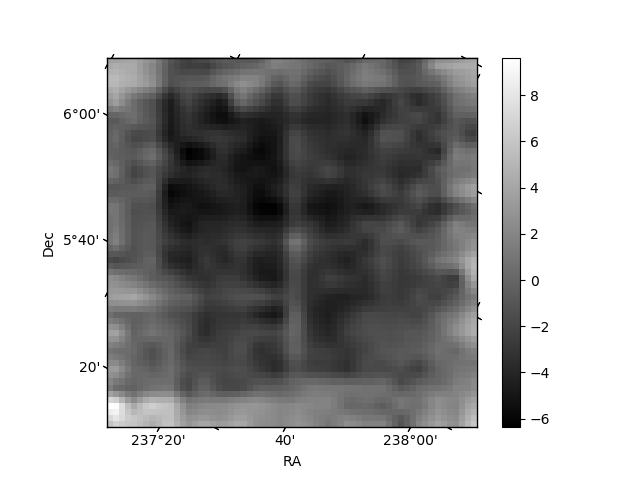
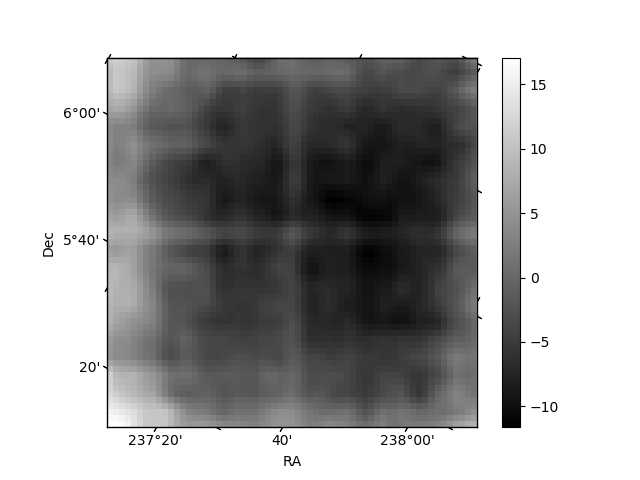
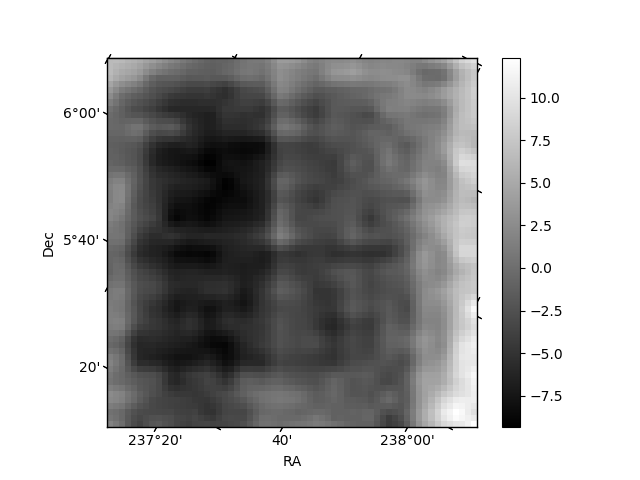
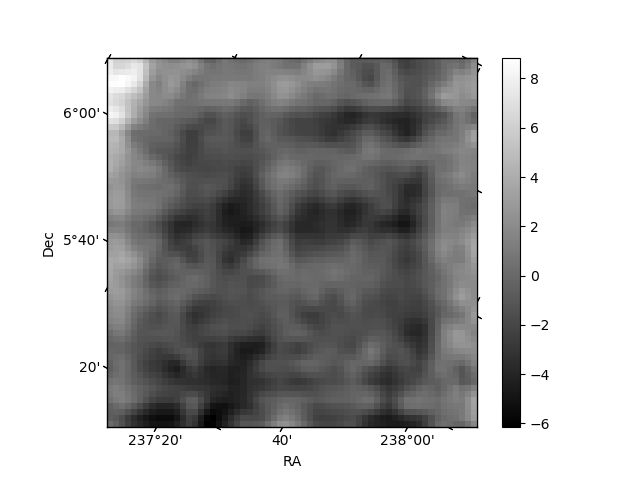
Histogram calculated using DETX and DETY for each event in the final _common_clean file
| Quadrant A | 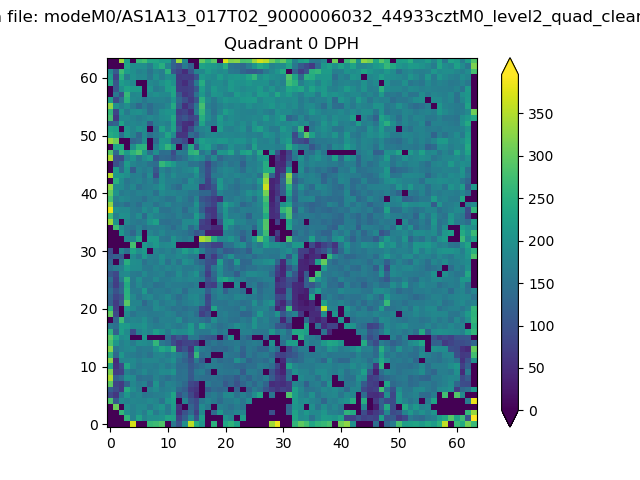 |
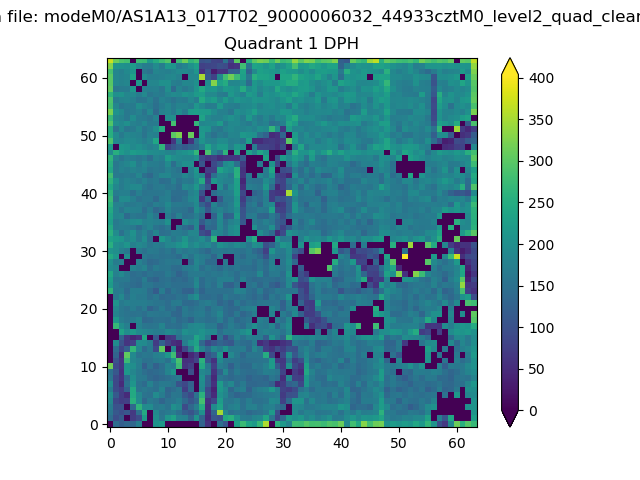 |
Quadrant B |
|---|---|---|---|
| Quadrant D | 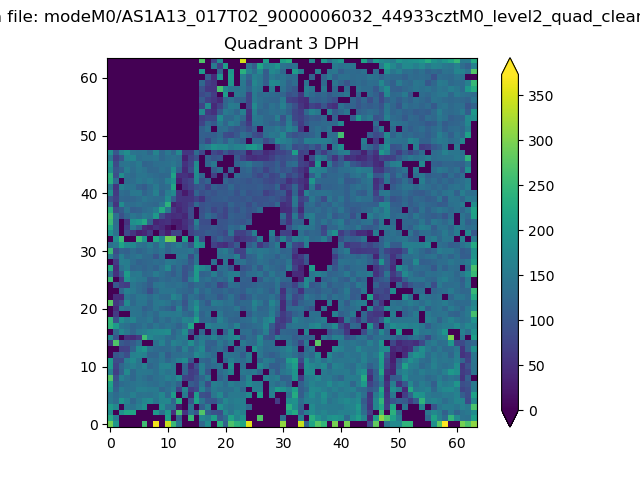 |
 |
Quadrant C |
| Plot type | Count rate plots | Images |
|---|---|---|
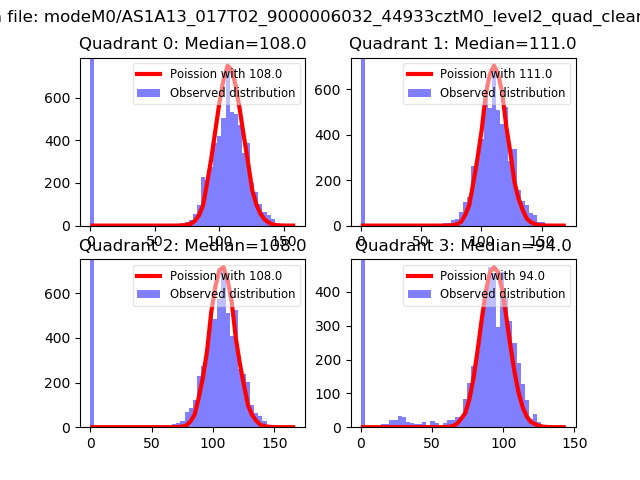
| Comparison with Poisson distribution Blue bars denote a histogram of data divided into 1 sec bins. Red curve is a Poisson curve with rate = median count rate of data. |
 |
 |
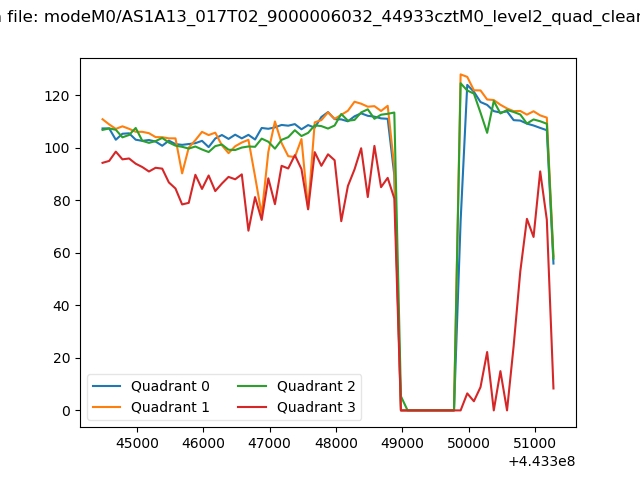
| Quadrant-wise count rates Data is divided into 100 sec bins |
 |
|
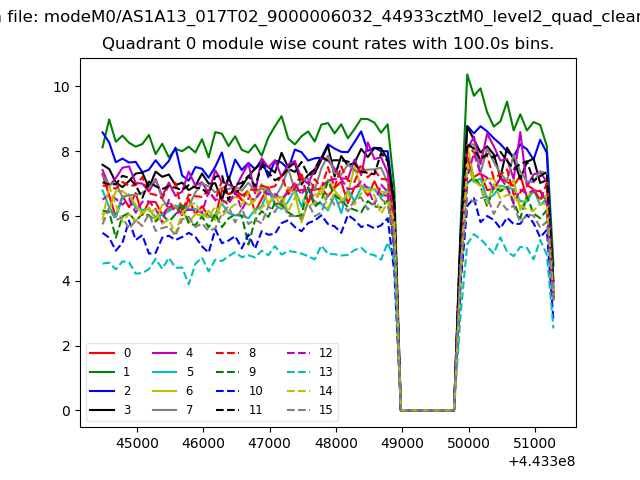
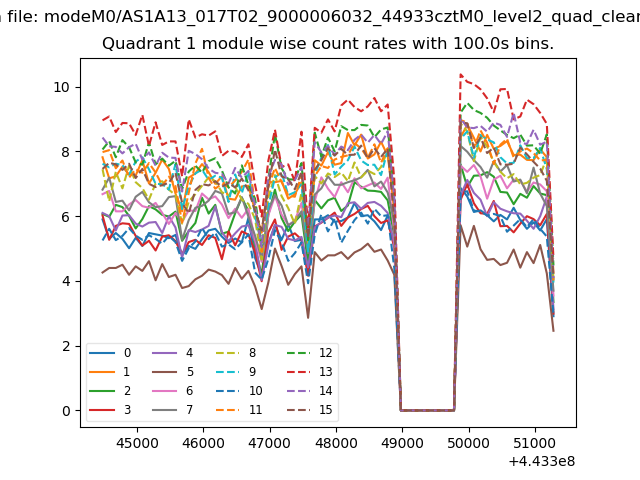
| Module-wise count rates for Quadrant A Data is divided into 100 sec bins |
 |
 |
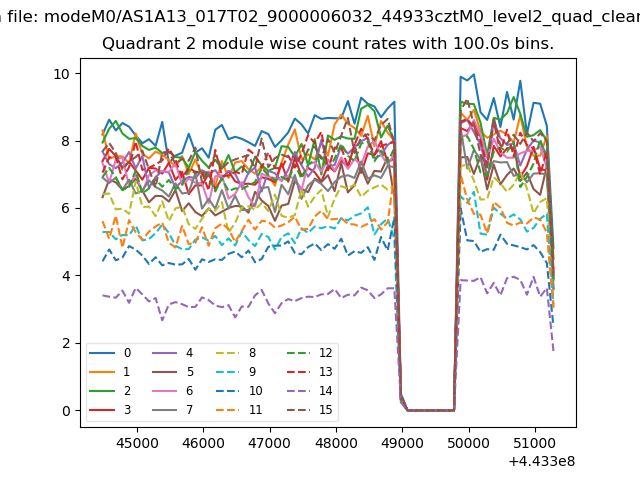
| Module-wise count rates for Quadrant B Data is divided into 100 sec bins |
 |
 |
| Module-wise count rates for Quadrant C Data is divided into 100 sec bins |
 |
 |
| Module-wise count rates for Quadrant D Data is divided into 100 sec bins |
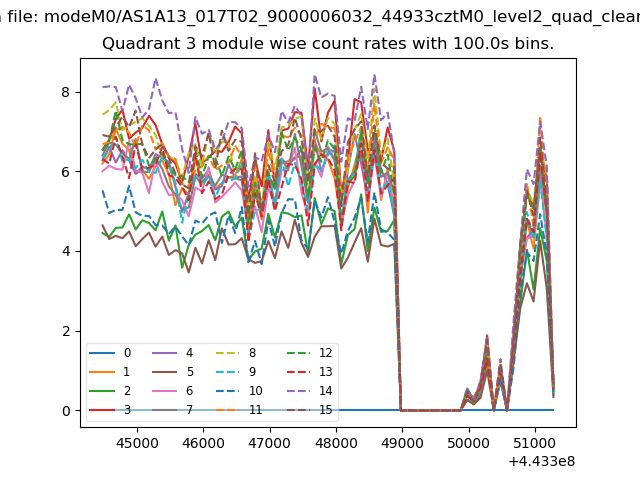 |
 |
| Parameter | Plot |
|---|---|
| CZT HV Monitor | 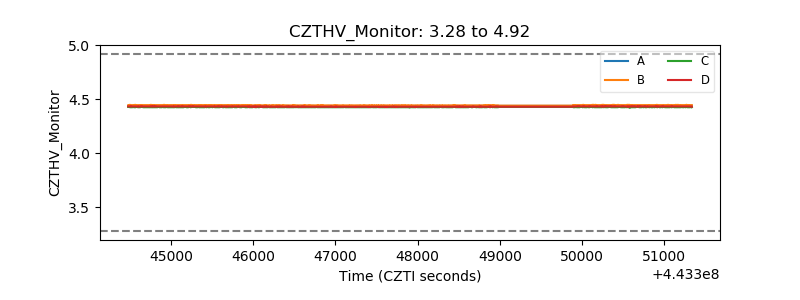 |
| D_VDD | 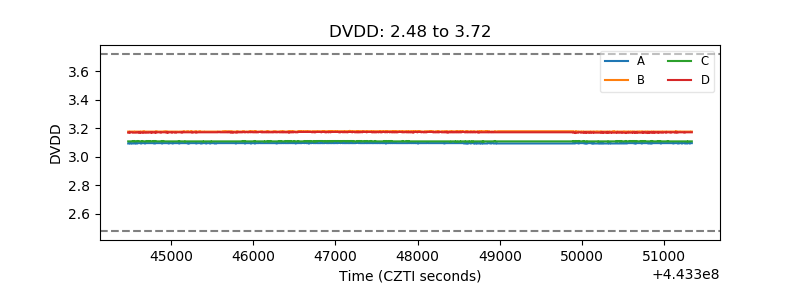 |
| Temperature 1 | 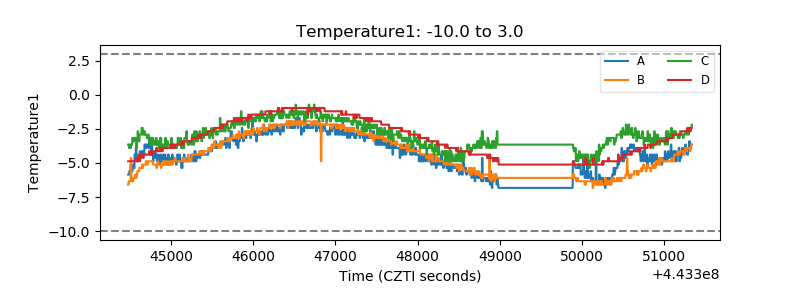 |
| Veto HV Monitor | 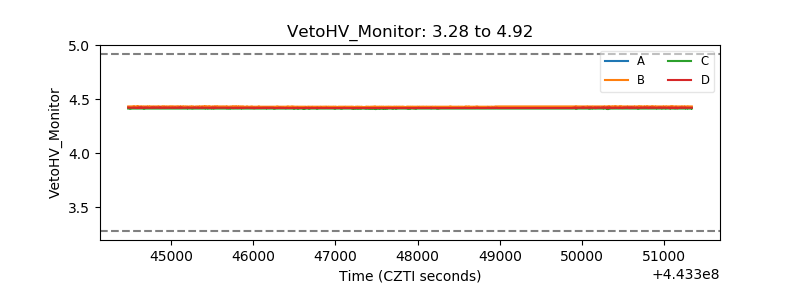 |
| Veto LLD | 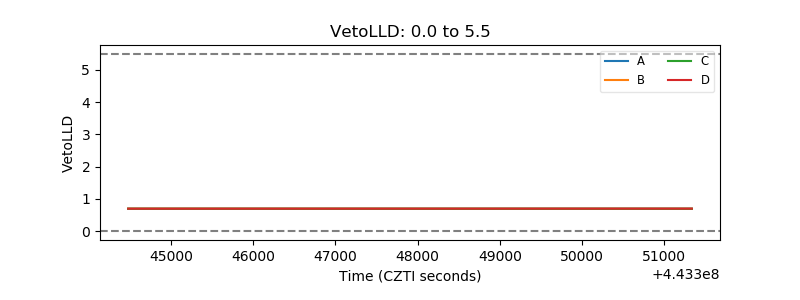 |
| Alpha Counter | 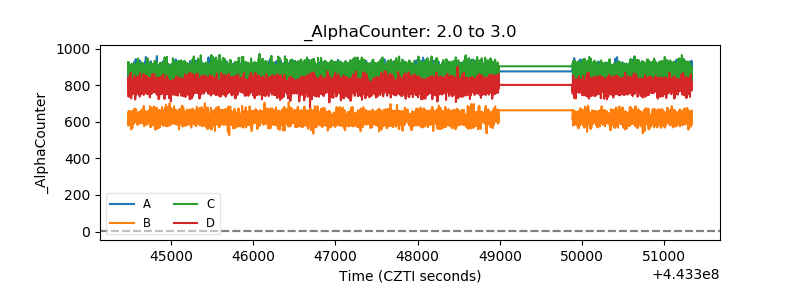 |
| _CPM_Rate | 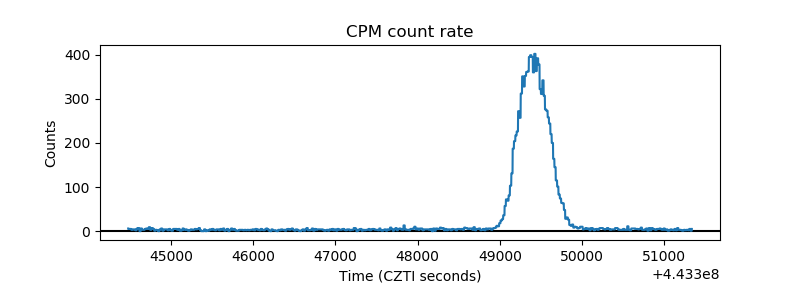 |
| CZT Counter | 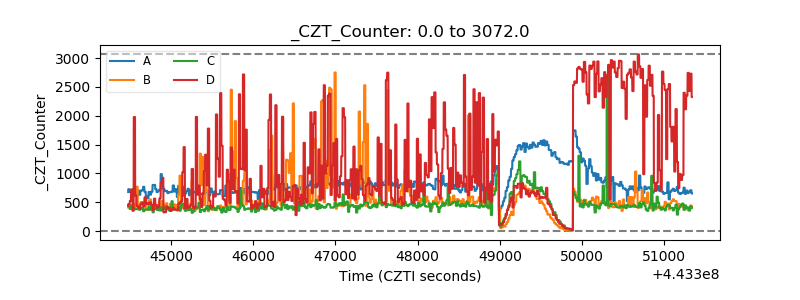 |
| +2.5 Volts monitor |  |
| +5 Volts monitor | 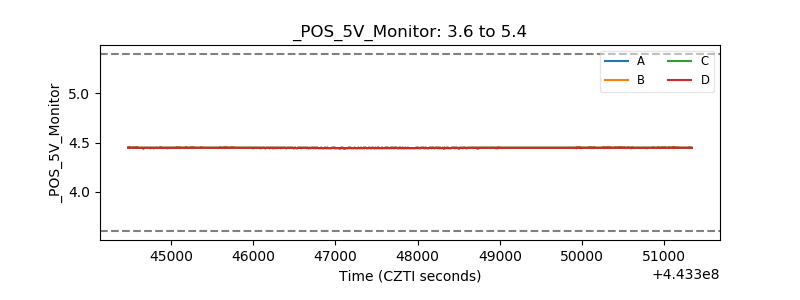 |
| _ROLL_ROT | 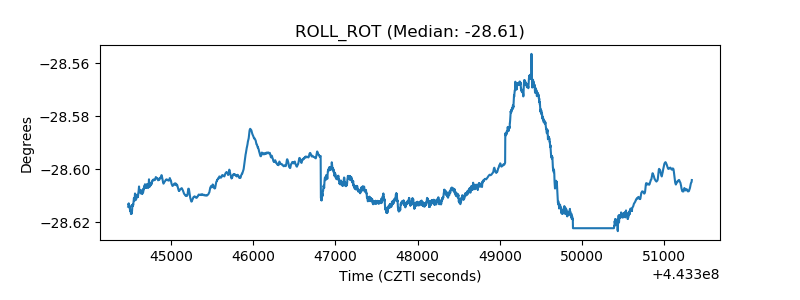 |
| _Roll_DEC | 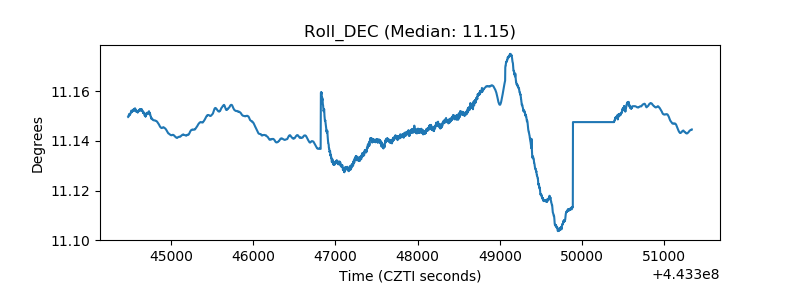 |
| _Roll_RA | 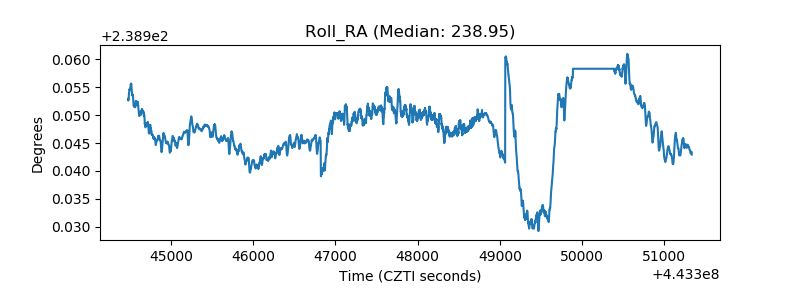 |
| Veto Counter | 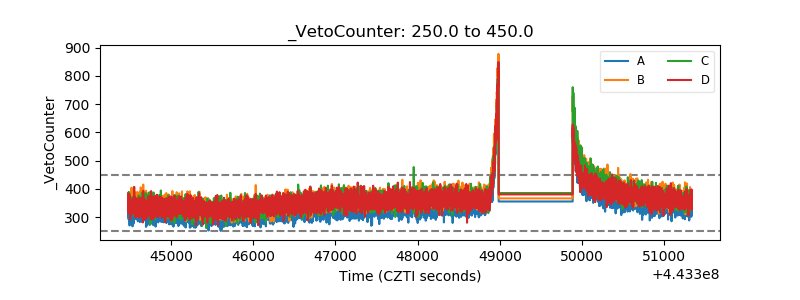 |