| Param | Original file | Final file |
|---|---|---|
| Filename | modeM0/AS1A13_017T02_9000006032_44935cztM0_level2.fits | modeM0/AS1A13_017T02_9000006032_44935cztM0_level2_quad_clean.evt |
| Size (bytes) | 620,095,680 | 91,920,960 |
| Size | 591.4 MB | 87.7 MB |
| Events in quadrant A | 4,820,830 | 675,191 |
| Events in quadrant B | 3,692,134 | 695,063 |
| Events in quadrant C | 2,773,959 | 681,916 |
| Events in quadrant D | 11,193,013 | 305,046 |
| Mode SS | |||
|---|---|---|---|
| Quadrant | BADHDUFLAG | Total packets | Discarded packets |
| A | 0 | 122 | 0 |
| B | 0 | 122 | 0 |
| C | 0 | 122 | 0 |
| D | 0 | 122 | 0 |
| Mode M0 | |||
|---|---|---|---|
| Quadrant | BADHDUFLAG | Total packets | Discarded packets |
| A | 0 | 18876 | 1 |
| B | 0 | 14953 | 1 |
| C | 0 | 12478 | 1 |
| D | 0 | 37452 | 1 |
| Mode M9 | |||
|---|---|---|---|
| Quadrant | BADHDUFLAG | Total packets | Discarded packets |
| A | 0 | 11 | 0 |
| B | 0 | 11 | 0 |
| C | 0 | 11 | 0 |
| D | 0 | 11 | 0 |
| Quadrant | Total seconds | Saturated seconds | Saturation percentage |
|---|---|---|---|
| A | 6105 | 86 | 1.408681% |
| B | 6105 | 142 | 2.325962% |
| C | 6104 | 15 | 0.245740% |
| D | 6105 | 3471 | 56.855037% |
Noise dominated data is calculated using 1-second bins in cleaned event files. If a bin has >2000 counts, and if more than 50% of those come from <1% of pixels, then it is considered to be noise-dominated and hence unusable.
| Quadrant | # 1 sec bins | Bins with >0 counts | Bins with >2000 counts | High rate bins dominated by noise | Noise dominated (total time) | Noise dominated (detector-on time) | Marked lightcurve |
|---|---|---|---|---|---|---|---|
| A | 7165 | 6106 | 1 | 1 | 0.01% | 0.02% | 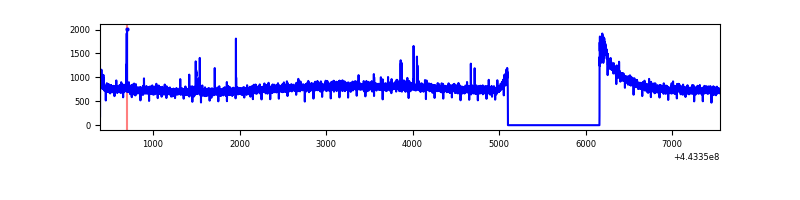 |
| B | 7165 | 6106 | 62 | 62 | 0.87% | 1.02% | 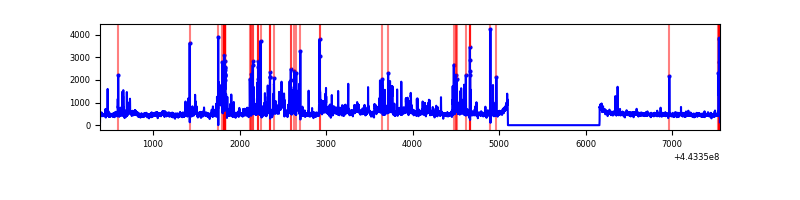 |
| C | 7164 | 6105 | 4 | 4 | 0.06% | 0.07% | 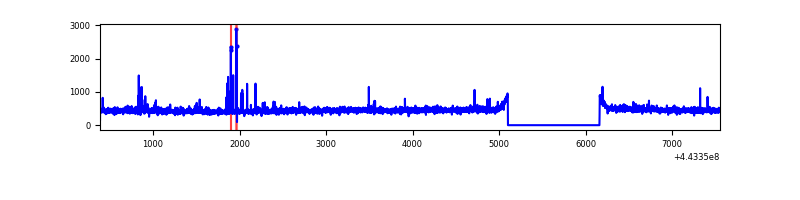 |
| D | 7165 | 6103 | 2688 | 2688 | 37.52% | 44.04% | 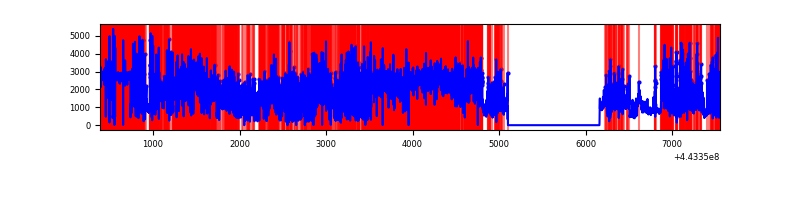 |
Top three noisy pixels from each quadrant. If the there are fewer than three noisy pixels in the level2.evt file, extra rows are filled as -1
| Pixel properties | Quadrant properties | ||||||
|---|---|---|---|---|---|---|---|
| Quadrant | DetID | PixID | Counts | Sigma | Mean | Median | Sigma |
| A | 10 | 83 | 2075154 | 14185.69 | 699 | 683 | 146.2 |
| A | 7 | 3 | 27203 | 181.35 | 699 | 683 | 146.2 |
| A | 0 | 243 | 11101 | 71.24 | 699 | 683 | 146.2 |
| B | 4 | 171 | 514622 | 3719.58 | 692 | 671 | 138.2 |
| B | 5 | 172 | 117586 | 846.14 | 692 | 671 | 138.2 |
| B | 3 | 112 | 61202 | 438.08 | 692 | 671 | 138.2 |
| C | 1 | 3 | 52135 | 317.59 | 689 | 693 | 162.0 |
| C | 14 | 254 | 21187 | 126.52 | 689 | 693 | 162.0 |
| C | 3 | 233 | 14969 | 88.14 | 689 | 693 | 162.0 |
| D | 13 | 187 | 6137600 | 48828.14 | 485 | 469 | 125.7 |
| D | 1 | 52 | 1562066 | 12424.35 | 485 | 469 | 125.7 |
| D | 13 | 249 | 637506 | 5068.38 | 485 | 469 | 125.7 |
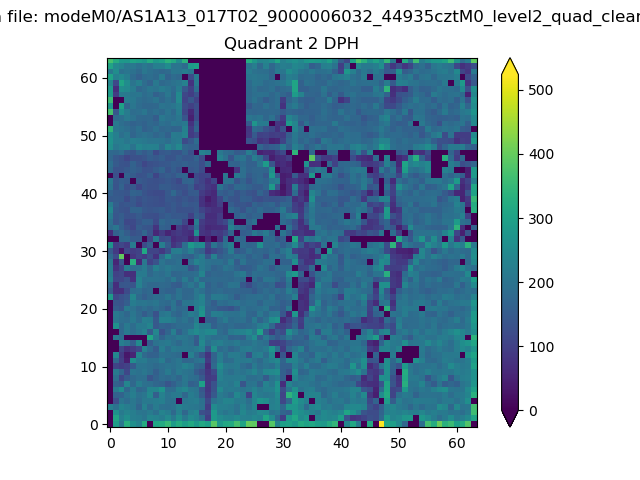
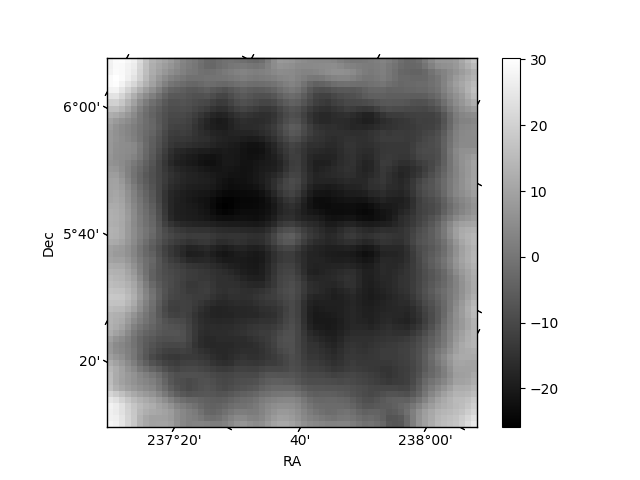
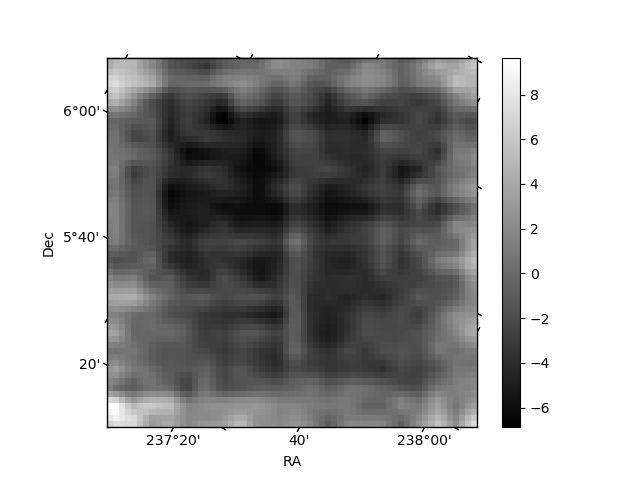
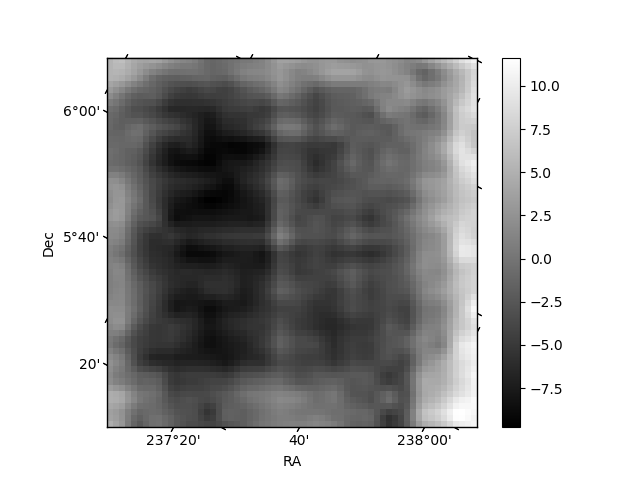
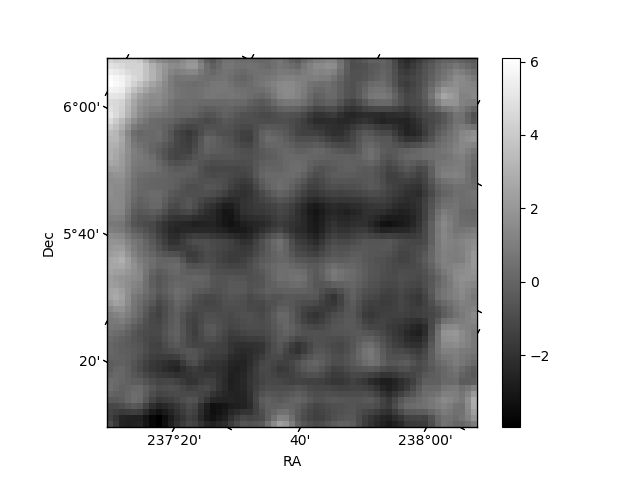
Histogram calculated using DETX and DETY for each event in the final _common_clean file
| Quadrant A | 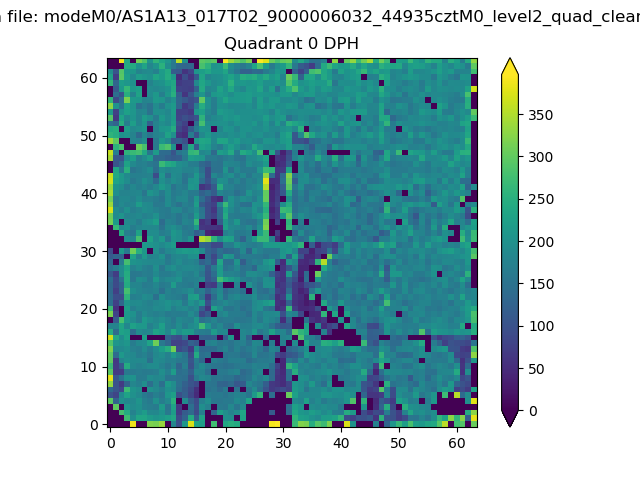 |
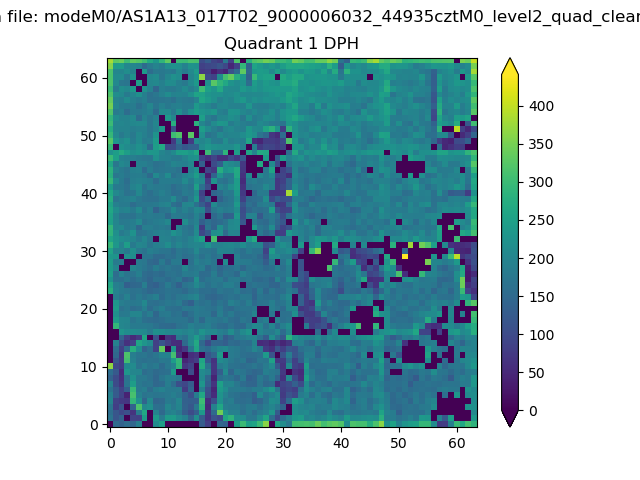 |
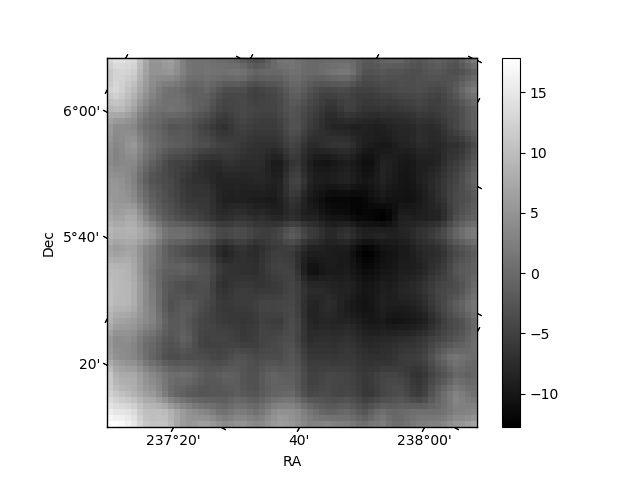
Quadrant B |
|---|---|---|---|
| Quadrant D | 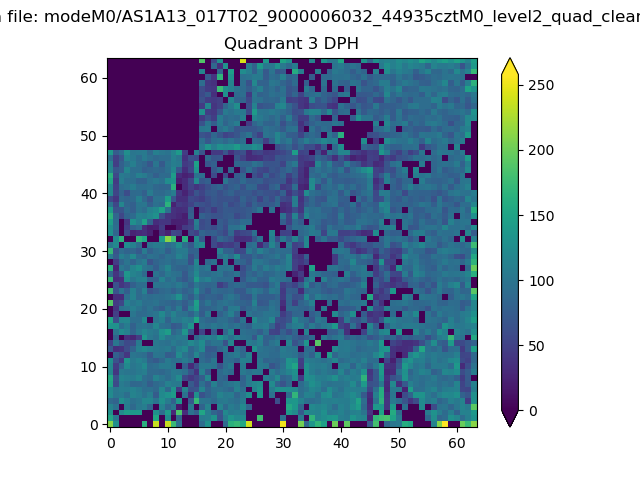 |
 |
Quadrant C |
| Plot type | Count rate plots | Images |
|---|---|---|
| Comparison with Poisson distribution Blue bars denote a histogram of data divided into 1 sec bins. Red curve is a Poisson curve with rate = median count rate of data. |
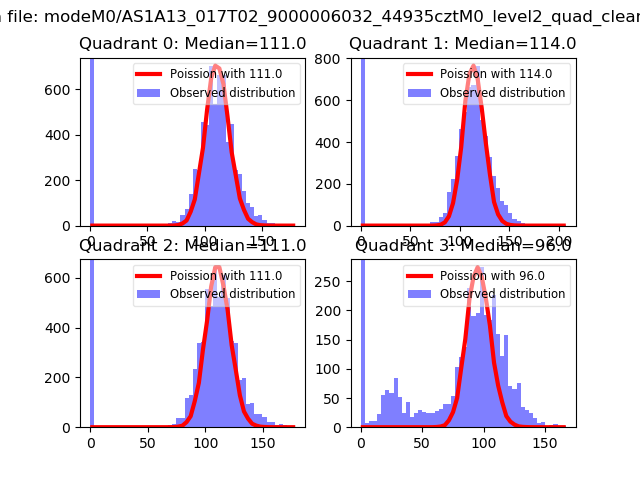 |
 |
| Quadrant-wise count rates Data is divided into 100 sec bins |
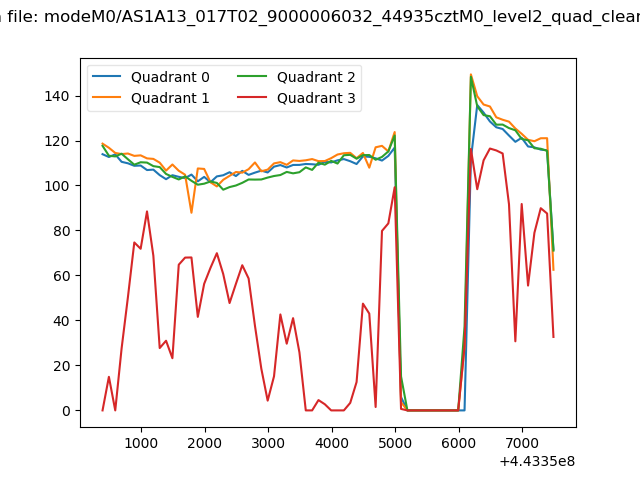 |
|
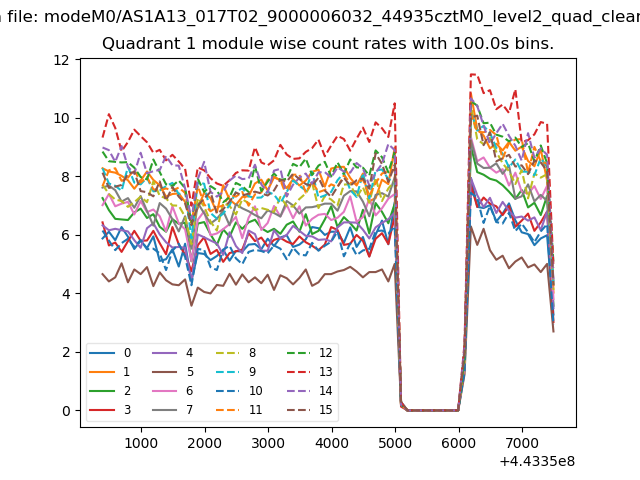
| Module-wise count rates for Quadrant A Data is divided into 100 sec bins |
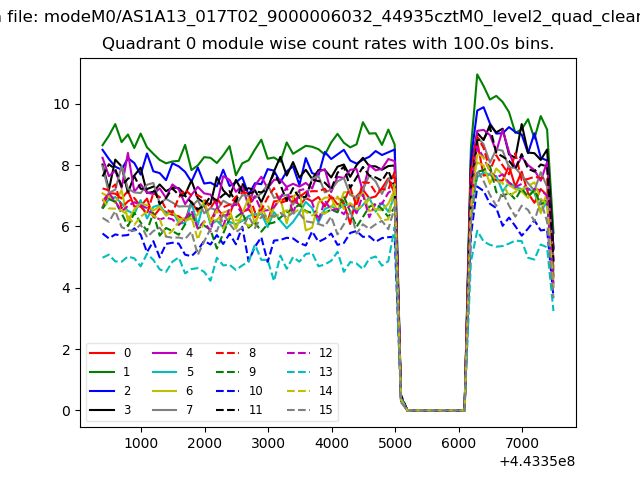 |
 |
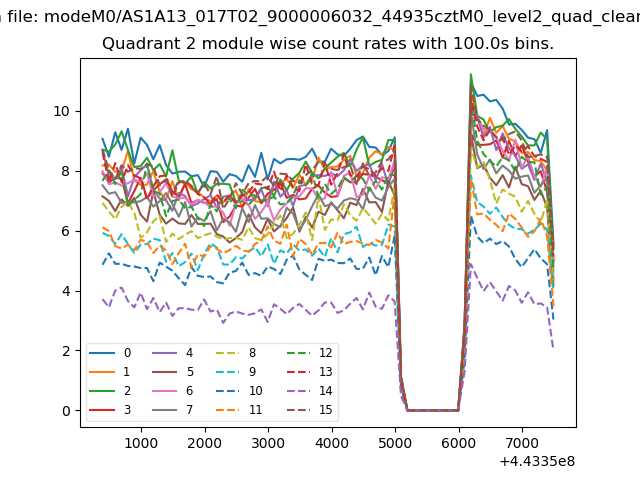
| Module-wise count rates for Quadrant B Data is divided into 100 sec bins |
 |
 |
| Module-wise count rates for Quadrant C Data is divided into 100 sec bins |
 |
 |
| Module-wise count rates for Quadrant D Data is divided into 100 sec bins |
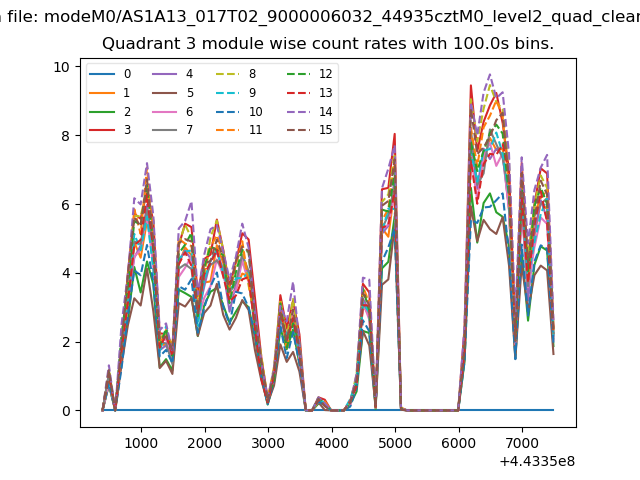 |
 |
| Parameter | Plot |
|---|---|
| CZT HV Monitor | 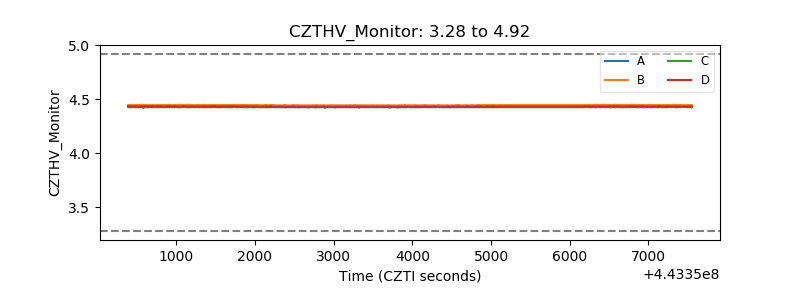 |
| D_VDD | 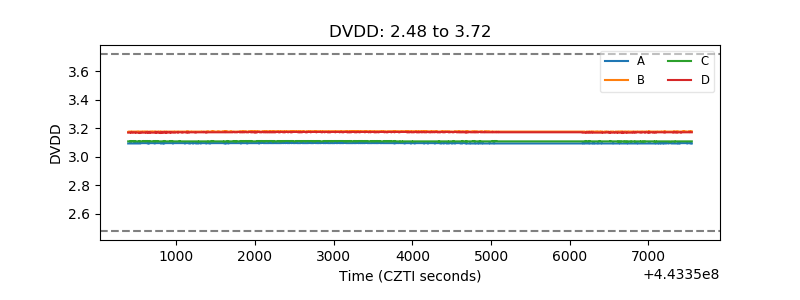 |
| Temperature 1 | 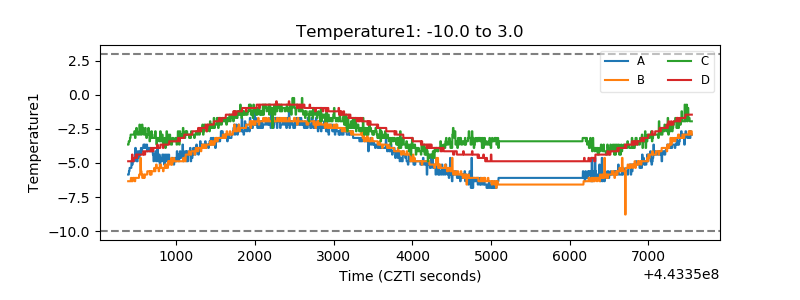 |
| Veto HV Monitor | 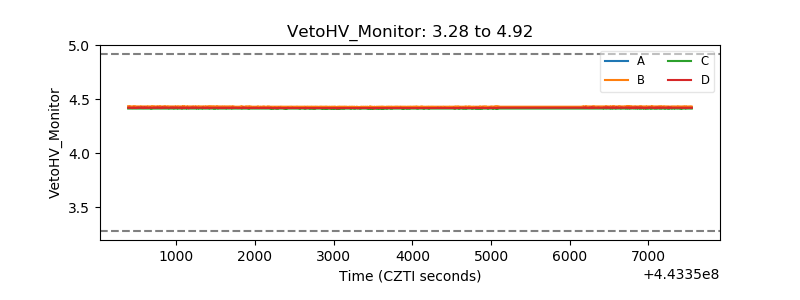 |
| Veto LLD | 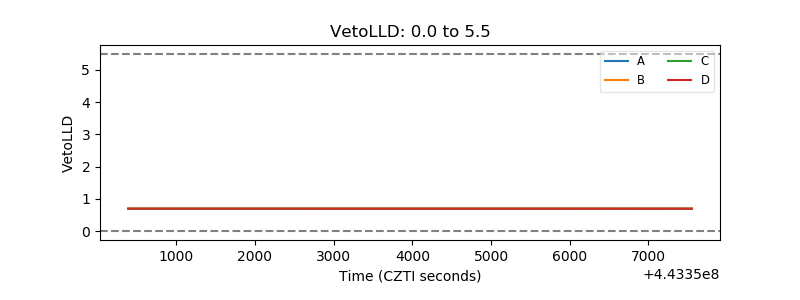 |
| Alpha Counter | 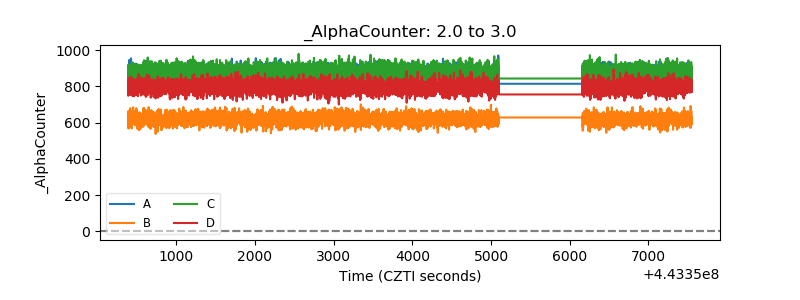 |
| _CPM_Rate | 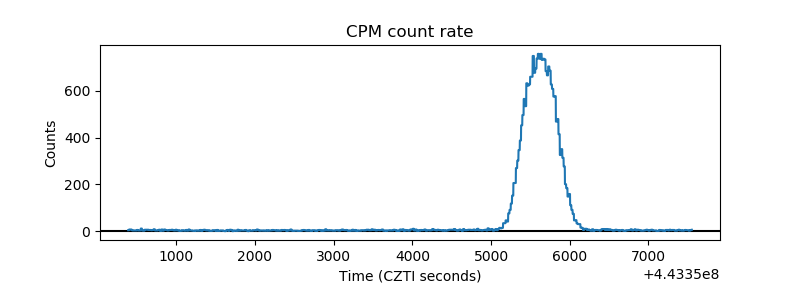 |
| CZT Counter | 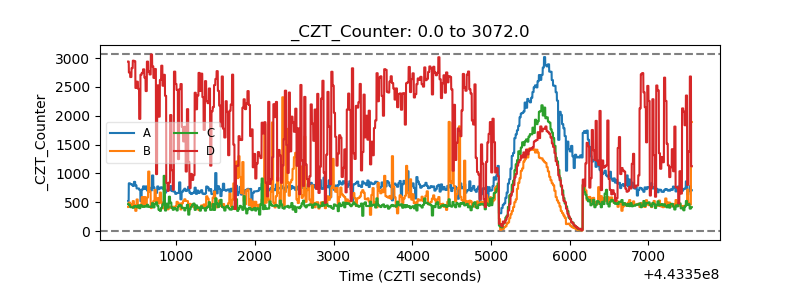 |
| +2.5 Volts monitor | 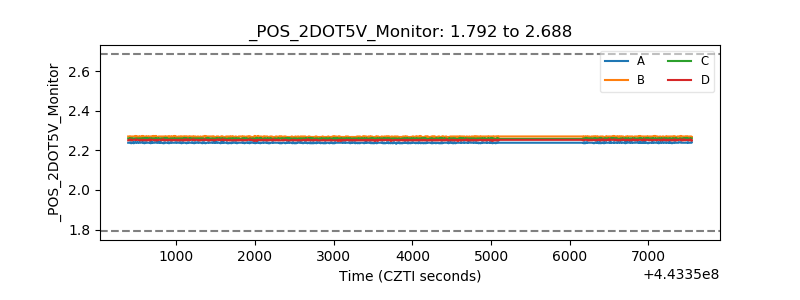 |
| +5 Volts monitor | 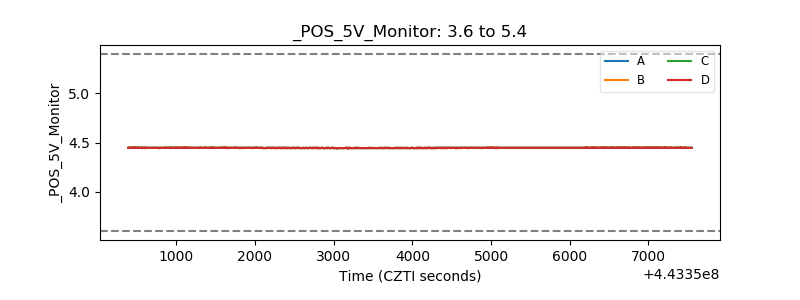 |
| _ROLL_ROT | 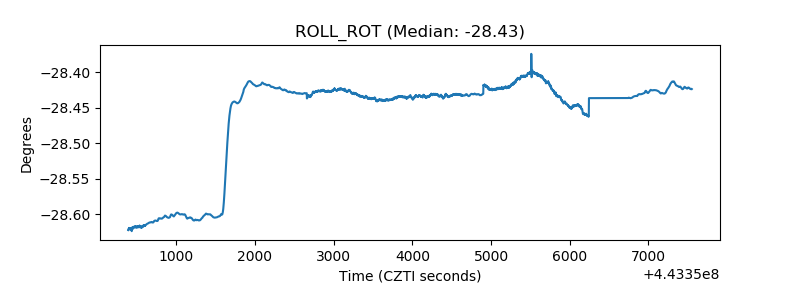 |
| _Roll_DEC |  |
| _Roll_RA | 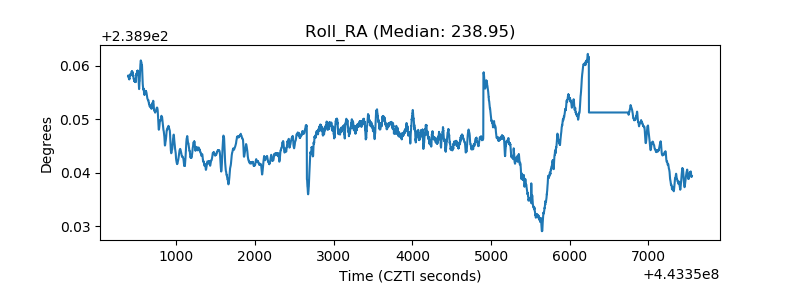 |
| Veto Counter | 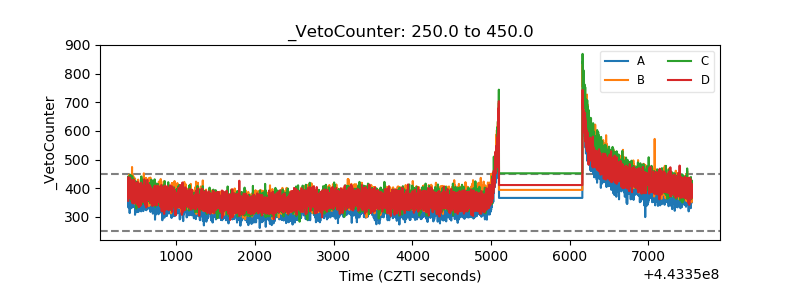 |