| Param | Original file | Final file |
|---|---|---|
| Filename | modeM0/AS1A13_017T02_9000006032_44936cztM0_level2.fits | modeM0/AS1A13_017T02_9000006032_44936cztM0_level2_quad_clean.evt |
| Size (bytes) | 484,945,920 | 100,500,480 |
| Size | 462.5 MB | 95.8 MB |
| Events in quadrant A | 4,761,855 | 684,887 |
| Events in quadrant B | 3,490,792 | 698,052 |
| Events in quadrant C | 3,011,937 | 690,147 |
| Events in quadrant D | 6,227,275 | 556,329 |
| Mode SS | |||
|---|---|---|---|
| Quadrant | BADHDUFLAG | Total packets | Discarded packets |
| A | 0 | 122 | 0 |
| B | 0 | 122 | 0 |
| C | 0 | 122 | 0 |
| D | 0 | 122 | 0 |
| Mode M0 | |||
|---|---|---|---|
| Quadrant | BADHDUFLAG | Total packets | Discarded packets |
| A | 0 | 18396 | 1 |
| B | 0 | 14055 | 1 |
| C | 0 | 12852 | 1 |
| D | 0 | 22573 | 1 |
| Mode M9 | |||
|---|---|---|---|
| Quadrant | BADHDUFLAG | Total packets | Discarded packets |
| A | 0 | 11 | 0 |
| B | 0 | 11 | 0 |
| C | 0 | 11 | 0 |
| D | 0 | 11 | 0 |
| Quadrant | Total seconds | Saturated seconds | Saturation percentage |
|---|---|---|---|
| A | 5917 | 142 | 2.399865% |
| B | 5918 | 239 | 4.038527% |
| C | 5918 | 102 | 1.723555% |
| D | 5918 | 881 | 14.886786% |
Noise dominated data is calculated using 1-second bins in cleaned event files. If a bin has >2000 counts, and if more than 50% of those come from <1% of pixels, then it is considered to be noise-dominated and hence unusable.
| Quadrant | # 1 sec bins | Bins with >0 counts | Bins with >2000 counts | High rate bins dominated by noise | Noise dominated (total time) | Noise dominated (detector-on time) | Marked lightcurve |
|---|---|---|---|---|---|---|---|
| A | 7032 | 5918 | 4 | 4 | 0.06% | 0.07% | 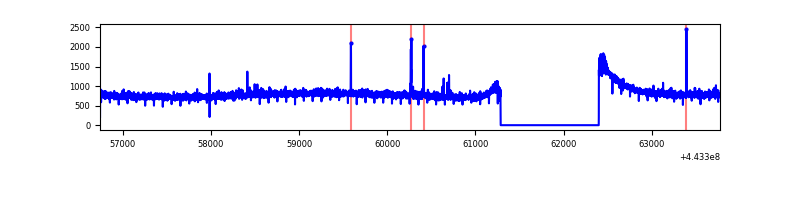 |
| B | 7033 | 5919 | 105 | 105 | 1.49% | 1.77% | 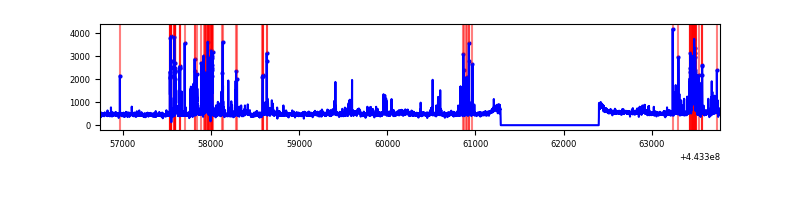 |
| C | 7033 | 5919 | 30 | 30 | 0.43% | 0.51% | 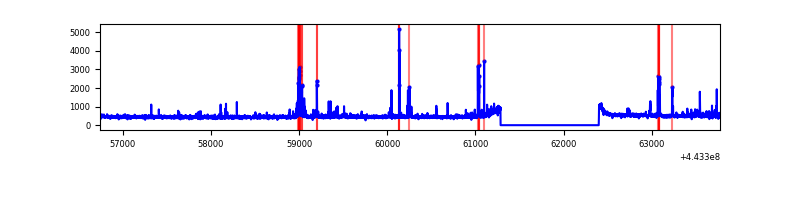 |
| D | 7033 | 5919 | 583 | 583 | 8.29% | 9.85% | 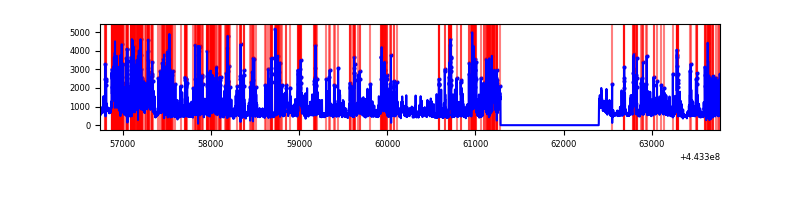 |
Top three noisy pixels from each quadrant. If the there are fewer than three noisy pixels in the level2.evt file, extra rows are filled as -1
| Pixel properties | Quadrant properties | ||||||
|---|---|---|---|---|---|---|---|
| Quadrant | DetID | PixID | Counts | Sigma | Mean | Median | Sigma |
| A | 10 | 83 | 1986701 | 13448.25 | 708 | 694 | 147.7 |
| A | 7 | 3 | 13909 | 89.49 | 708 | 694 | 147.7 |
| A | 0 | 243 | 13240 | 84.96 | 708 | 694 | 147.7 |
| B | 5 | 172 | 443086 | 3253.15 | 697 | 678 | 136.0 |
| B | 4 | 171 | 63880 | 464.74 | 697 | 678 | 136.0 |
| B | 0 | 183 | 42680 | 308.85 | 697 | 678 | 136.0 |
| C | 15 | 208 | 90706 | 547.48 | 700 | 704 | 164.4 |
| C | 1 | 3 | 89003 | 537.12 | 700 | 704 | 164.4 |
| C | 14 | 254 | 72526 | 436.89 | 700 | 704 | 164.4 |
| D | 1 | 52 | 1727605 | 10497.44 | 655 | 638 | 164.5 |
| D | 13 | 249 | 637004 | 3868.18 | 655 | 638 | 164.5 |
| D | 13 | 171 | 369158 | 2240.06 | 655 | 638 | 164.5 |
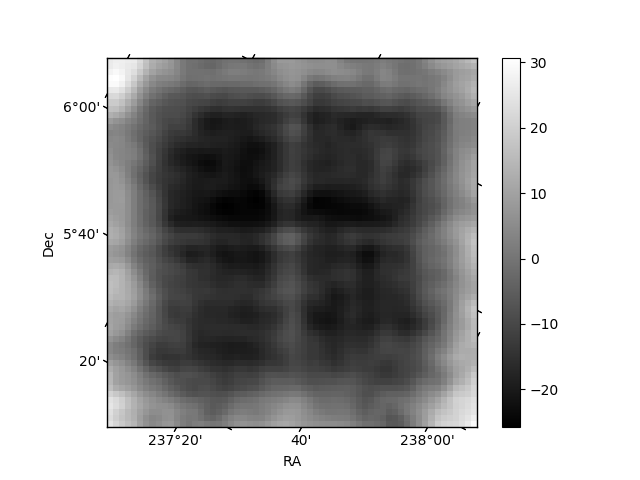
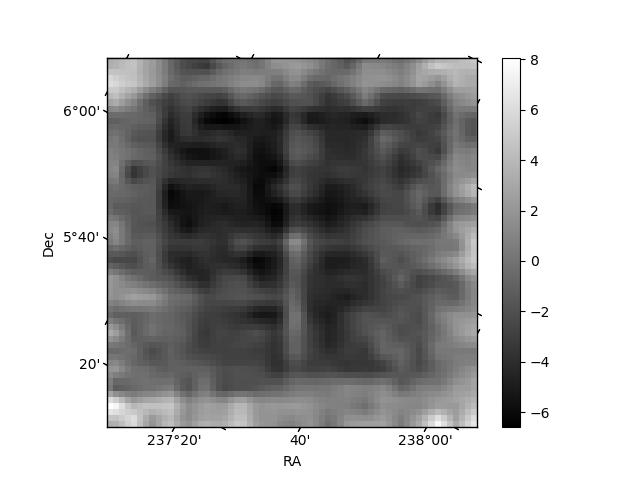
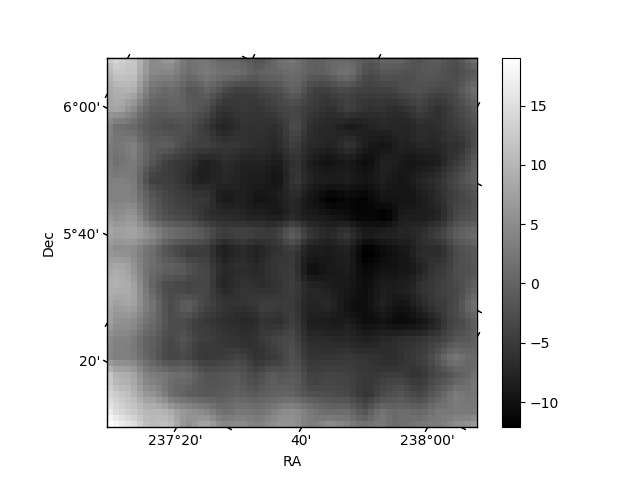
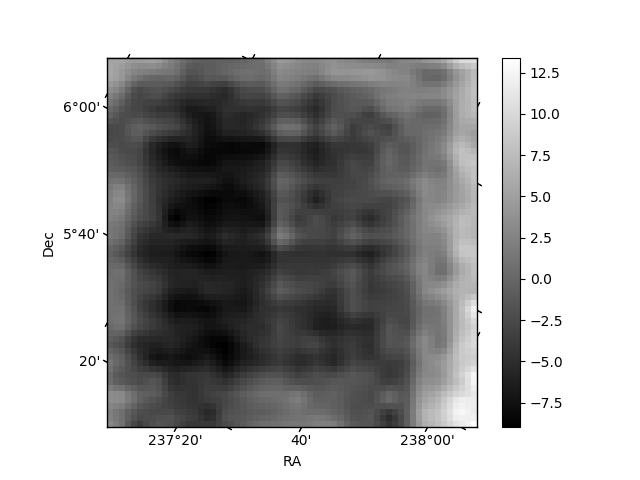
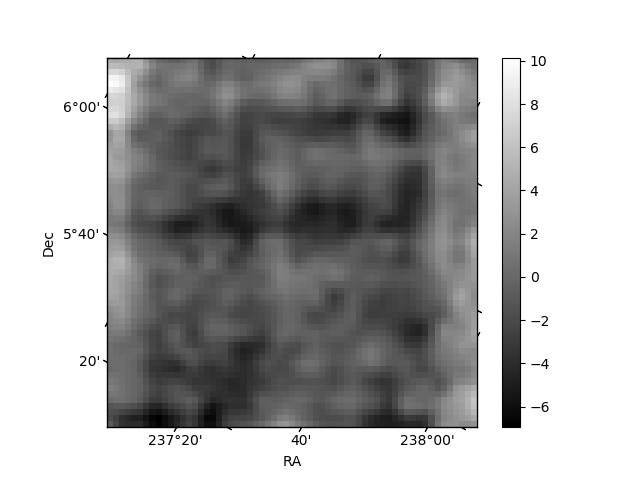
Histogram calculated using DETX and DETY for each event in the final _common_clean file
| Quadrant A | 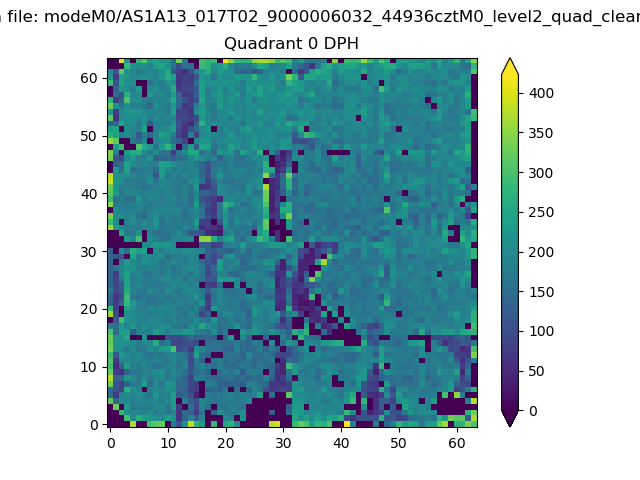 |
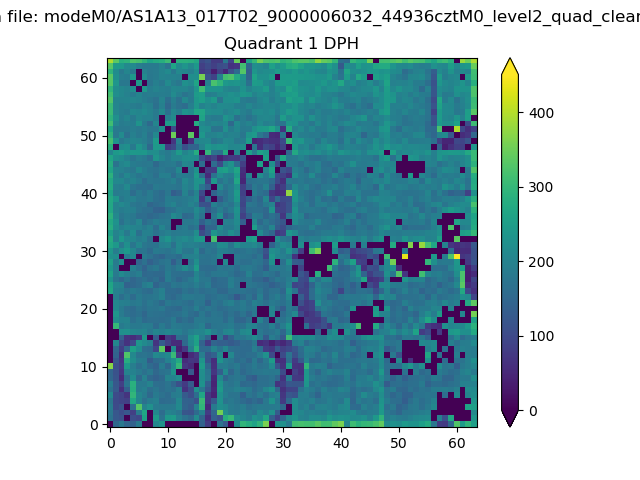 |
Quadrant B |
|---|---|---|---|
| Quadrant D | 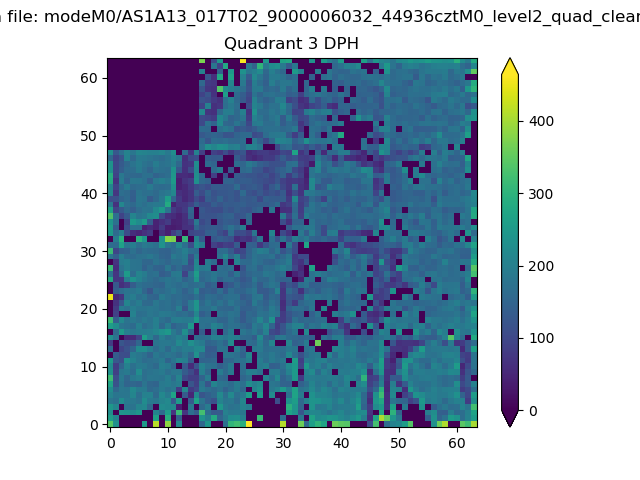 |
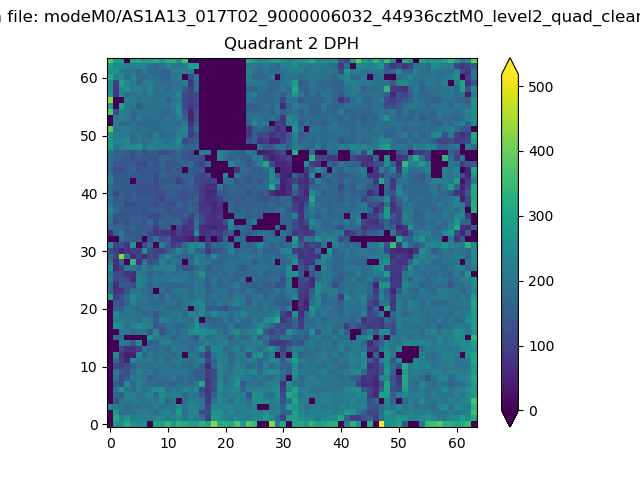 |
Quadrant C |
| Plot type | Count rate plots | Images |
|---|---|---|
| Comparison with Poisson distribution Blue bars denote a histogram of data divided into 1 sec bins. Red curve is a Poisson curve with rate = median count rate of data. |
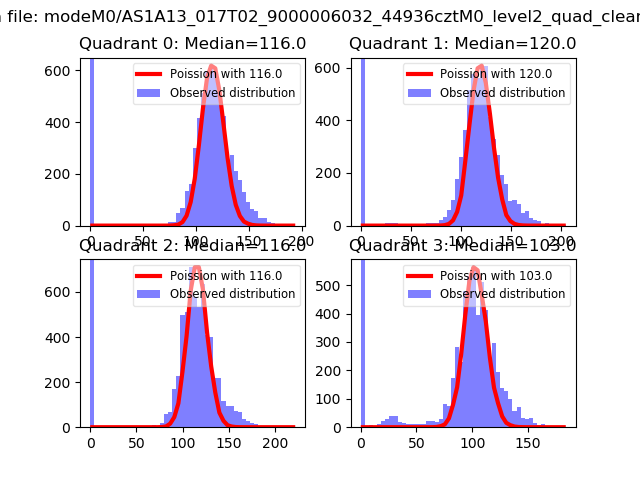 |
 |
| Quadrant-wise count rates Data is divided into 100 sec bins |
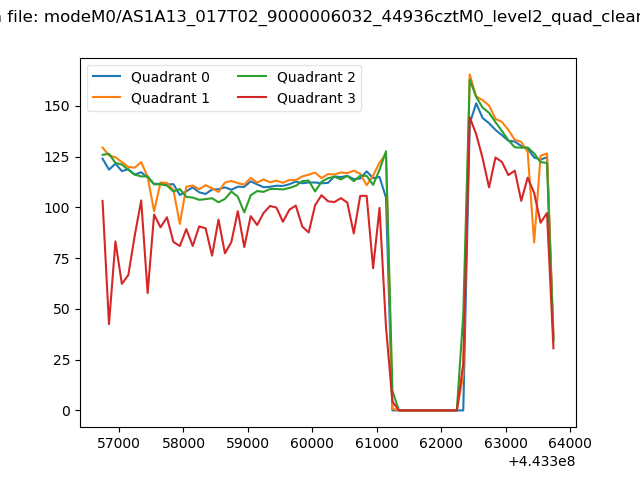 |
|
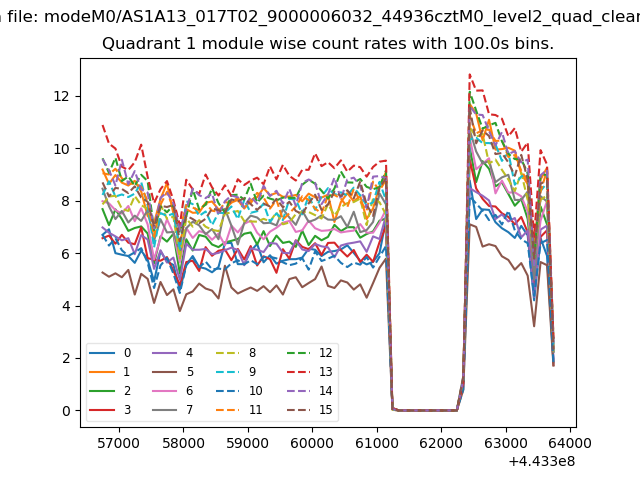
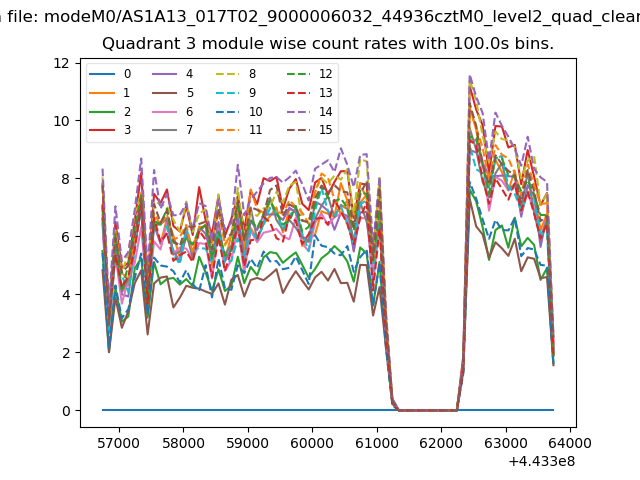
| Module-wise count rates for Quadrant A Data is divided into 100 sec bins |
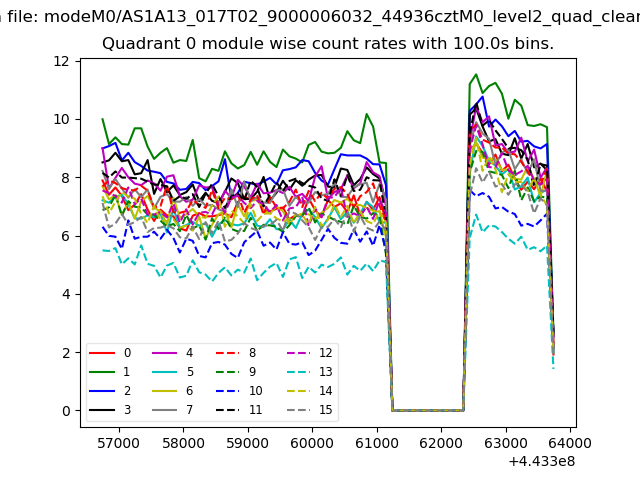 |
 |
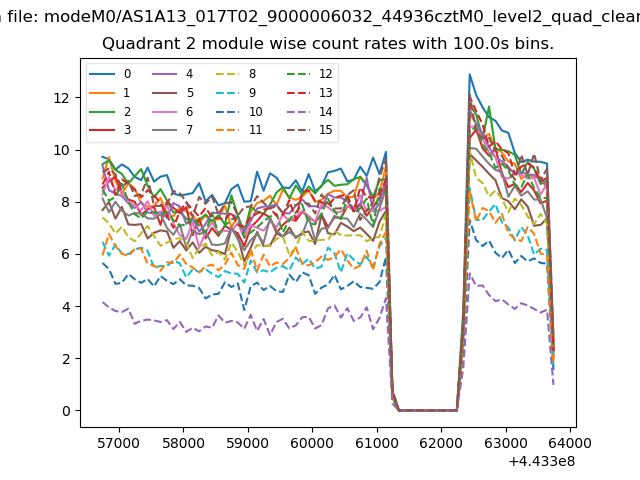
| Module-wise count rates for Quadrant B Data is divided into 100 sec bins |
 |
 |
| Module-wise count rates for Quadrant C Data is divided into 100 sec bins |
 |
 |
| Module-wise count rates for Quadrant D Data is divided into 100 sec bins |
 |
 |
| Parameter | Plot |
|---|---|
| CZT HV Monitor | 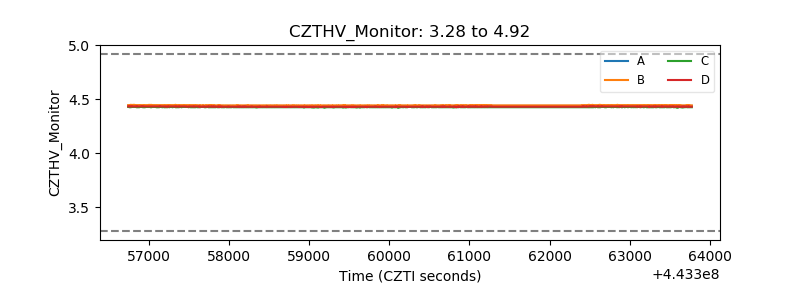 |
| D_VDD | 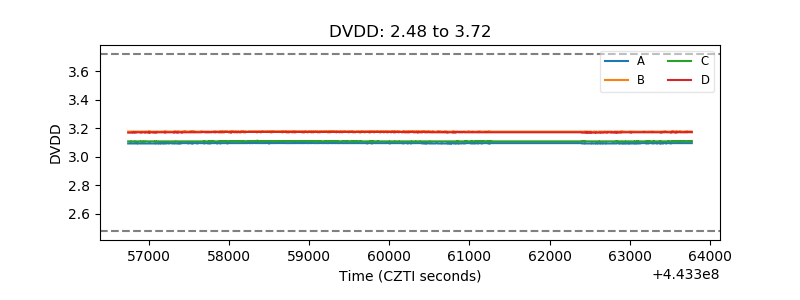 |
| Temperature 1 | 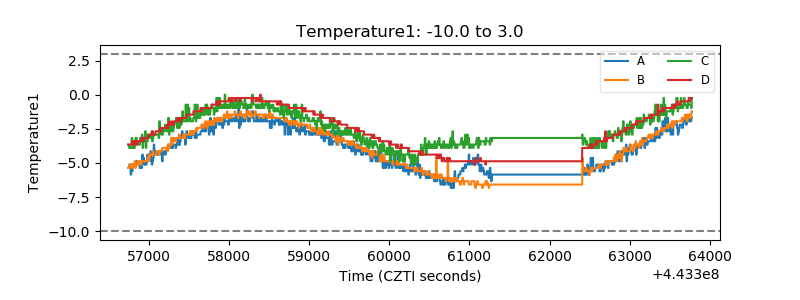 |
| Veto HV Monitor | 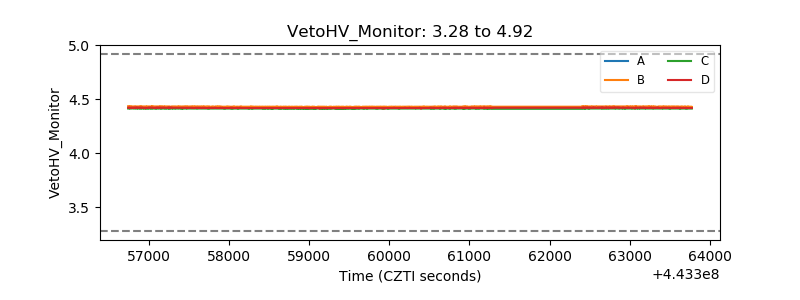 |
| Veto LLD | 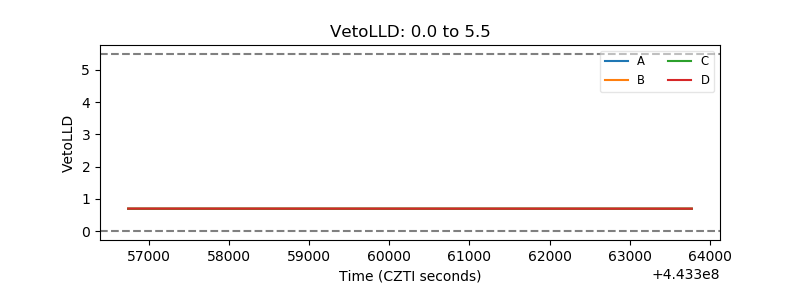 |
| Alpha Counter | 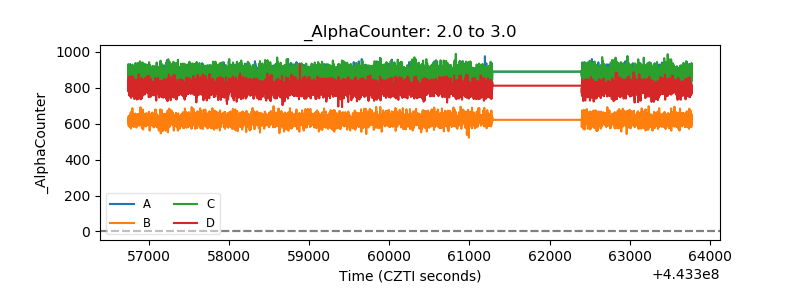 |
| _CPM_Rate | 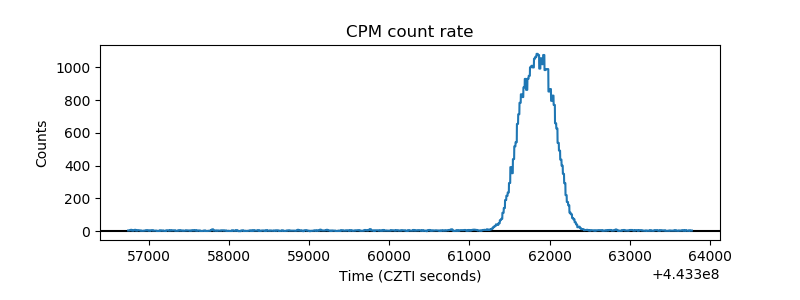 |
| CZT Counter | 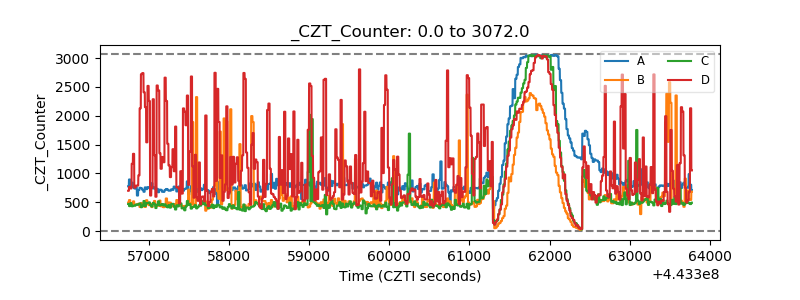 |
| +2.5 Volts monitor | 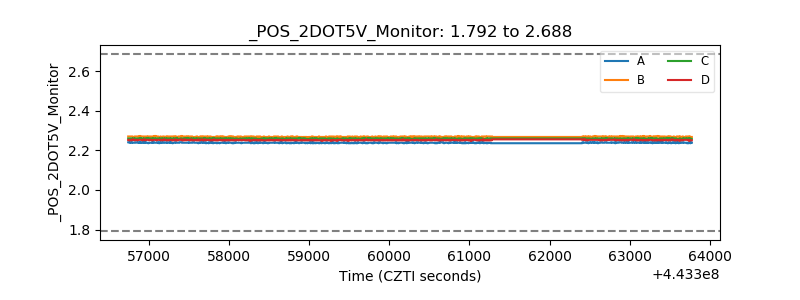 |
| +5 Volts monitor | 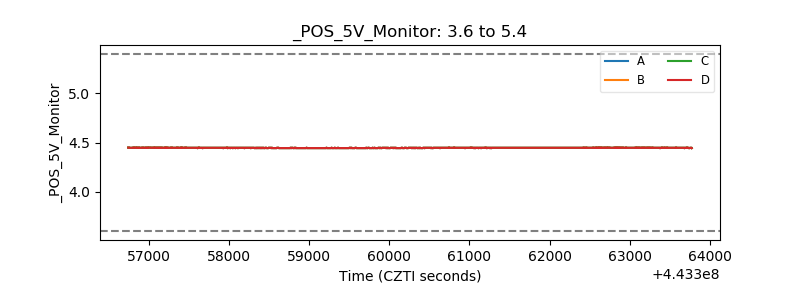 |
| _ROLL_ROT | 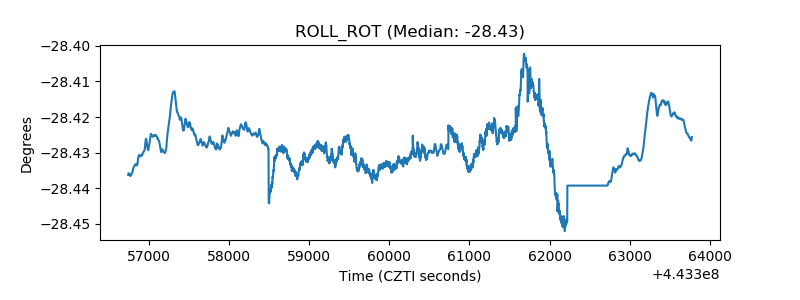 |
| _Roll_DEC |  |
| _Roll_RA | 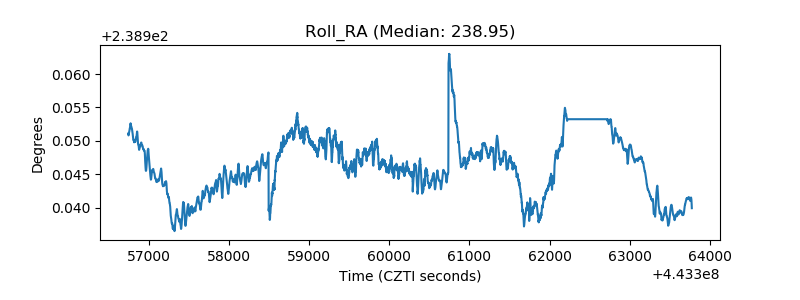 |
| Veto Counter | 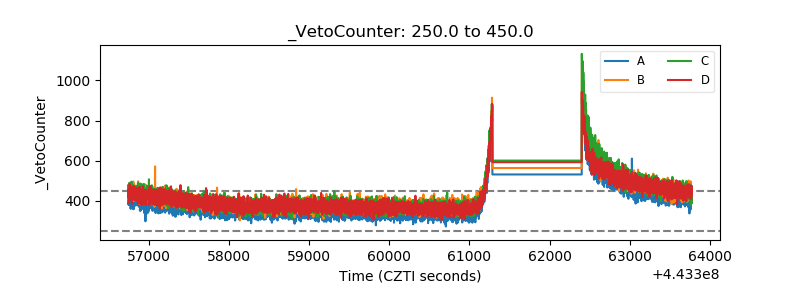 |