| Param | Original file | Final file |
|---|---|---|
| Filename | modeM0/AS1A13_017T02_9000006032_44937cztM0_level2.fits | modeM0/AS1A13_017T02_9000006032_44937cztM0_level2_quad_clean.evt |
| Size (bytes) | 502,597,440 | 109,140,480 |
| Size | 479.3 MB | 104.1 MB |
| Events in quadrant A | 5,199,468 | 745,972 |
| Events in quadrant B | 3,772,501 | 765,100 |
| Events in quadrant C | 3,297,415 | 750,997 |
| Events in quadrant D | 5,858,588 | 613,671 |
| Mode SS | |||
|---|---|---|---|
| Quadrant | BADHDUFLAG | Total packets | Discarded packets |
| A | 0 | 126 | 0 |
| B | 0 | 126 | 0 |
| C | 0 | 126 | 0 |
| D | 0 | 126 | 0 |
| Mode M0 | |||
|---|---|---|---|
| Quadrant | BADHDUFLAG | Total packets | Discarded packets |
| A | 0 | 19370 | 1 |
| B | 0 | 15084 | 1 |
| C | 0 | 13587 | 2 |
| D | 0 | 21574 | 1 |
| Mode M9 | |||
|---|---|---|---|
| Quadrant | BADHDUFLAG | Total packets | Discarded packets |
| A | 0 | 11 | 0 |
| B | 0 | 11 | 0 |
| C | 0 | 11 | 0 |
| D | 0 | 11 | 0 |
| Quadrant | Total seconds | Saturated seconds | Saturation percentage |
|---|---|---|---|
| A | 6142 | 175 | 2.849235% |
| B | 6143 | 221 | 3.597591% |
| C | 6142 | 100 | 1.628134% |
| D | 6143 | 784 | 12.762494% |
Noise dominated data is calculated using 1-second bins in cleaned event files. If a bin has >2000 counts, and if more than 50% of those come from <1% of pixels, then it is considered to be noise-dominated and hence unusable.
| Quadrant | # 1 sec bins | Bins with >0 counts | Bins with >2000 counts | High rate bins dominated by noise | Noise dominated (total time) | Noise dominated (detector-on time) | Marked lightcurve |
|---|---|---|---|---|---|---|---|
| A | 7312 | 6143 | 6 | 6 | 0.08% | 0.10% | 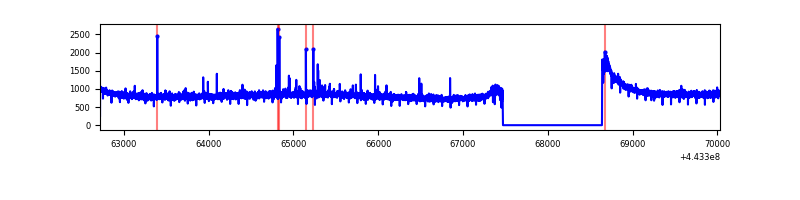 |
| B | 7313 | 6144 | 68 | 68 | 0.93% | 1.11% | 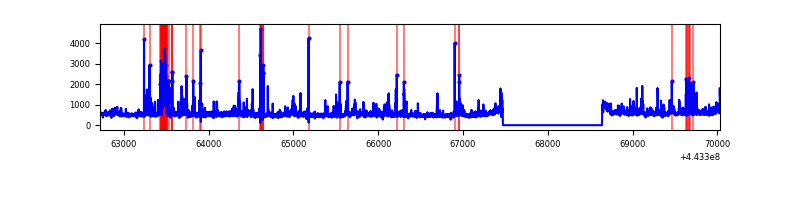 |
| C | 7313 | 6144 | 24 | 24 | 0.33% | 0.39% | 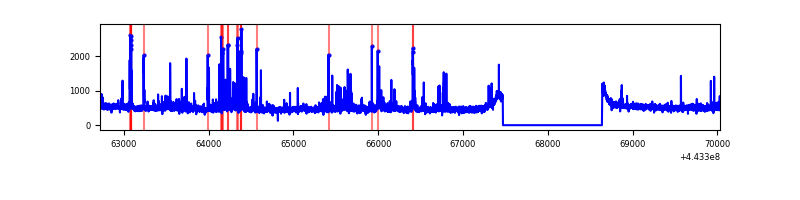 |
| D | 7313 | 6144 | 507 | 507 | 6.93% | 8.25% | 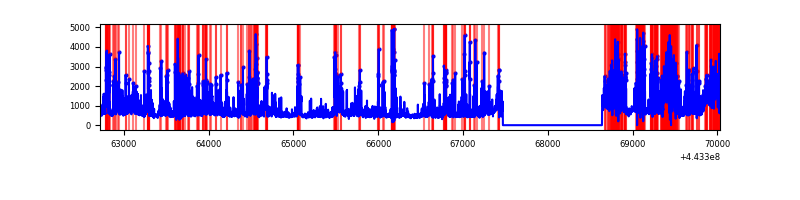 |
Top three noisy pixels from each quadrant. If the there are fewer than three noisy pixels in the level2.evt file, extra rows are filled as -1
| Pixel properties | Quadrant properties | ||||||
|---|---|---|---|---|---|---|---|
| Quadrant | DetID | PixID | Counts | Sigma | Mean | Median | Sigma |
| A | 10 | 83 | 2179874 | 13769.73 | 763 | 750 | 158.3 |
| A | 7 | 16 | 22808 | 139.38 | 763 | 750 | 158.3 |
| A | 0 | 243 | 15406 | 92.61 | 763 | 750 | 158.3 |
| B | 5 | 172 | 254209 | 1726.66 | 753 | 731 | 146.8 |
| B | 4 | 171 | 164031 | 1112.38 | 753 | 731 | 146.8 |
| B | 0 | 219 | 72553 | 489.24 | 753 | 731 | 146.8 |
| C | 14 | 254 | 197173 | 1112.35 | 757 | 763 | 176.6 |
| C | 1 | 3 | 84255 | 472.85 | 757 | 763 | 176.6 |
| C | 3 | 233 | 30022 | 165.71 | 757 | 763 | 176.6 |
| D | 13 | 249 | 1234241 | 6916.78 | 716 | 695 | 178.3 |
| D | 1 | 52 | 566021 | 3169.91 | 716 | 695 | 178.3 |
| D | 13 | 171 | 298077 | 1667.49 | 716 | 695 | 178.3 |
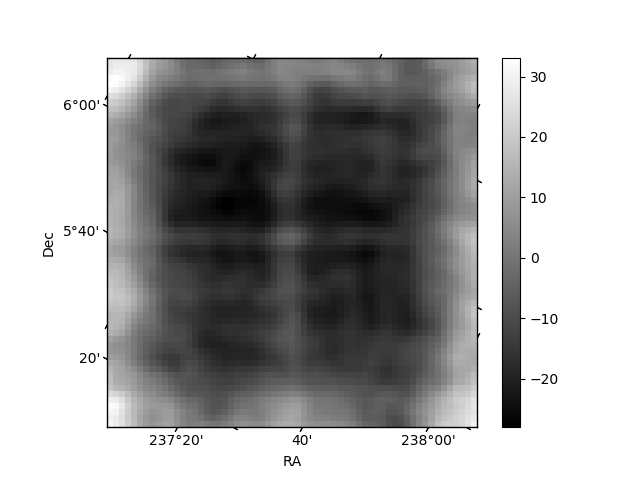
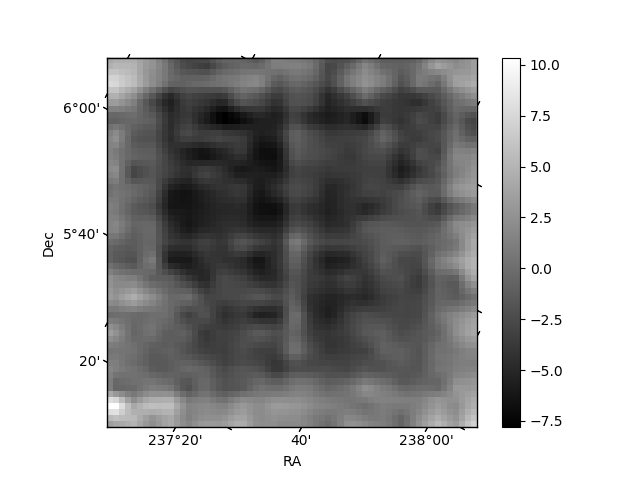
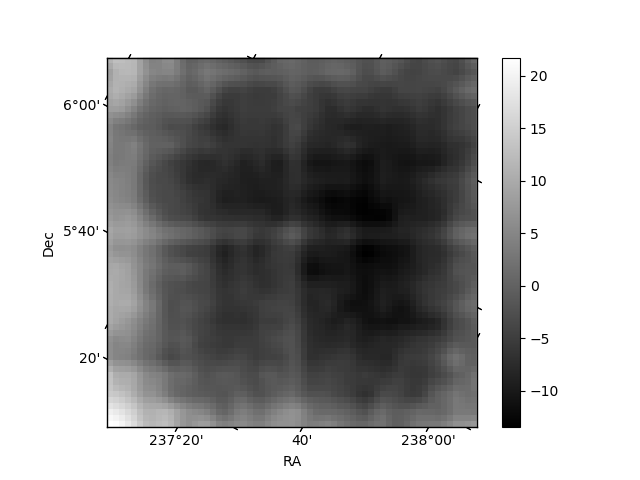
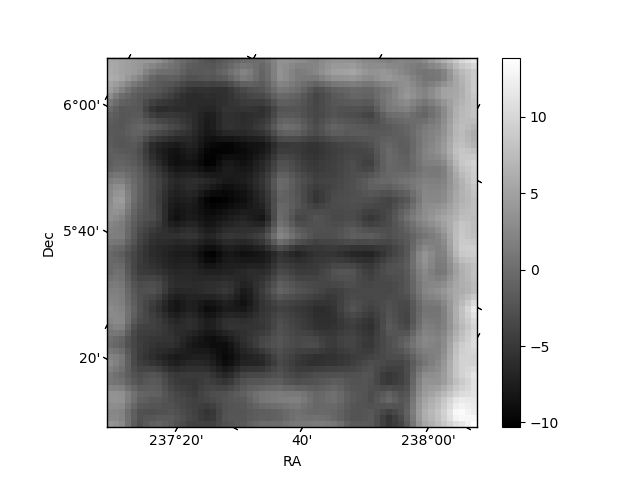
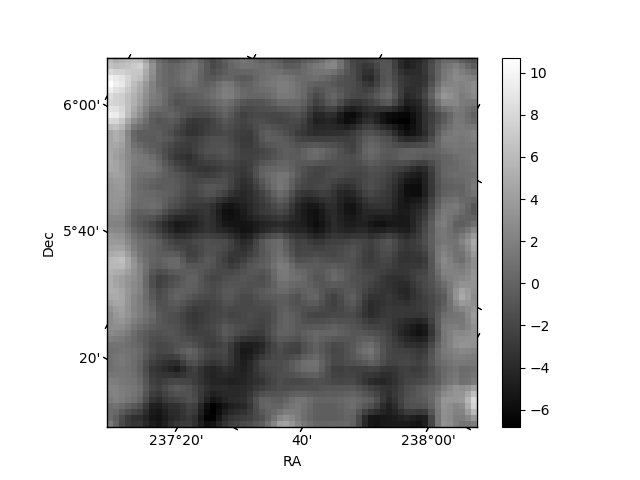
Histogram calculated using DETX and DETY for each event in the final _common_clean file
| Quadrant A | 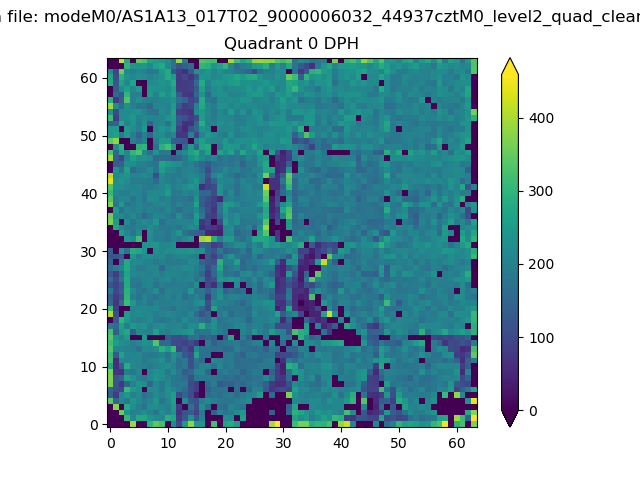 |
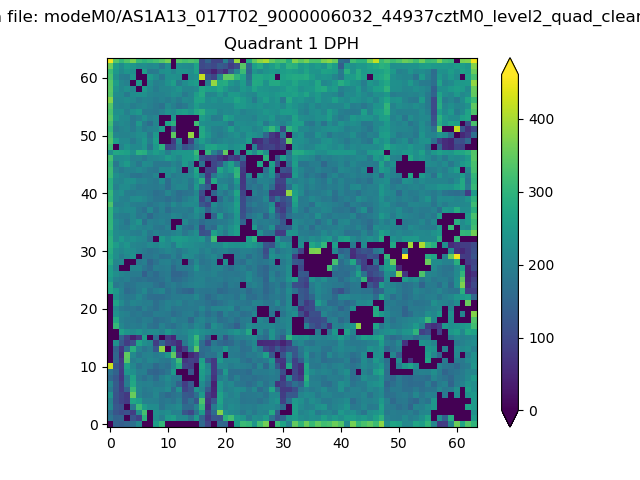 |
Quadrant B |
|---|---|---|---|
| Quadrant D | 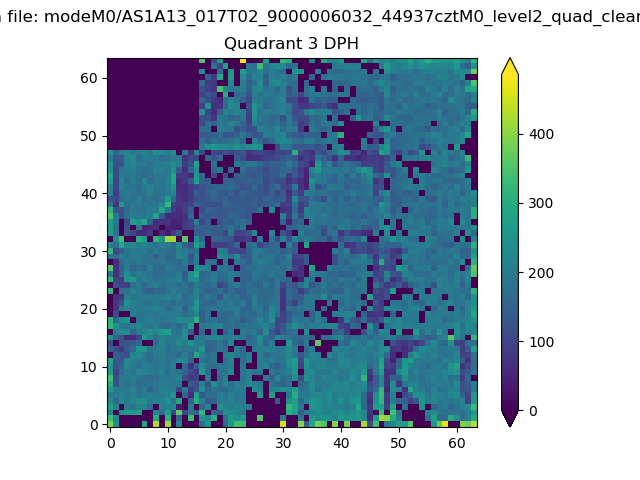 |
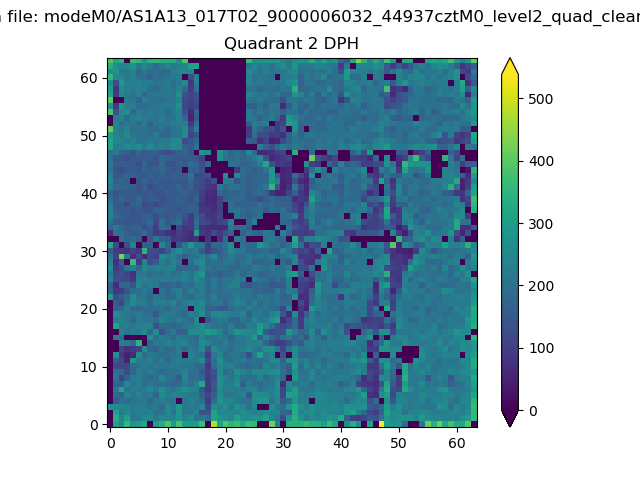 |
Quadrant C |
| Plot type | Count rate plots | Images |
|---|---|---|
| Comparison with Poisson distribution Blue bars denote a histogram of data divided into 1 sec bins. Red curve is a Poisson curve with rate = median count rate of data. |
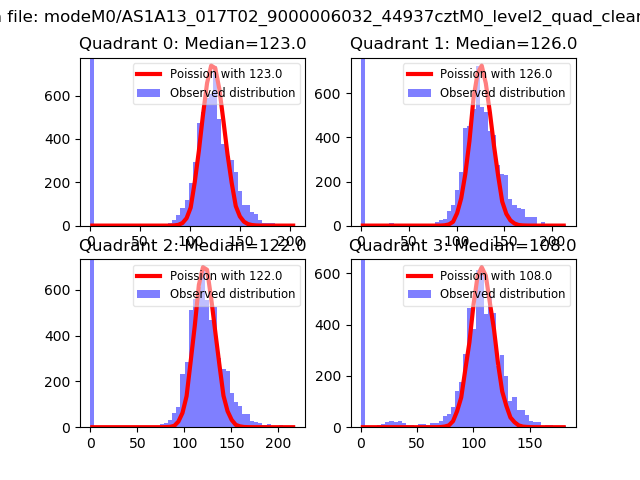 |
 |
| Quadrant-wise count rates Data is divided into 100 sec bins |
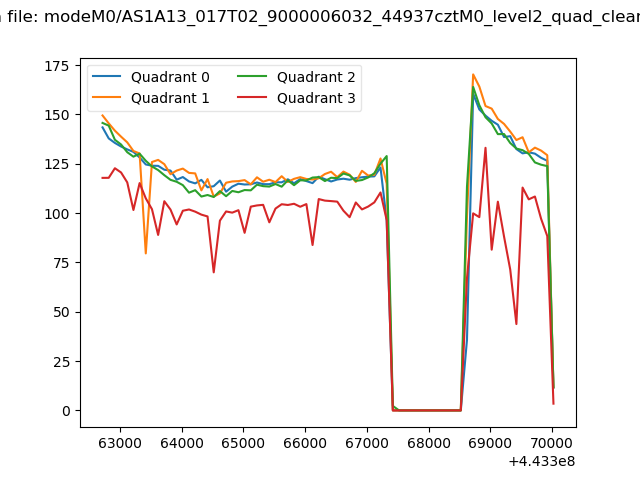 |
|
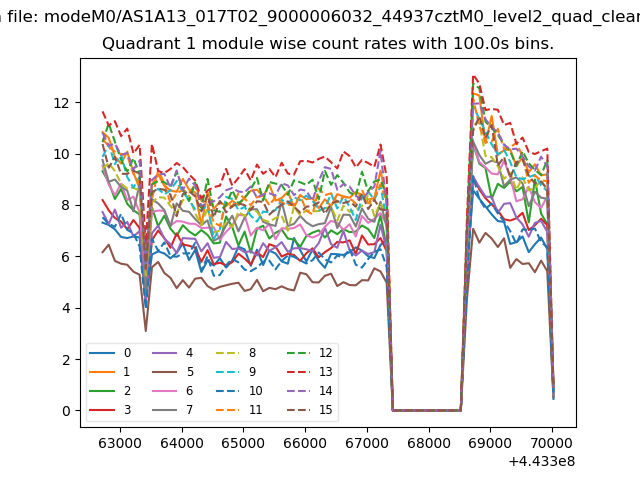
| Module-wise count rates for Quadrant A Data is divided into 100 sec bins |
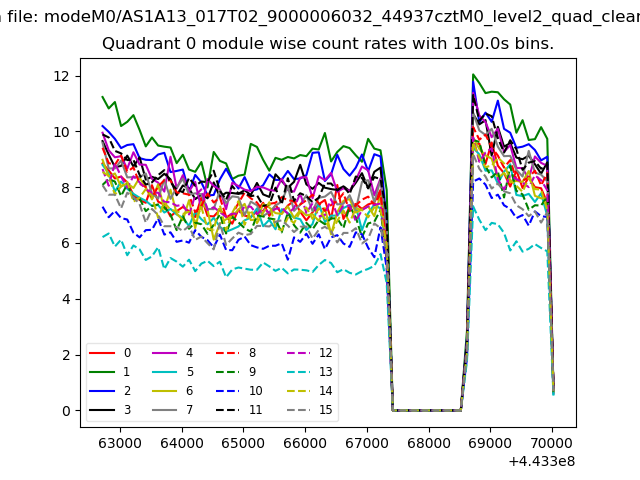 |
 |
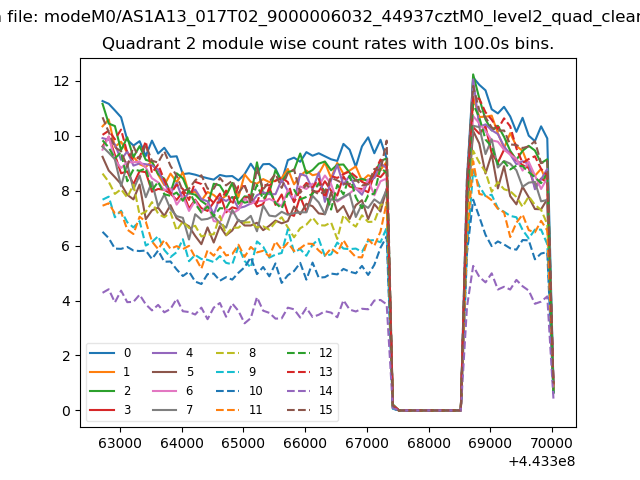
| Module-wise count rates for Quadrant B Data is divided into 100 sec bins |
 |
 |
| Module-wise count rates for Quadrant C Data is divided into 100 sec bins |
 |
 |
| Module-wise count rates for Quadrant D Data is divided into 100 sec bins |
 |
 |
| Parameter | Plot |
|---|---|
| CZT HV Monitor | 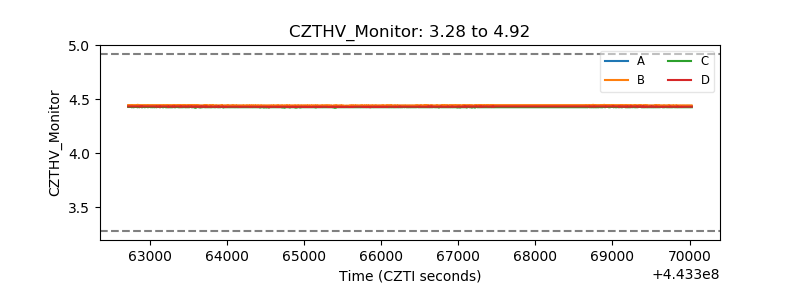 |
| D_VDD | 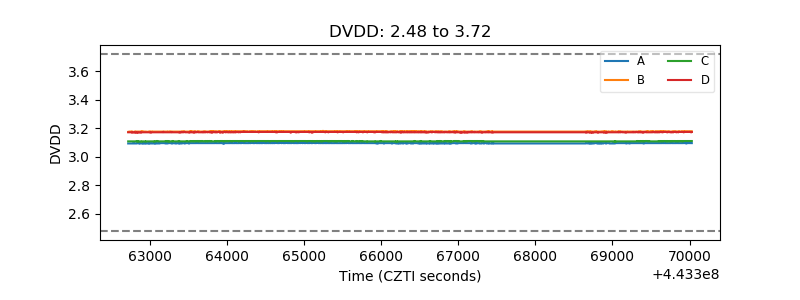 |
| Temperature 1 | 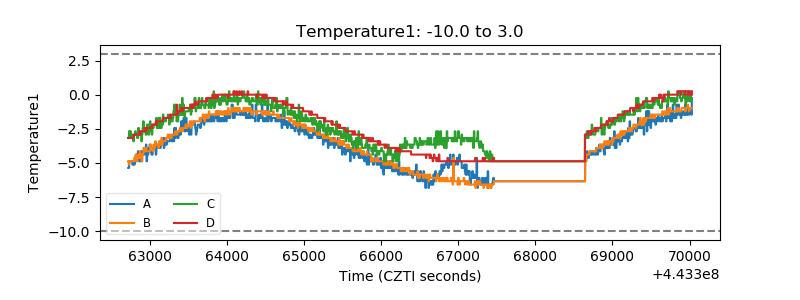 |
| Veto HV Monitor |  |
| Veto LLD | 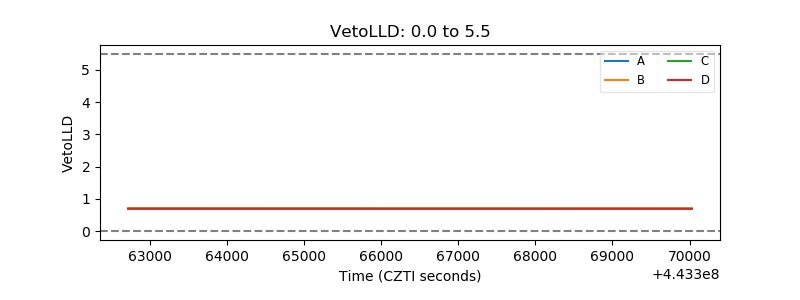 |
| Alpha Counter | 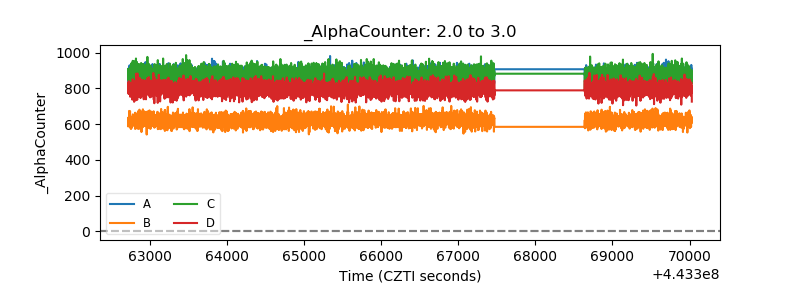 |
| _CPM_Rate | 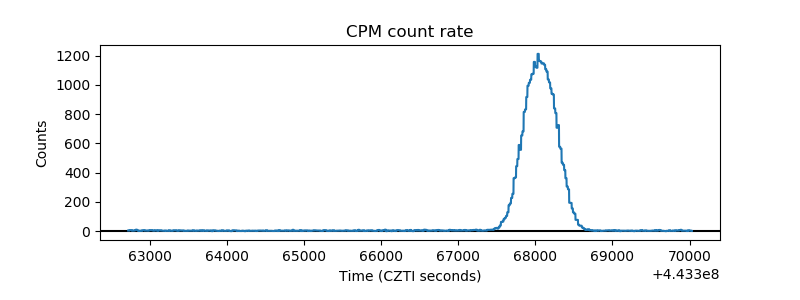 |
| CZT Counter | 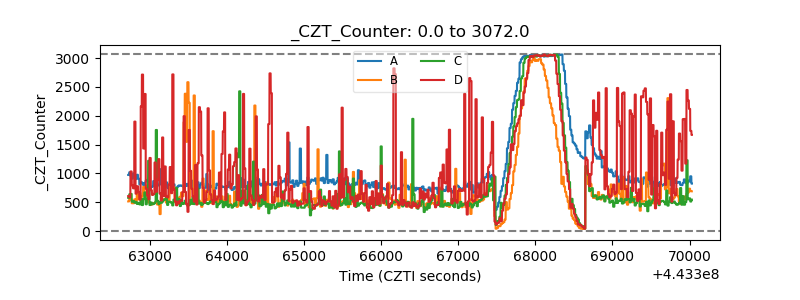 |
| +2.5 Volts monitor | 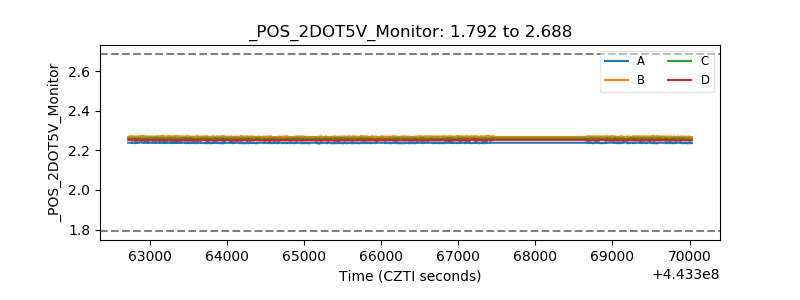 |
| +5 Volts monitor | 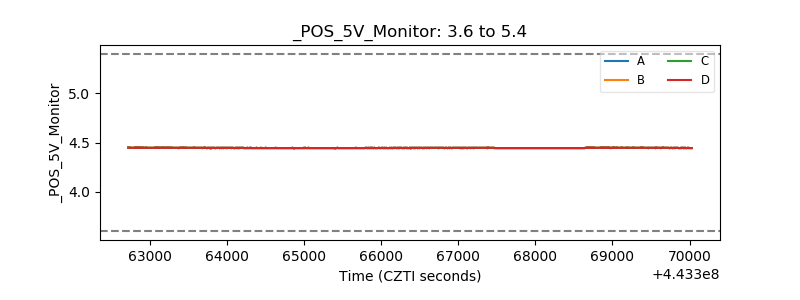 |
| _ROLL_ROT |  |
| _Roll_DEC | 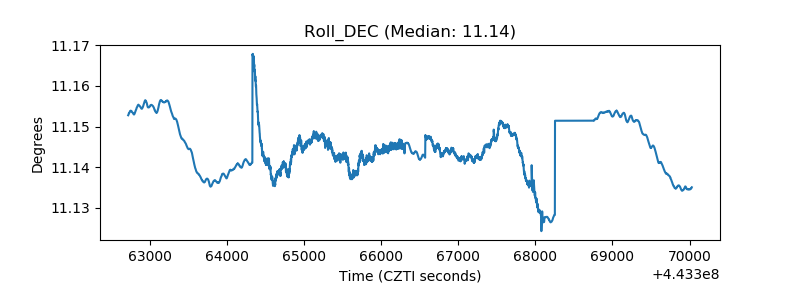 |
| _Roll_RA | 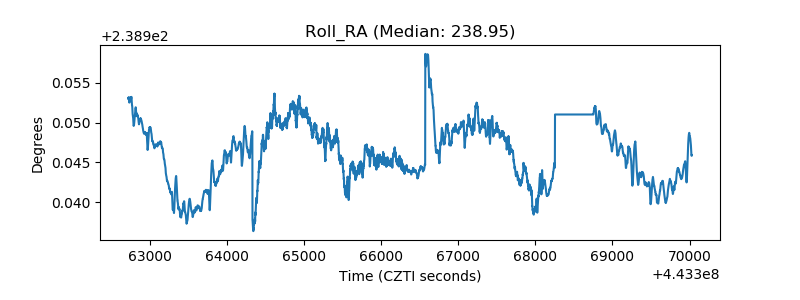 |
| Veto Counter | 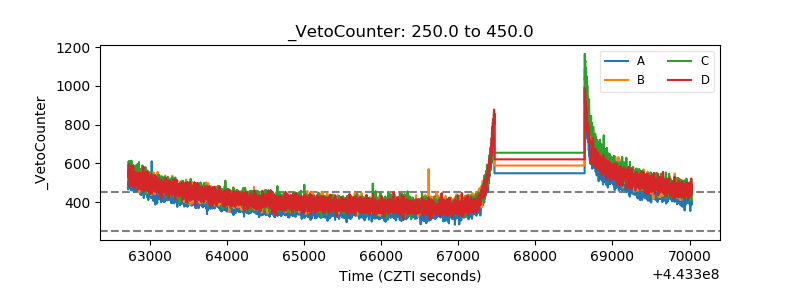 |