| Param | Original file | Final file |
|---|---|---|
| Filename | modeM0/AS1A13_017T02_9000006032_44938cztM0_level2.fits | modeM0/AS1A13_017T02_9000006032_44938cztM0_level2_quad_clean.evt |
| Size (bytes) | 608,376,960 | 106,280,640 |
| Size | 580.2 MB | 101.4 MB |
| Events in quadrant A | 5,410,431 | 771,155 |
| Events in quadrant B | 3,783,449 | 800,366 |
| Events in quadrant C | 3,133,518 | 776,989 |
| Events in quadrant D | 9,710,856 | 436,044 |
| Mode SS | |||
|---|---|---|---|
| Quadrant | BADHDUFLAG | Total packets | Discarded packets |
| A | 0 | 126 | 0 |
| B | 0 | 126 | 0 |
| C | 0 | 126 | 0 |
| D | 0 | 126 | 0 |
| Mode M0 | |||
|---|---|---|---|
| Quadrant | BADHDUFLAG | Total packets | Discarded packets |
| A | 0 | 20011 | 1 |
| B | 0 | 15281 | 1 |
| C | 0 | 13112 | 1 |
| D | 0 | 33165 | 4 |
| Mode M9 | |||
|---|---|---|---|
| Quadrant | BADHDUFLAG | Total packets | Discarded packets |
| A | 0 | 13 | 0 |
| B | 0 | 13 | 0 |
| C | 0 | 13 | 0 |
| D | 0 | 13 | 0 |
| Quadrant | Total seconds | Saturated seconds | Saturation percentage |
|---|---|---|---|
| A | 6215 | 152 | 2.445696% |
| B | 6216 | 119 | 1.914414% |
| C | 6216 | 49 | 0.788288% |
| D | 6215 | 2552 | 41.061947% |
Noise dominated data is calculated using 1-second bins in cleaned event files. If a bin has >2000 counts, and if more than 50% of those come from <1% of pixels, then it is considered to be noise-dominated and hence unusable.
| Quadrant | # 1 sec bins | Bins with >0 counts | Bins with >2000 counts | High rate bins dominated by noise | Noise dominated (total time) | Noise dominated (detector-on time) | Marked lightcurve |
|---|---|---|---|---|---|---|---|
| A | 7465 | 6216 | 1 | 1 | 0.01% | 0.02% | 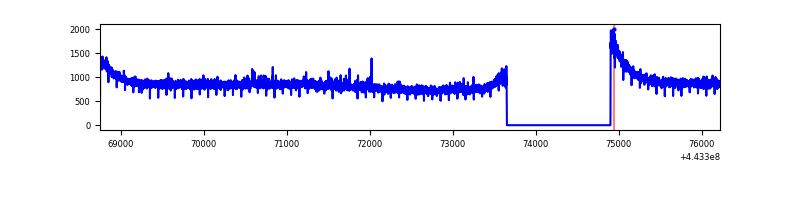 |
| B | 7466 | 6217 | 34 | 34 | 0.46% | 0.55% | 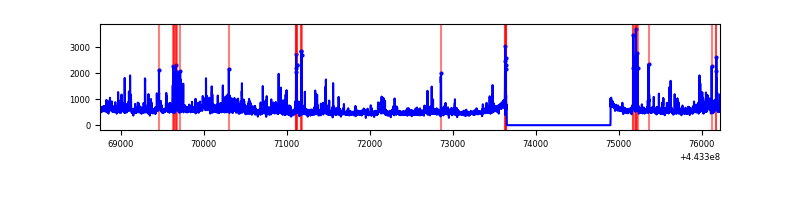 |
| C | 7466 | 6217 | 1 | 1 | 0.01% | 0.02% | 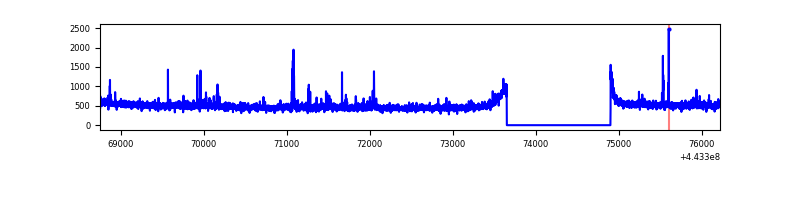 |
| D | 7465 | 6215 | 2130 | 2130 | 28.53% | 34.27% | 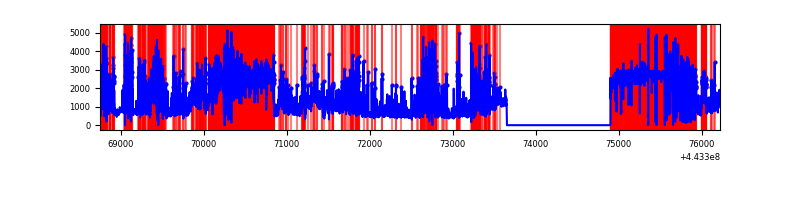 |
Top three noisy pixels from each quadrant. If the there are fewer than three noisy pixels in the level2.evt file, extra rows are filled as -1
| Pixel properties | Quadrant properties | ||||||
|---|---|---|---|---|---|---|---|
| Quadrant | DetID | PixID | Counts | Sigma | Mean | Median | Sigma |
| A | 10 | 83 | 2356646 | 14603.25 | 779 | 763 | 161.3 |
| A | 0 | 243 | 24610 | 147.82 | 779 | 763 | 161.3 |
| A | 7 | 3 | 9015 | 51.15 | 779 | 763 | 161.3 |
| B | 0 | 219 | 101505 | 668.26 | 772 | 748 | 150.8 |
| B | 5 | 172 | 100298 | 660.26 | 772 | 748 | 150.8 |
| B | 4 | 171 | 83988 | 552.08 | 772 | 748 | 150.8 |
| C | 3 | 233 | 50456 | 277.14 | 772 | 778 | 179.3 |
| C | 14 | 254 | 21986 | 118.31 | 772 | 778 | 179.3 |
| C | 15 | 208 | 16191 | 85.99 | 772 | 778 | 179.3 |
| D | 13 | 187 | 4583079 | 30637.2 | 587 | 570 | 149.6 |
| D | 13 | 249 | 1428773 | 9548.51 | 587 | 570 | 149.6 |
| D | 1 | 52 | 573545 | 3830.73 | 587 | 570 | 149.6 |
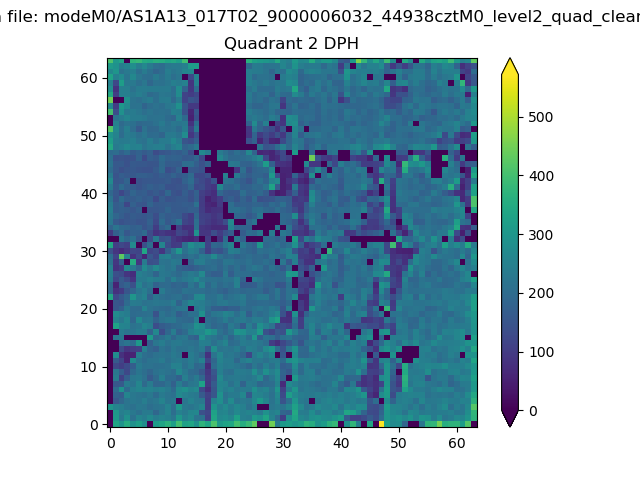
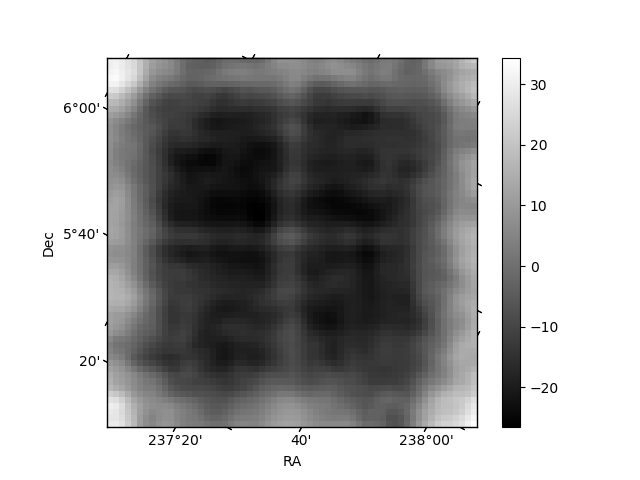
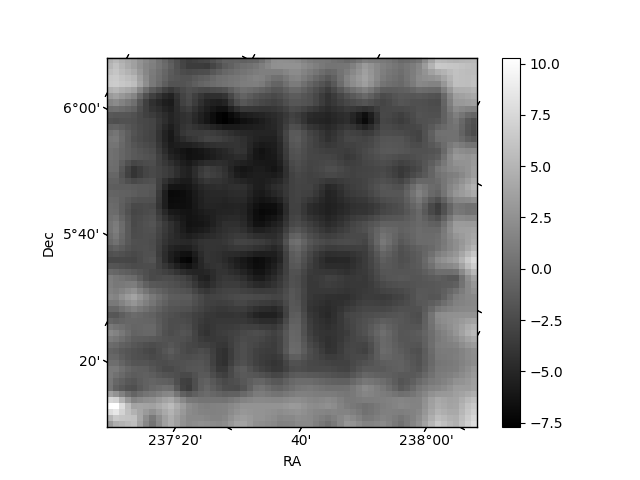
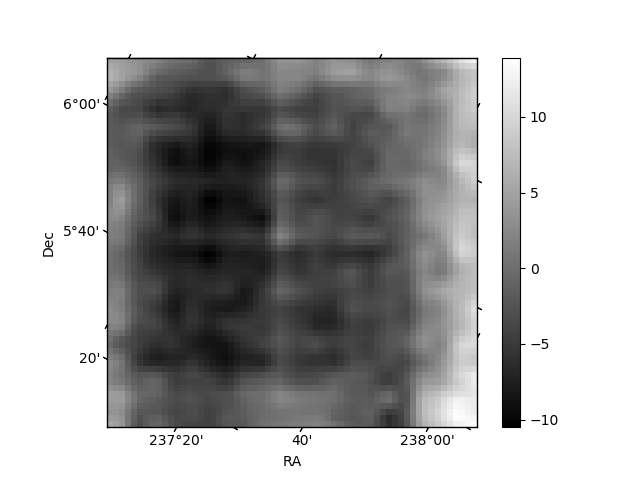
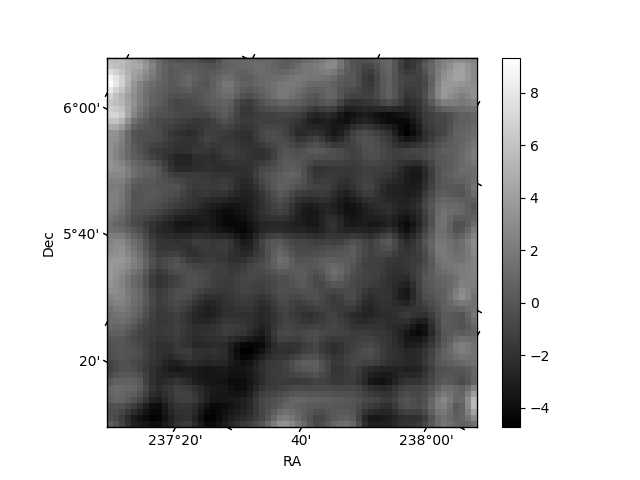
Histogram calculated using DETX and DETY for each event in the final _common_clean file
| Quadrant A | 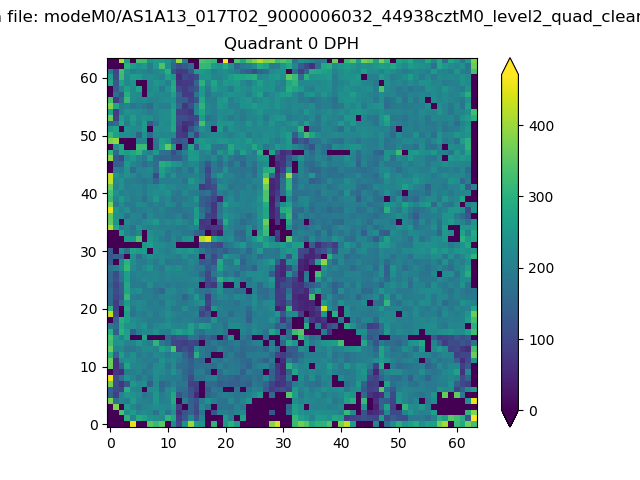 |
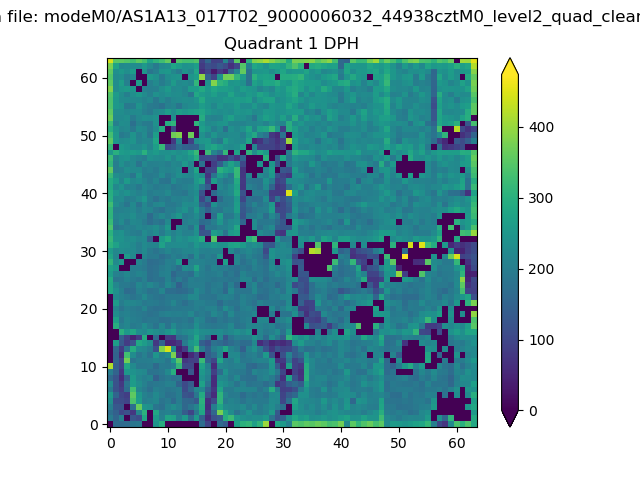 |
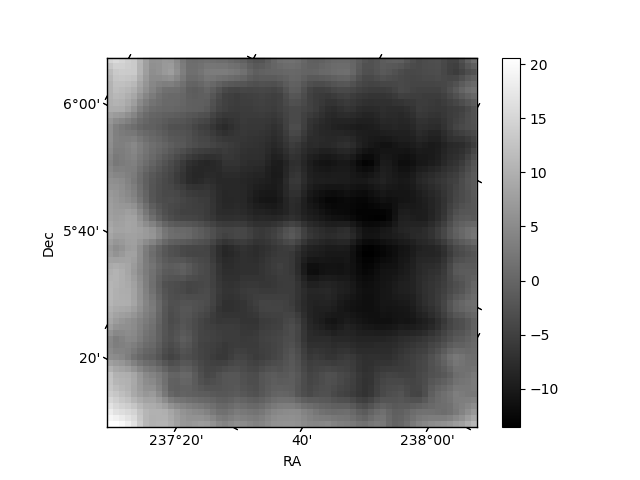
Quadrant B |
|---|---|---|---|
| Quadrant D | 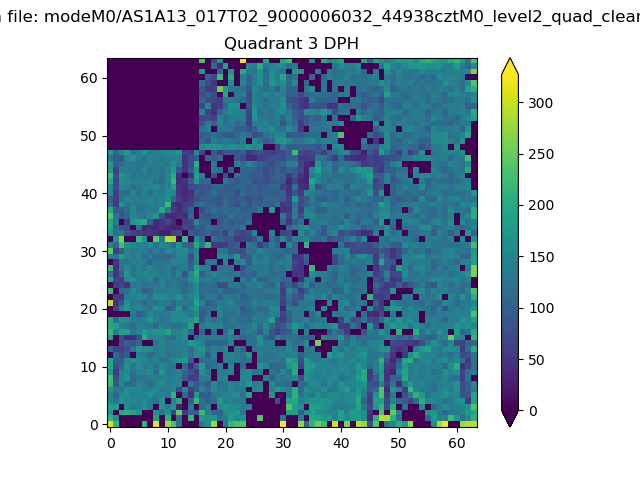 |
 |
Quadrant C |
| Plot type | Count rate plots | Images |
|---|---|---|
| Comparison with Poisson distribution Blue bars denote a histogram of data divided into 1 sec bins. Red curve is a Poisson curve with rate = median count rate of data. |
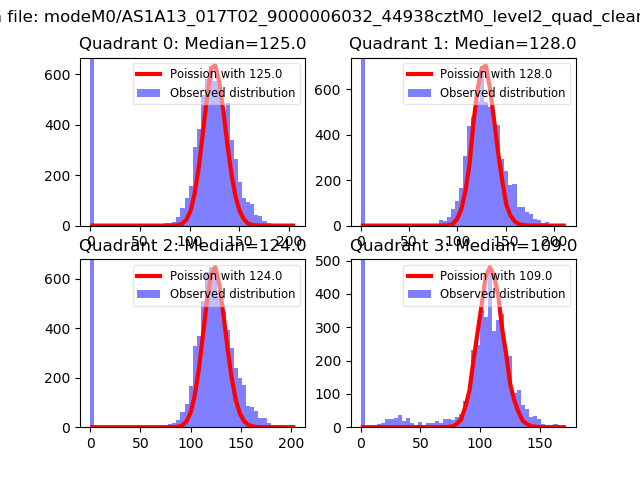 |
 |
| Quadrant-wise count rates Data is divided into 100 sec bins |
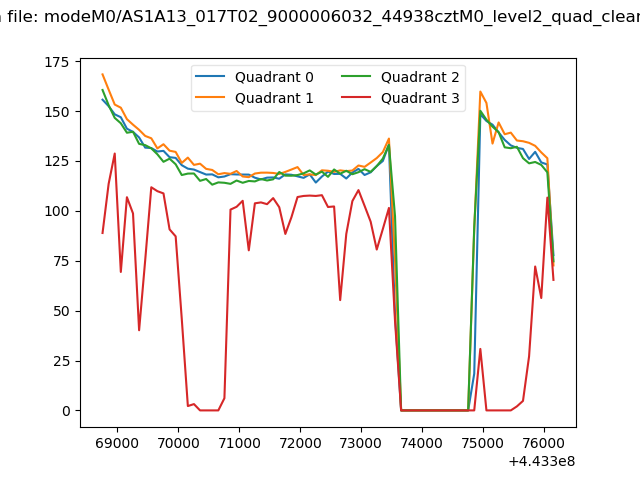 |
|
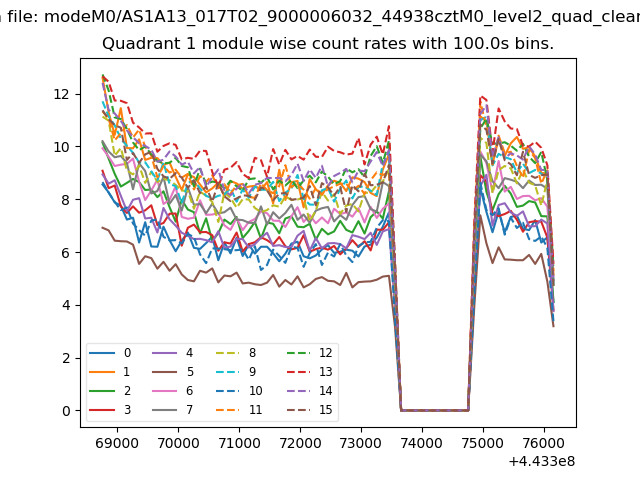
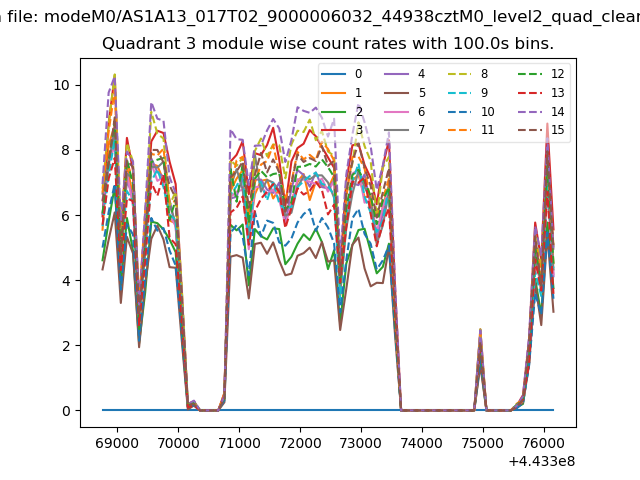
| Module-wise count rates for Quadrant A Data is divided into 100 sec bins |
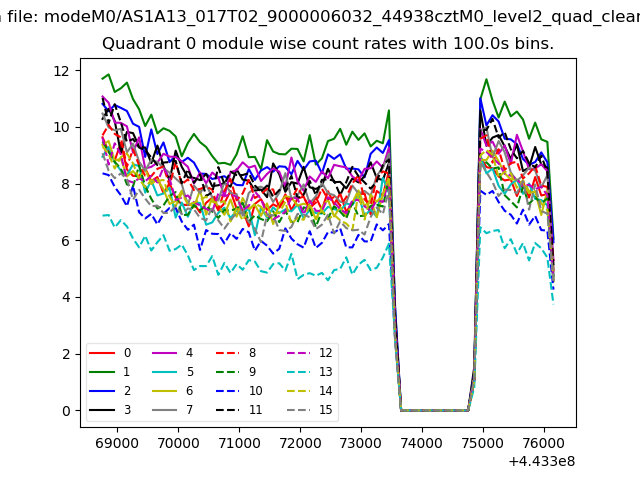 |
 |
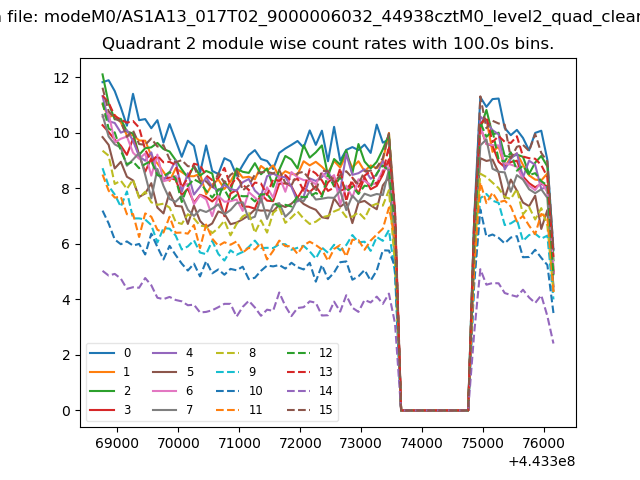
| Module-wise count rates for Quadrant B Data is divided into 100 sec bins |
 |
 |
| Module-wise count rates for Quadrant C Data is divided into 100 sec bins |
 |
 |
| Module-wise count rates for Quadrant D Data is divided into 100 sec bins |
 |
 |
| Parameter | Plot |
|---|---|
| CZT HV Monitor | 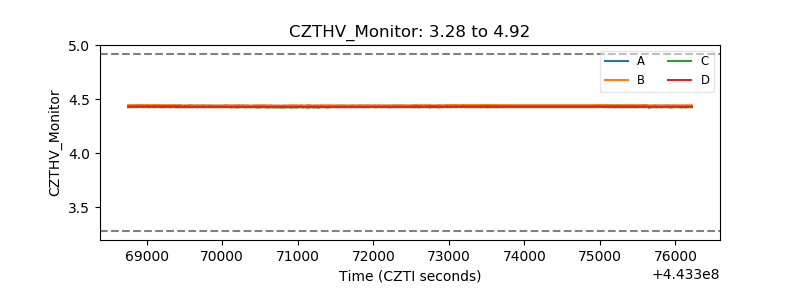 |
| D_VDD | 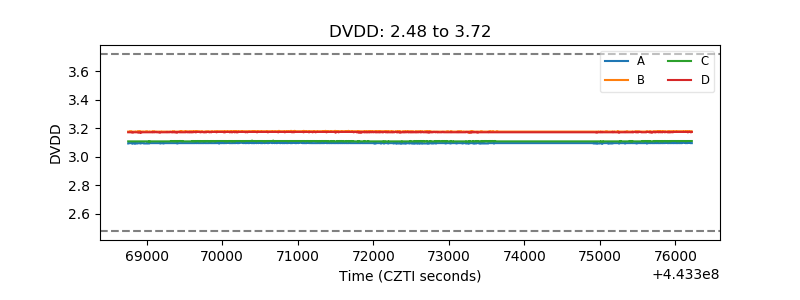 |
| Temperature 1 | 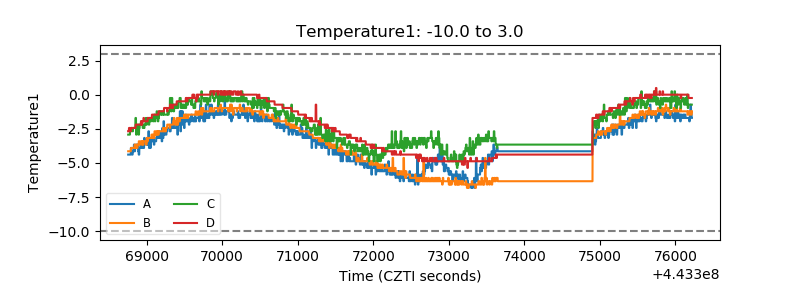 |
| Veto HV Monitor | 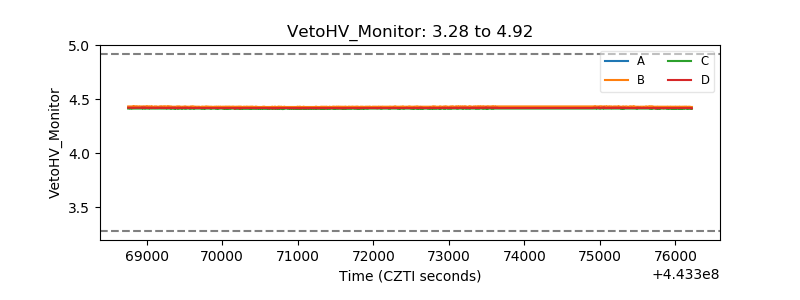 |
| Veto LLD | 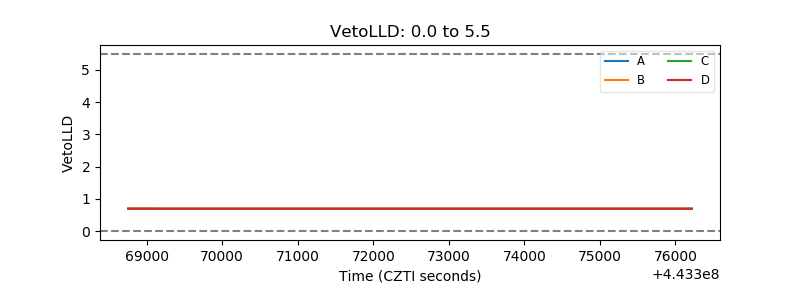 |
| Alpha Counter | 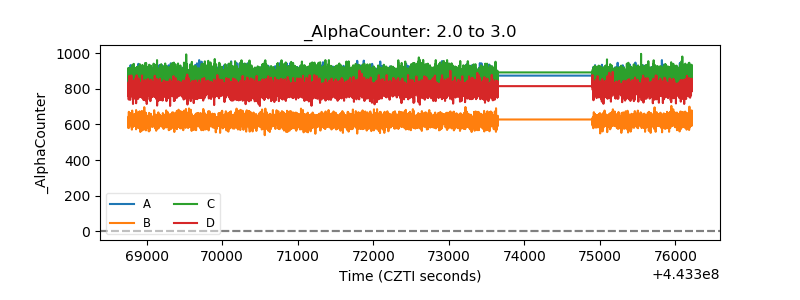 |
| _CPM_Rate | 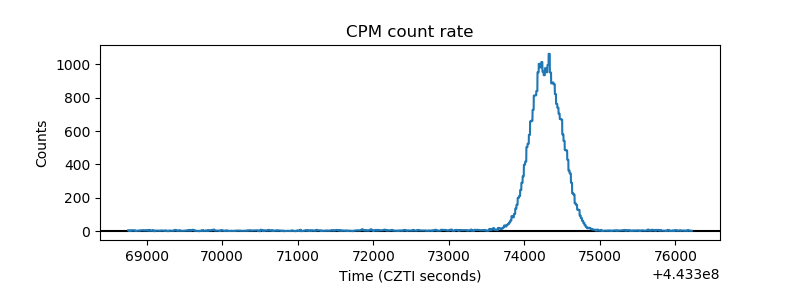 |
| CZT Counter | 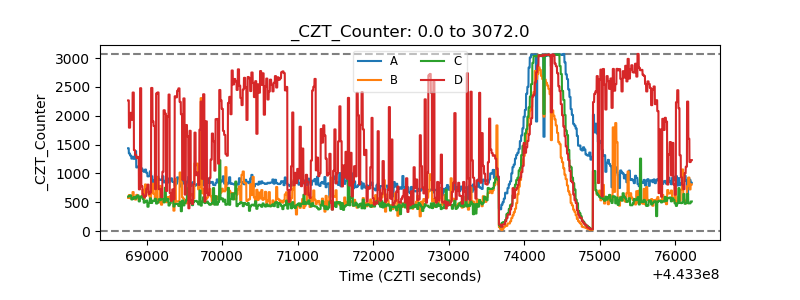 |
| +2.5 Volts monitor | 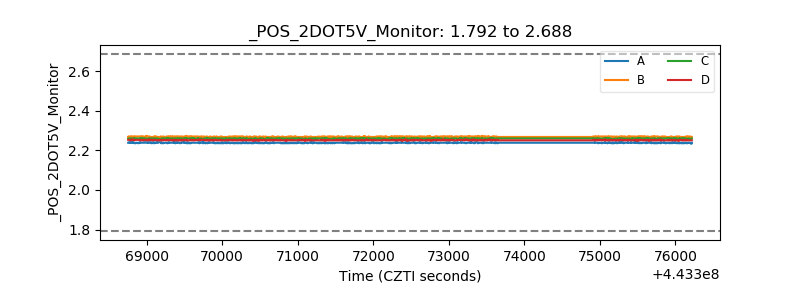 |
| +5 Volts monitor | 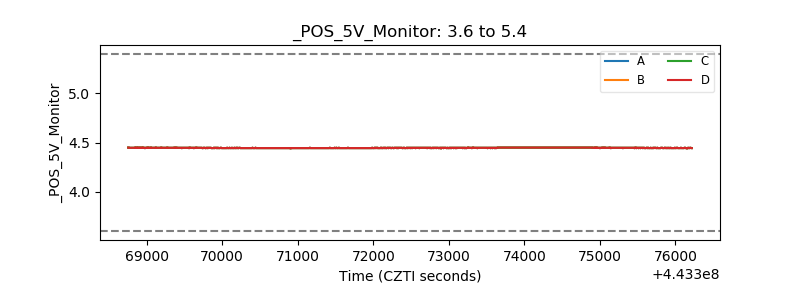 |
| _ROLL_ROT |  |
| _Roll_DEC | 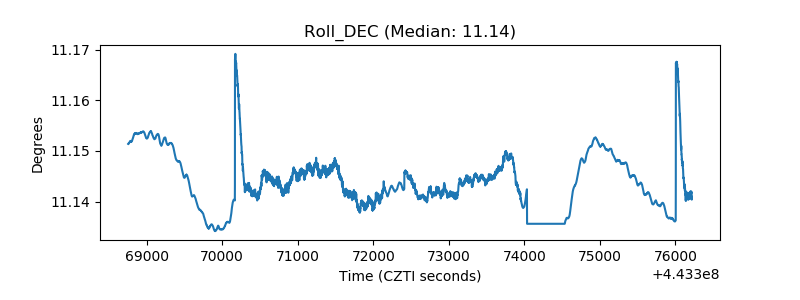 |
| _Roll_RA | 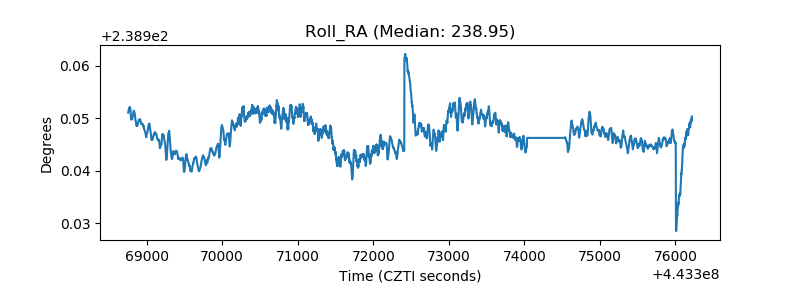 |
| Veto Counter |  |