| Param | Original file | Final file |
|---|---|---|
| Filename | modeM0/AS1A13_017T02_9000006032_44940cztM0_level2.fits | modeM0/AS1A13_017T02_9000006032_44940cztM0_level2_quad_clean.evt |
| Size (bytes) | 732,928,320 | 105,312,960 |
| Size | 699.0 MB | 100.4 MB |
| Events in quadrant A | 6,029,946 | 771,908 |
| Events in quadrant B | 4,234,955 | 799,033 |
| Events in quadrant C | 3,451,748 | 789,115 |
| Events in quadrant D | 12,875,386 | 344,614 |
| Mode SS | |||
|---|---|---|---|
| Quadrant | BADHDUFLAG | Total packets | Discarded packets |
| A | 0 | 142 | 0 |
| B | 0 | 142 | 0 |
| C | 0 | 142 | 0 |
| D | 0 | 142 | 0 |
| Mode M0 | |||
|---|---|---|---|
| Quadrant | BADHDUFLAG | Total packets | Discarded packets |
| A | 0 | 22882 | 2 |
| B | 0 | 17232 | 2 |
| C | 0 | 14901 | 2 |
| D | 0 | 43088 | 2 |
| Mode M9 | |||
|---|---|---|---|
| Quadrant | BADHDUFLAG | Total packets | Discarded packets |
| A | 0 | 10 | 0 |
| B | 0 | 10 | 0 |
| C | 0 | 11 | 0 |
| D | 0 | 11 | 0 |
| Quadrant | Total seconds | Saturated seconds | Saturation percentage |
|---|---|---|---|
| A | 6947 | 310 | 4.462358% |
| B | 6947 | 302 | 4.347200% |
| C | 6947 | 115 | 1.655391% |
| D | 6946 | 3824 | 55.053268% |
Noise dominated data is calculated using 1-second bins in cleaned event files. If a bin has >2000 counts, and if more than 50% of those come from <1% of pixels, then it is considered to be noise-dominated and hence unusable.
| Quadrant | # 1 sec bins | Bins with >0 counts | Bins with >2000 counts | High rate bins dominated by noise | Noise dominated (total time) | Noise dominated (detector-on time) | Marked lightcurve |
|---|---|---|---|---|---|---|---|
| A | 7862 | 6948 | 3 | 3 | 0.04% | 0.04% | 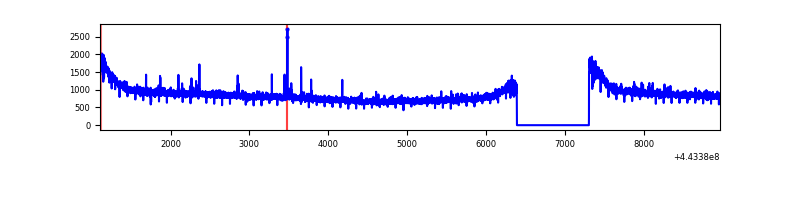 |
| B | 7862 | 6948 | 105 | 105 | 1.34% | 1.51% | 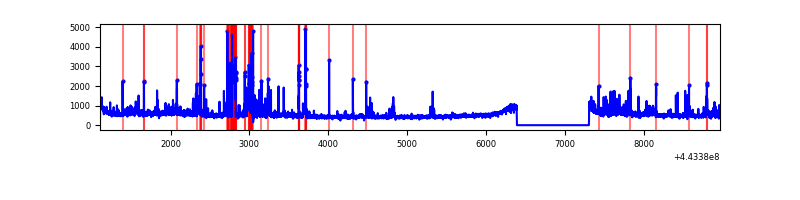 |
| C | 7862 | 6948 | 8 | 8 | 0.10% | 0.12% | 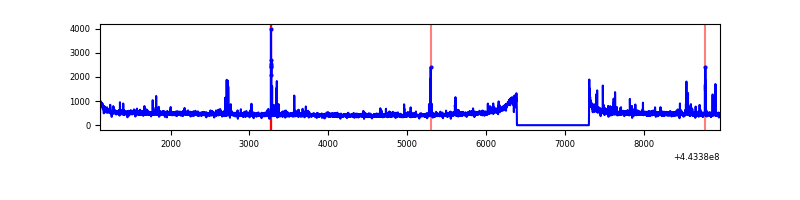 |
| D | 7861 | 6946 | 3348 | 3348 | 42.59% | 48.20% | 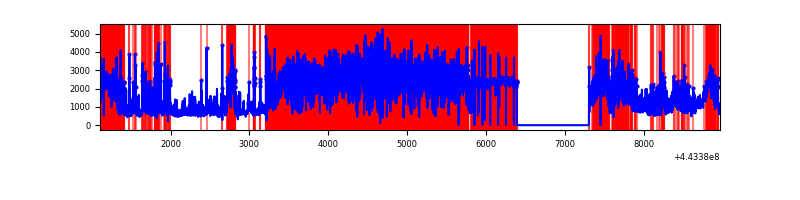 |
Top three noisy pixels from each quadrant. If the there are fewer than three noisy pixels in the level2.evt file, extra rows are filled as -1
| Pixel properties | Quadrant properties | ||||||
|---|---|---|---|---|---|---|---|
| Quadrant | DetID | PixID | Counts | Sigma | Mean | Median | Sigma |
| A | 10 | 83 | 2701934 | 15420.76 | 839 | 821 | 175.2 |
| A | 0 | 243 | 42043 | 235.34 | 839 | 821 | 175.2 |
| A | 13 | 248 | 15589 | 84.31 | 839 | 821 | 175.2 |
| B | 5 | 255 | 296316 | 1783.45 | 834 | 808 | 165.7 |
| B | 4 | 171 | 181487 | 1090.43 | 834 | 808 | 165.7 |
| B | 0 | 168 | 102563 | 614.11 | 834 | 808 | 165.7 |
| C | 3 | 233 | 50015 | 248.96 | 837 | 843 | 197.5 |
| C | 14 | 254 | 48535 | 241.46 | 837 | 843 | 197.5 |
| C | 15 | 208 | 41682 | 206.77 | 837 | 843 | 197.5 |
| D | 13 | 187 | 6775352 | 45991.71 | 567 | 549 | 147.3 |
| D | 13 | 249 | 775832 | 5263.12 | 567 | 549 | 147.3 |
| D | 5 | 171 | 769308 | 5218.83 | 567 | 549 | 147.3 |
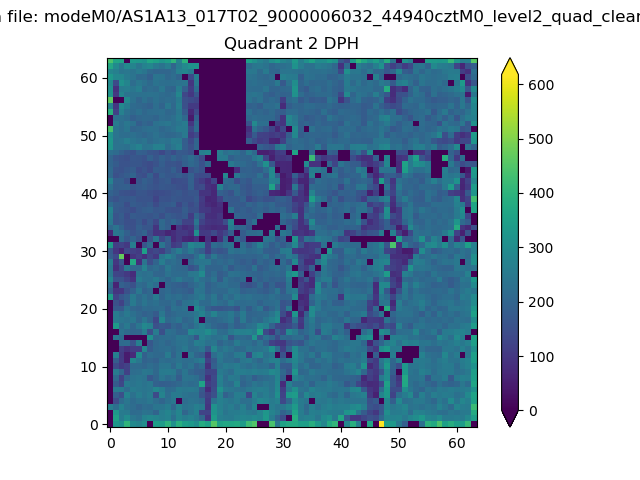
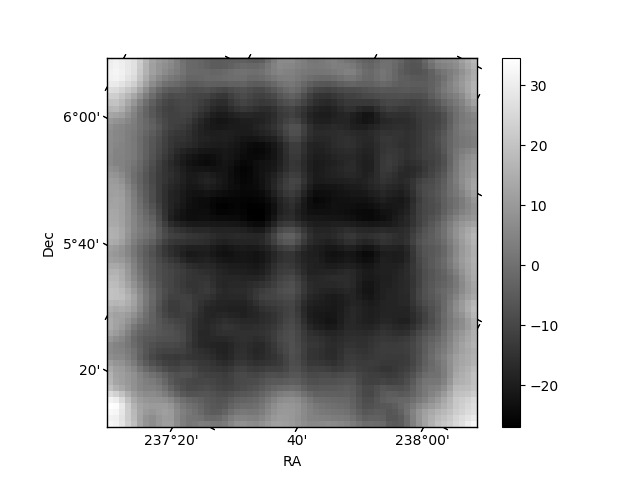
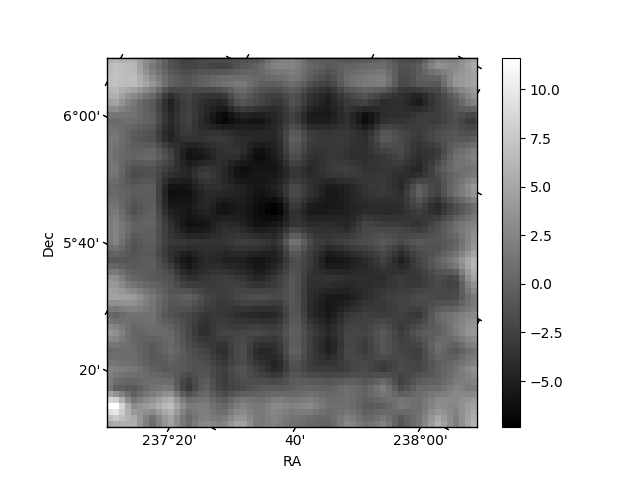
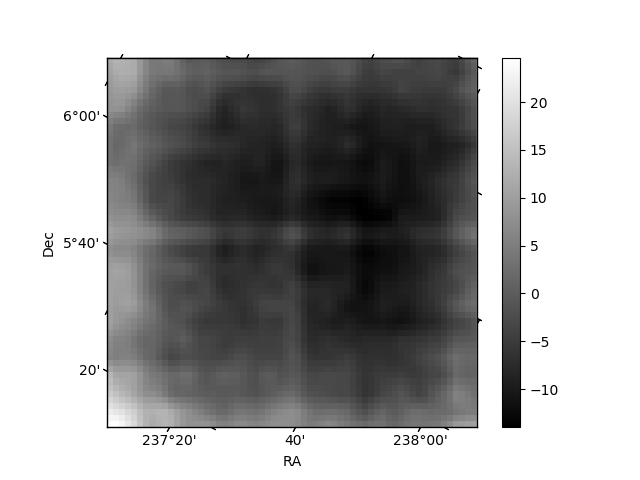
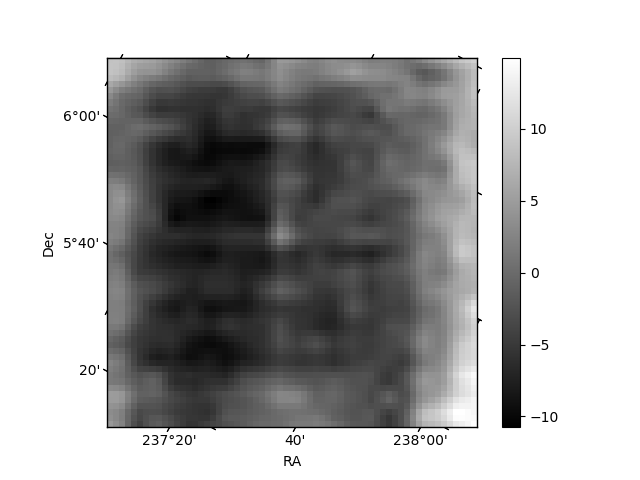
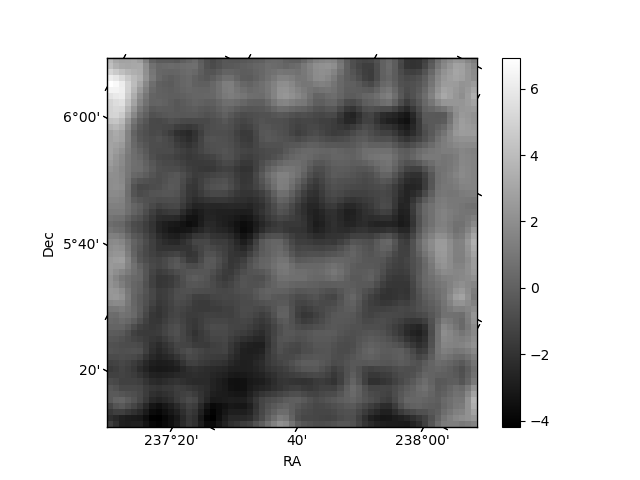
Histogram calculated using DETX and DETY for each event in the final _common_clean file
| Quadrant A | 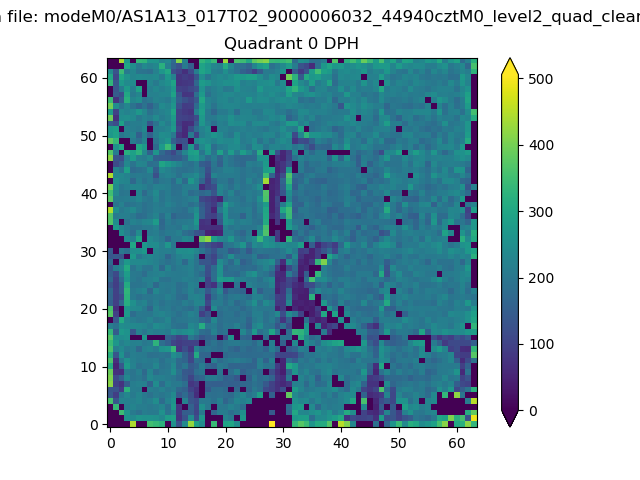 |
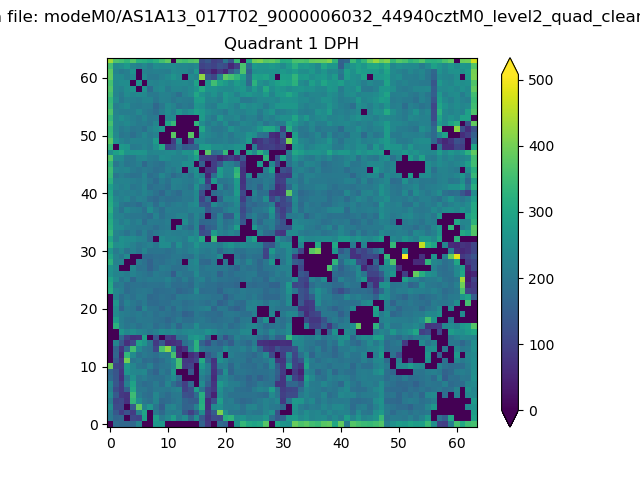 |
Quadrant B |
|---|---|---|---|
| Quadrant D | 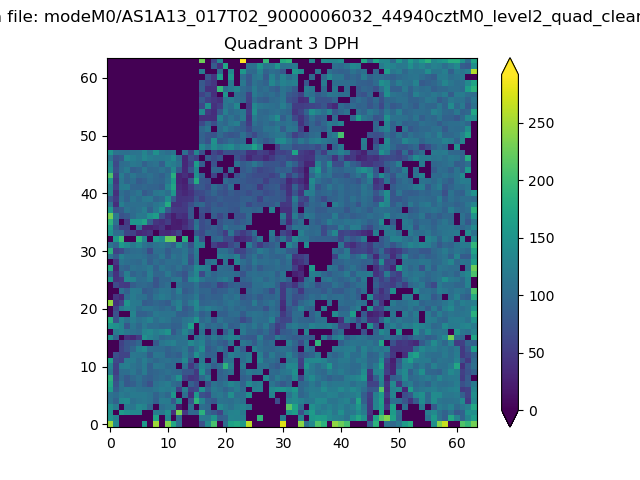 |
 |
Quadrant C |
| Plot type | Count rate plots | Images |
|---|---|---|
| Comparison with Poisson distribution Blue bars denote a histogram of data divided into 1 sec bins. Red curve is a Poisson curve with rate = median count rate of data. |
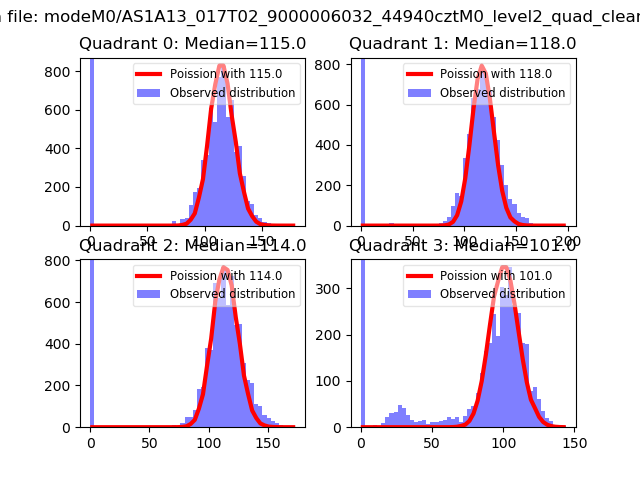 |
 |
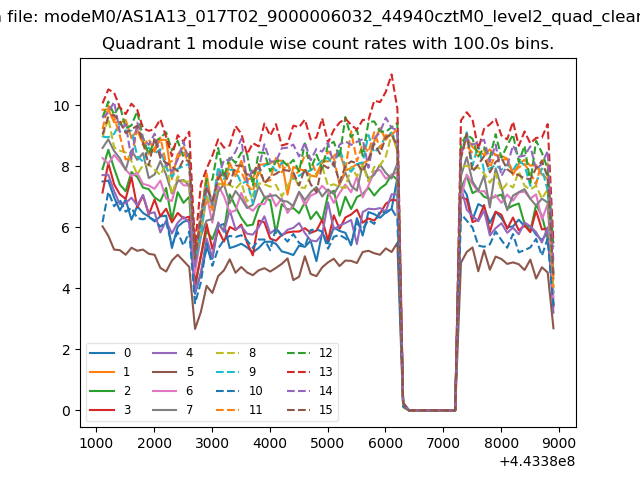
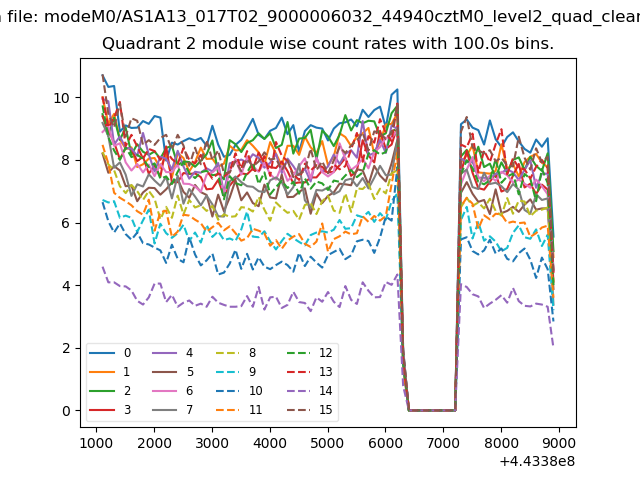
| Quadrant-wise count rates Data is divided into 100 sec bins |
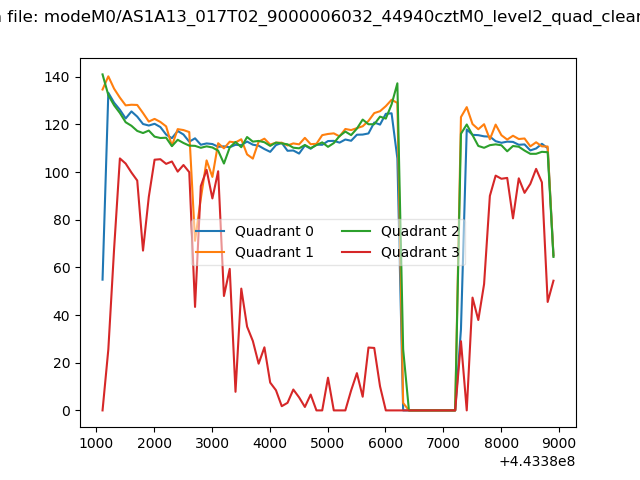 |
|
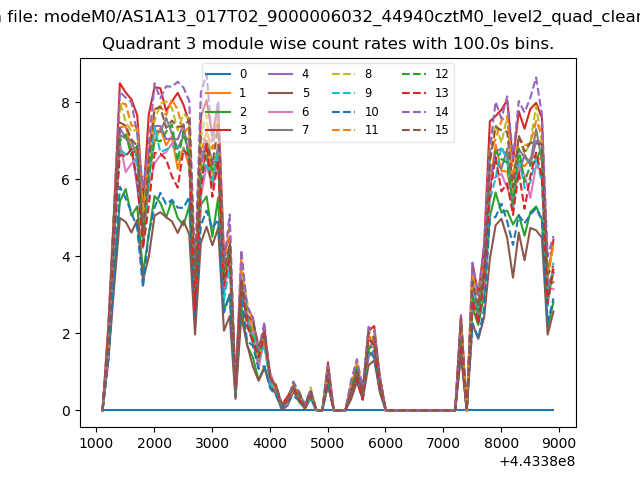
| Module-wise count rates for Quadrant A Data is divided into 100 sec bins |
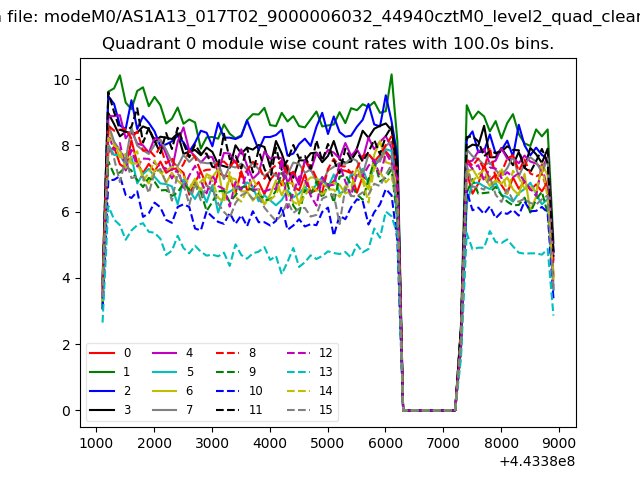 |
 |
| Module-wise count rates for Quadrant B Data is divided into 100 sec bins |
 |
 |
| Module-wise count rates for Quadrant C Data is divided into 100 sec bins |
 |
 |
| Module-wise count rates for Quadrant D Data is divided into 100 sec bins |
 |
 |
| Parameter | Plot |
|---|---|
| CZT HV Monitor |  |
| D_VDD | 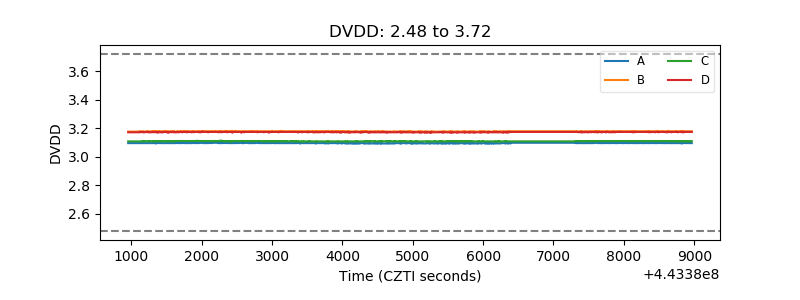 |
| Temperature 1 | 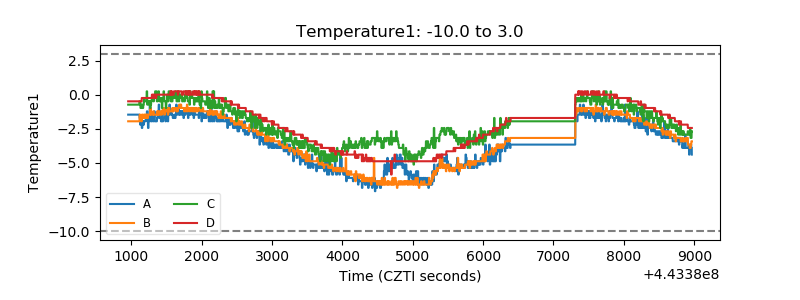 |
| Veto HV Monitor | 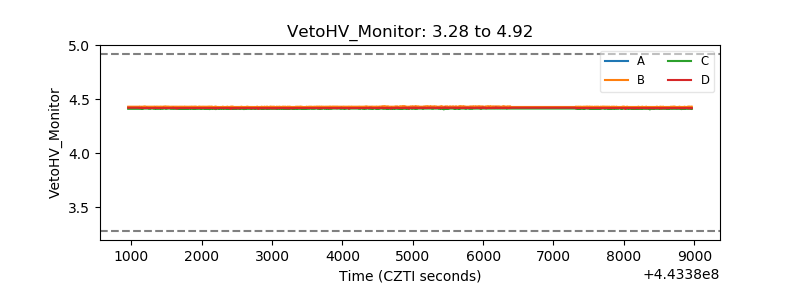 |
| Veto LLD | 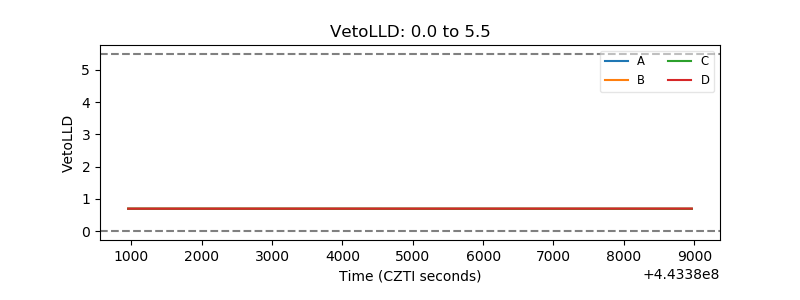 |
| Alpha Counter | 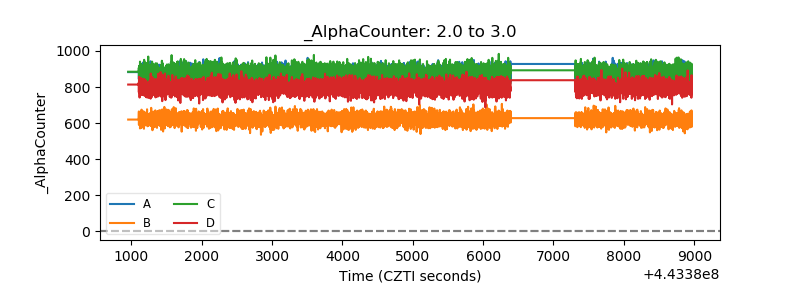 |
| _CPM_Rate | 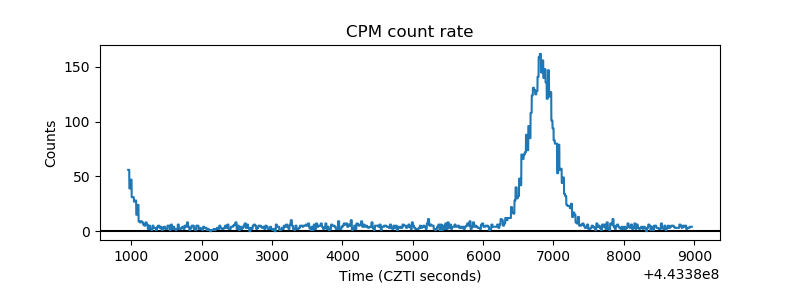 |
| CZT Counter | 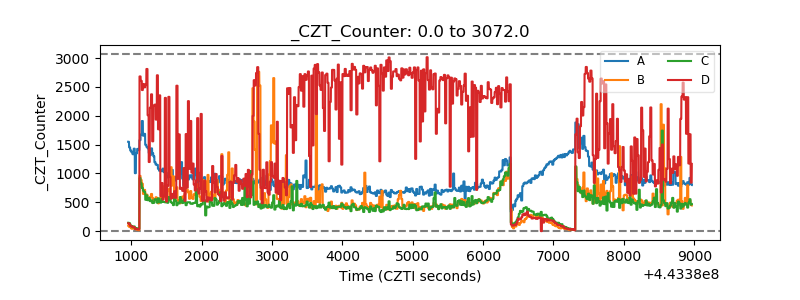 |
| +2.5 Volts monitor | 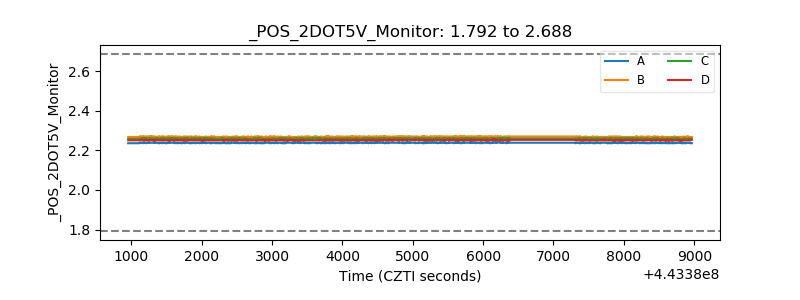 |
| +5 Volts monitor | 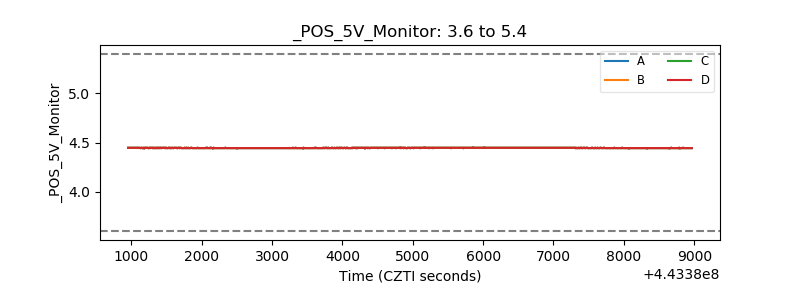 |
| _ROLL_ROT | 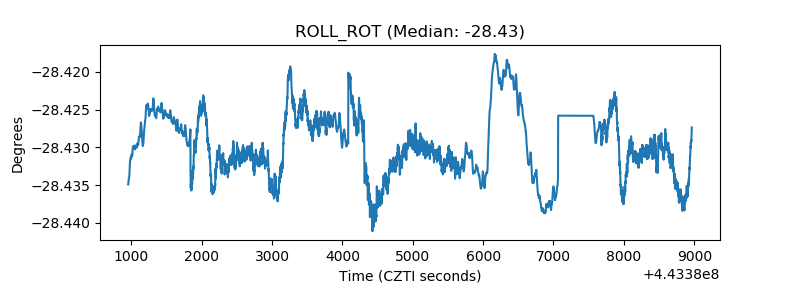 |
| _Roll_DEC | 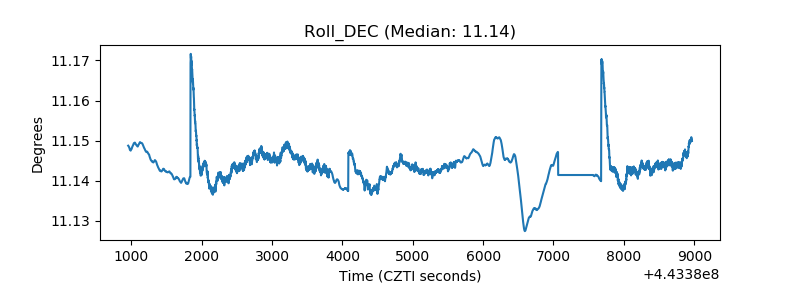 |
| _Roll_RA | 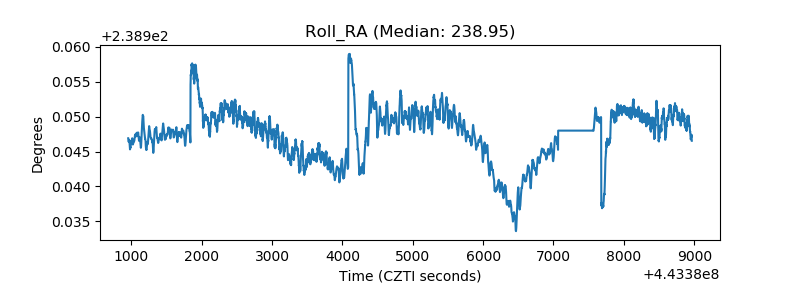 |
| Veto Counter |  |