| Param | Original file | Final file |
|---|---|---|
| Filename | modeM0/AS1A13_017T02_9000006032_44941cztM0_level2.fits | modeM0/AS1A13_017T02_9000006032_44941cztM0_level2_quad_clean.evt |
| Size (bytes) | 652,504,320 | 109,860,480 |
| Size | 622.3 MB | 104.8 MB |
| Events in quadrant A | 5,844,634 | 762,374 |
| Events in quadrant B | 4,013,715 | 785,727 |
| Events in quadrant C | 3,496,422 | 776,714 |
| Events in quadrant D | 10,249,492 | 507,510 |
| Mode SS | |||
|---|---|---|---|
| Quadrant | BADHDUFLAG | Total packets | Discarded packets |
| A | 0 | 144 | 0 |
| B | 0 | 144 | 0 |
| C | 0 | 144 | 0 |
| D | 0 | 144 | 0 |
| Mode M0 | |||
|---|---|---|---|
| Quadrant | BADHDUFLAG | Total packets | Discarded packets |
| A | 0 | 22566 | 1 |
| B | 0 | 16679 | 1 |
| C | 0 | 15321 | 1 |
| D | 0 | 35356 | 9 |
| Mode M9 | |||
|---|---|---|---|
| Quadrant | BADHDUFLAG | Total packets | Discarded packets |
| A | 0 | 4 | 0 |
| B | 0 | 4 | 0 |
| C | 0 | 4 | 0 |
| D | 0 | 4 | 0 |
| Quadrant | Total seconds | Saturated seconds | Saturation percentage |
|---|---|---|---|
| A | 7091 | 235 | 3.314060% |
| B | 7092 | 261 | 3.680203% |
| C | 7092 | 109 | 1.536943% |
| D | 7091 | 2295 | 32.364970% |
Noise dominated data is calculated using 1-second bins in cleaned event files. If a bin has >2000 counts, and if more than 50% of those come from <1% of pixels, then it is considered to be noise-dominated and hence unusable.
| Quadrant | # 1 sec bins | Bins with >0 counts | Bins with >2000 counts | High rate bins dominated by noise | Noise dominated (total time) | Noise dominated (detector-on time) | Marked lightcurve |
|---|---|---|---|---|---|---|---|
| A | 7546 | 7092 | 4 | 4 | 0.05% | 0.06% |  |
| B | 7547 | 7093 | 66 | 66 | 0.87% | 0.93% |  |
| C | 7547 | 7093 | 19 | 19 | 0.25% | 0.27% |  |
| D | 7545 | 7091 | 1867 | 1867 | 24.74% | 26.33% |  |
Top three noisy pixels from each quadrant. If the there are fewer than three noisy pixels in the level2.evt file, extra rows are filled as -1
| Pixel properties | Quadrant properties | ||||||
|---|---|---|---|---|---|---|---|
| Quadrant | DetID | PixID | Counts | Sigma | Mean | Median | Sigma |
| A | 10 | 83 | 2542876 | 14670.81 | 828 | 809 | 173.3 |
| A | 13 | 248 | 59016 | 335.92 | 828 | 809 | 173.3 |
| A | 0 | 243 | 24226 | 135.14 | 828 | 809 | 173.3 |
| B | 5 | 255 | 253073 | 1542.94 | 826 | 802 | 163.5 |
| B | 0 | 168 | 101062 | 613.21 | 826 | 802 | 163.5 |
| B | 0 | 219 | 97607 | 592.08 | 826 | 802 | 163.5 |
| C | 12 | 2 | 125005 | 639.14 | 822 | 829 | 194.3 |
| C | 14 | 254 | 45909 | 232.03 | 822 | 829 | 194.3 |
| C | 1 | 3 | 33158 | 166.4 | 822 | 829 | 194.3 |
| D | 13 | 187 | 2428906 | 14021.75 | 680 | 660 | 173.2 |
| D | 5 | 171 | 1218935 | 7034.85 | 680 | 660 | 173.2 |
| D | 1 | 52 | 1165365 | 6725.51 | 680 | 660 | 173.2 |
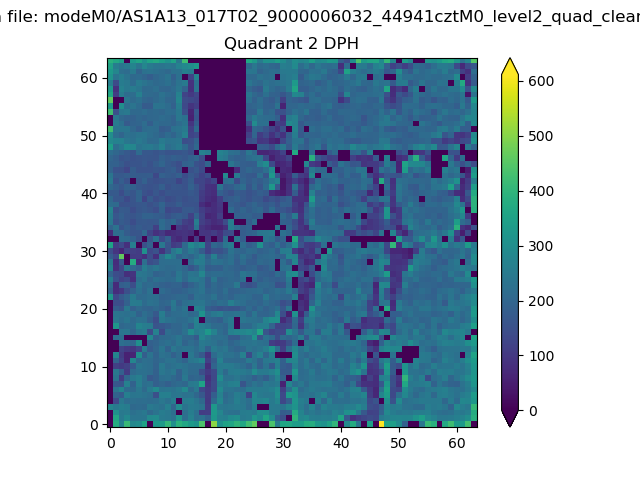
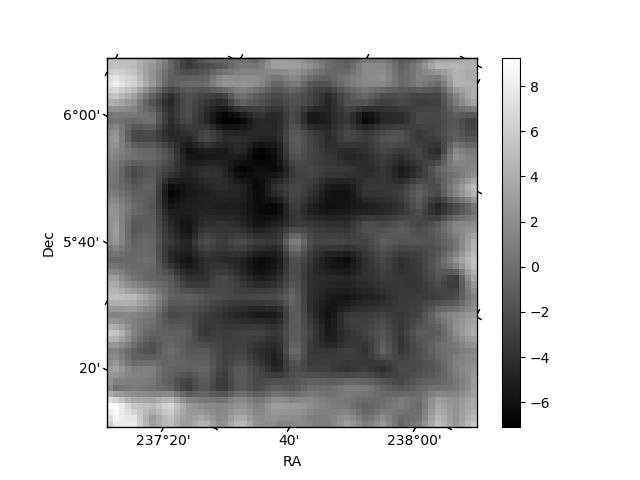
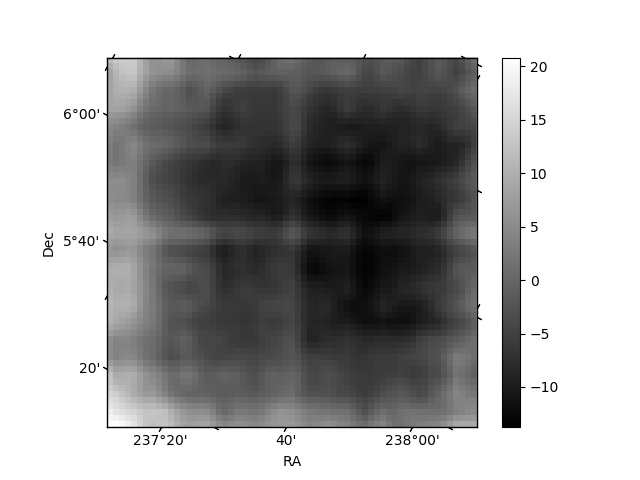
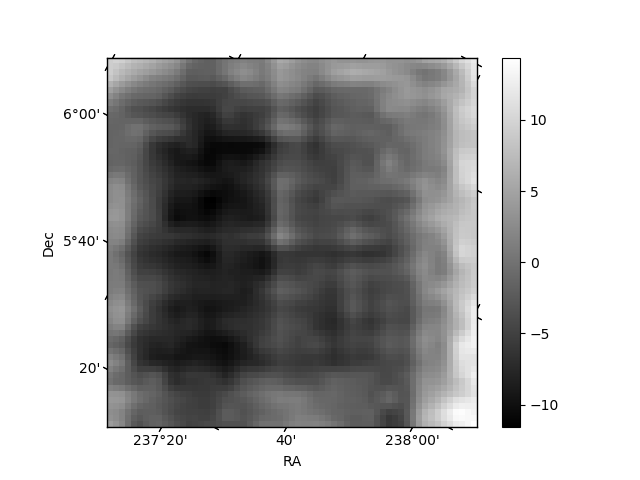
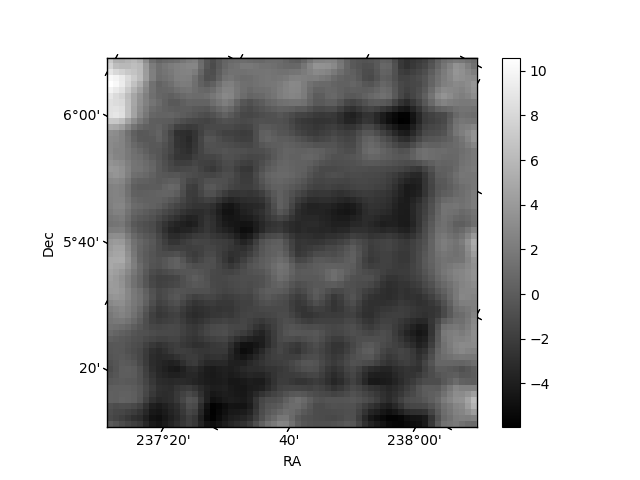
Histogram calculated using DETX and DETY for each event in the final _common_clean file
| Quadrant A | 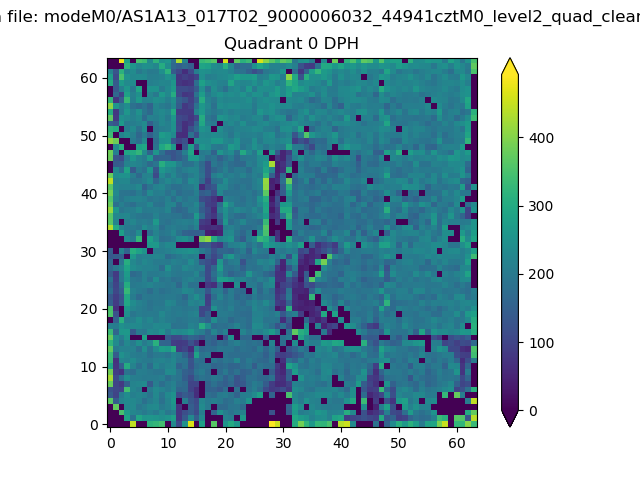 |
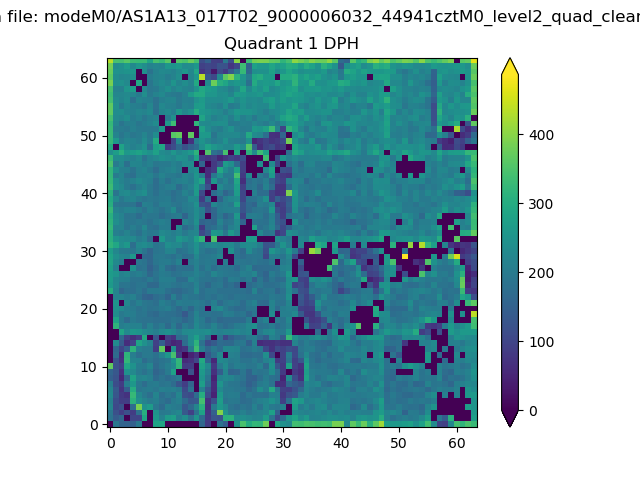 |
Quadrant B |
|---|---|---|---|
| Quadrant D | 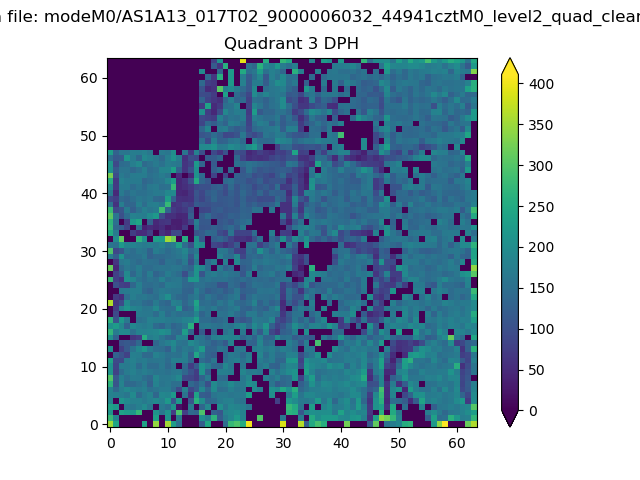 |
 |
Quadrant C |
| Plot type | Count rate plots | Images |
|---|---|---|
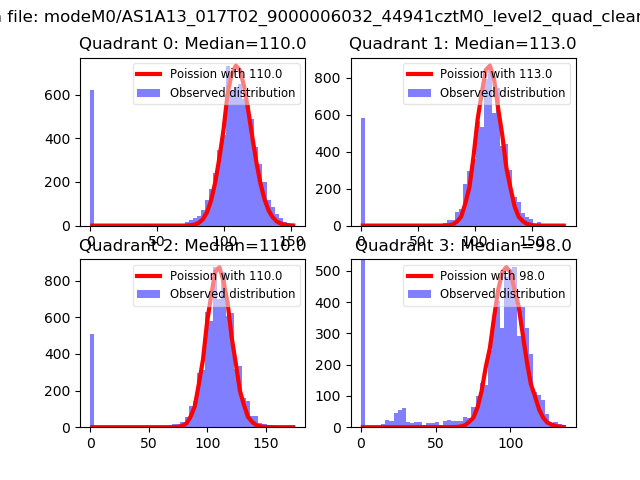
| Comparison with Poisson distribution Blue bars denote a histogram of data divided into 1 sec bins. Red curve is a Poisson curve with rate = median count rate of data. |
 |
 |
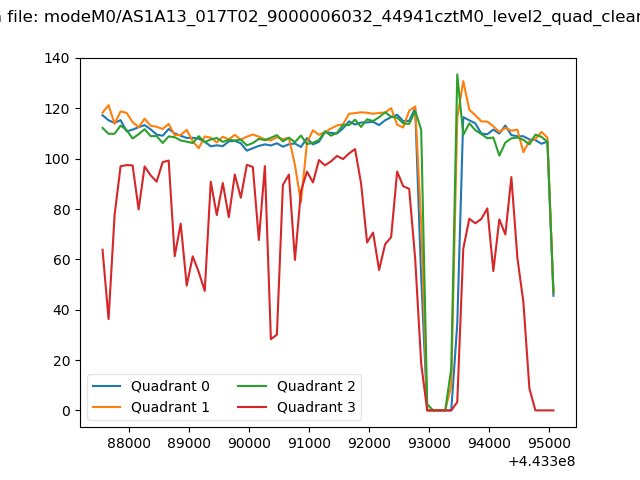
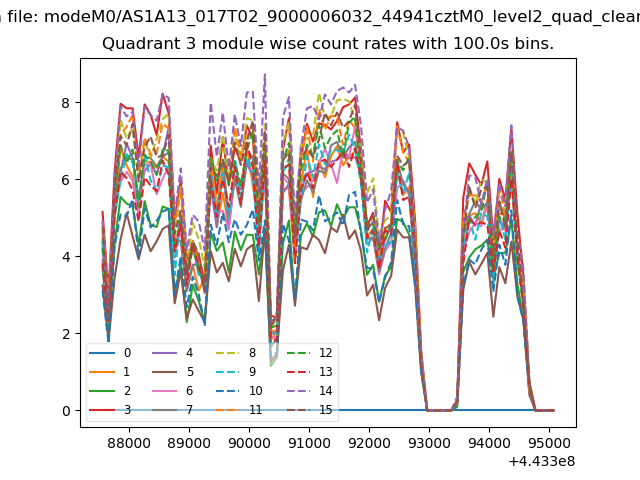
| Quadrant-wise count rates Data is divided into 100 sec bins |
 |
|
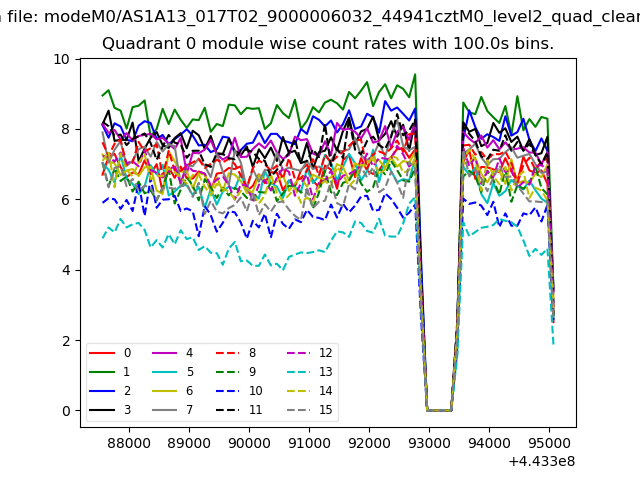
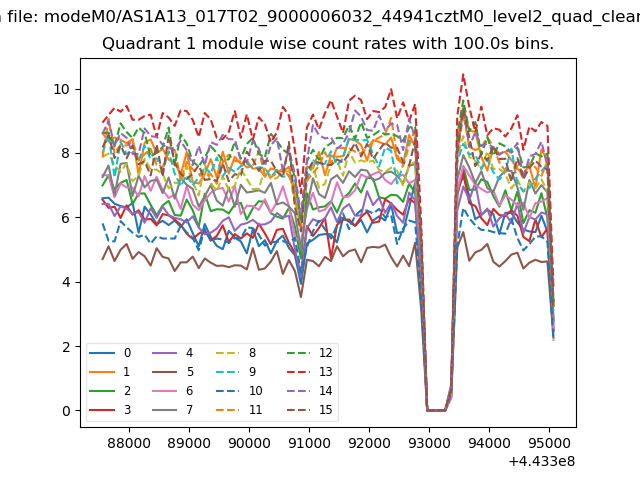
| Module-wise count rates for Quadrant A Data is divided into 100 sec bins |
 |
 |
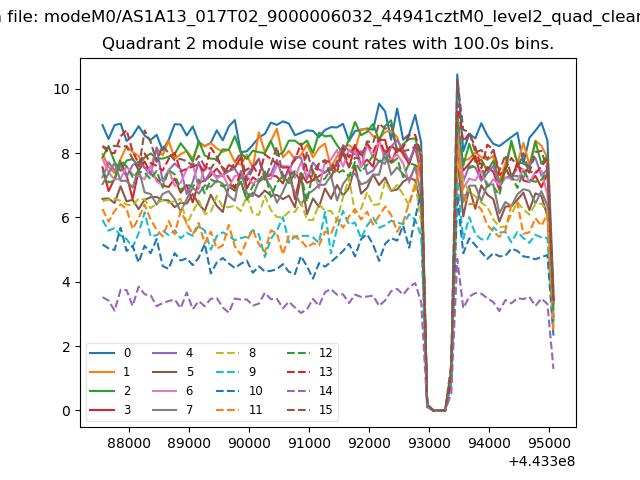
| Module-wise count rates for Quadrant B Data is divided into 100 sec bins |
 |
 |
| Module-wise count rates for Quadrant C Data is divided into 100 sec bins |
 |
 |
| Module-wise count rates for Quadrant D Data is divided into 100 sec bins |
 |
 |
| Parameter | Plot |
|---|---|
| CZT HV Monitor | 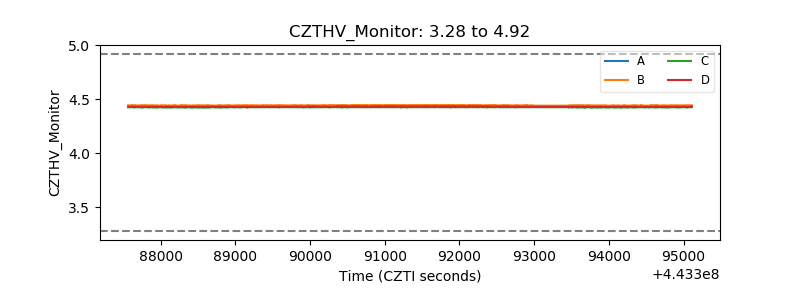 |
| D_VDD | 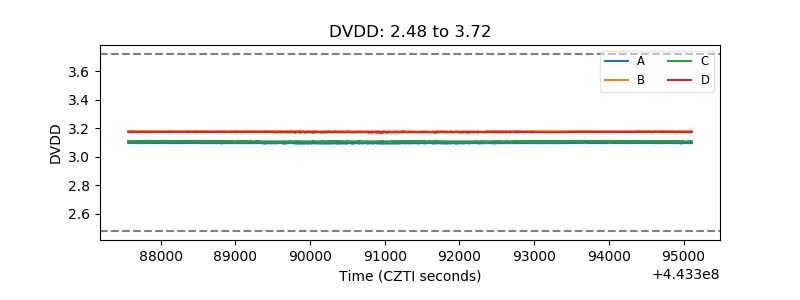 |
| Temperature 1 | 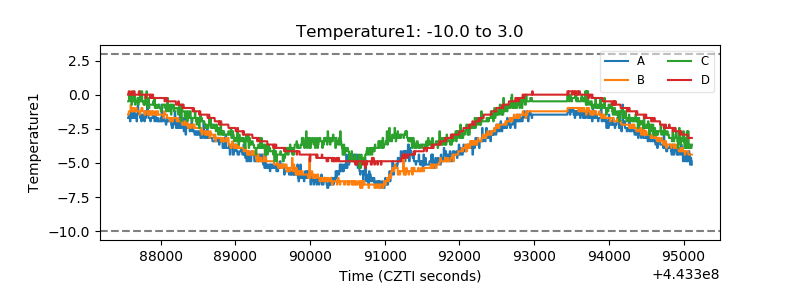 |
| Veto HV Monitor |  |
| Veto LLD | 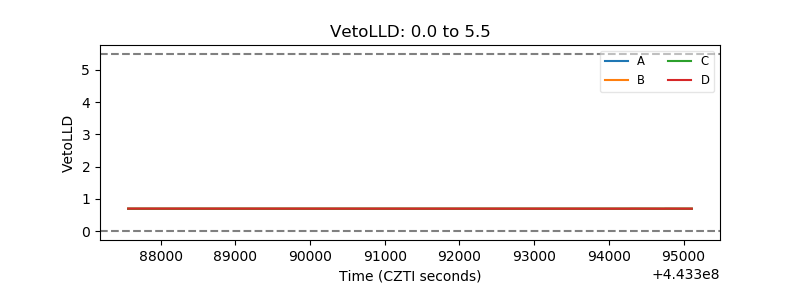 |
| Alpha Counter | 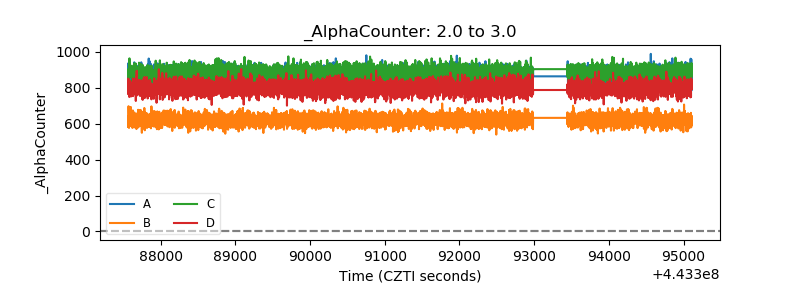 |
| _CPM_Rate | 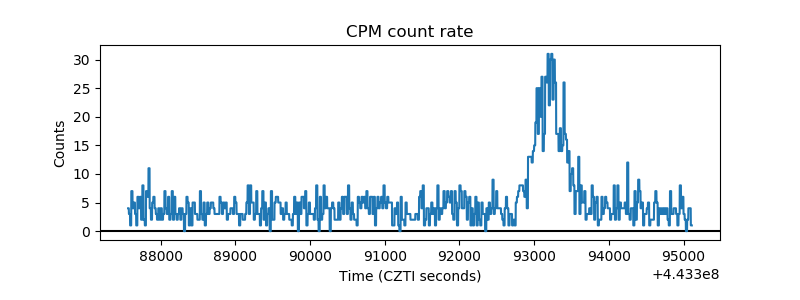 |
| CZT Counter | 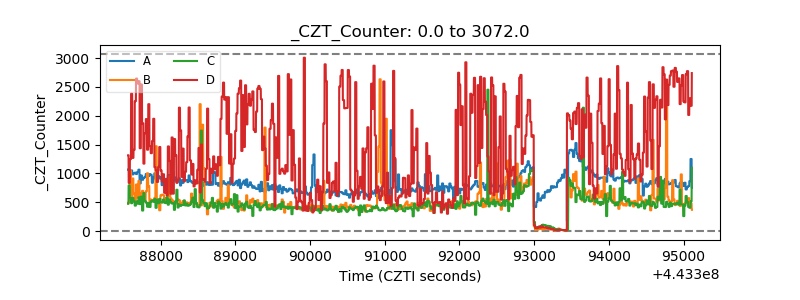 |
| +2.5 Volts monitor | 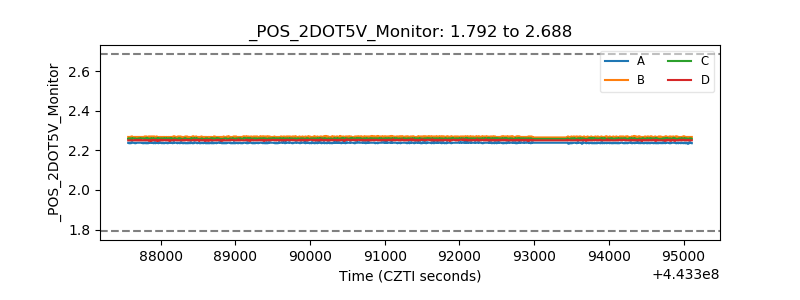 |
| +5 Volts monitor | 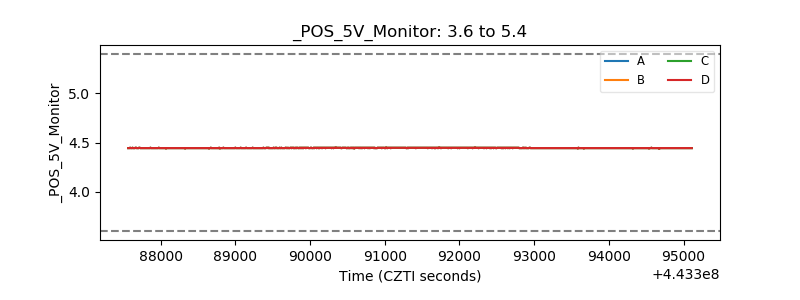 |
| _ROLL_ROT | 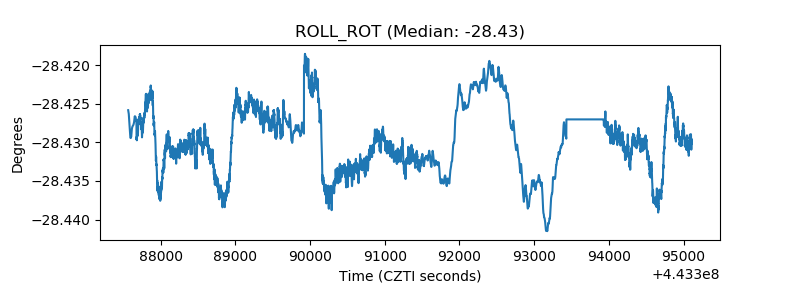 |
| _Roll_DEC | 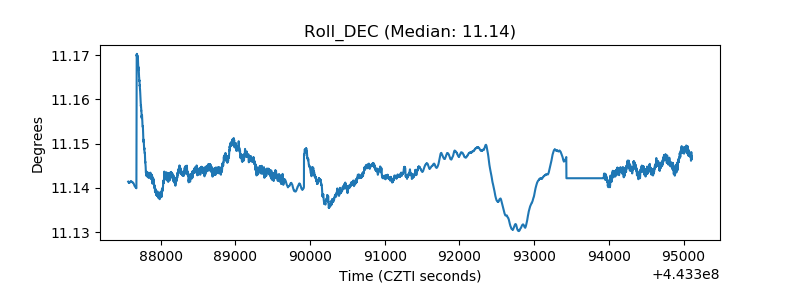 |
| _Roll_RA | 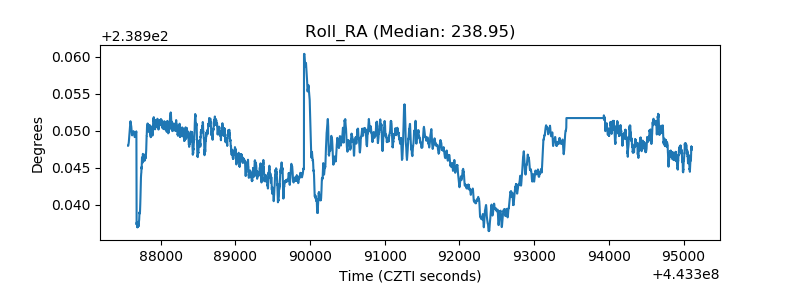 |
| Veto Counter | 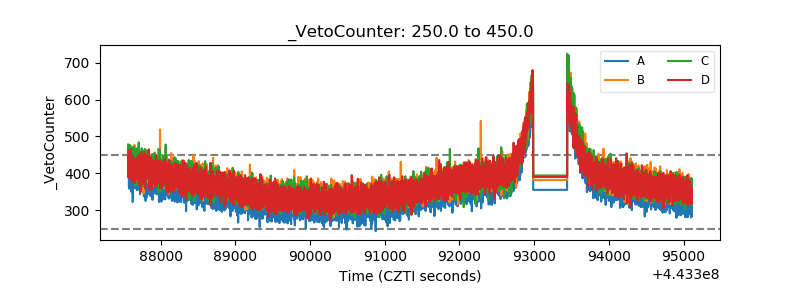 |