| Param | Original file | Final file |
|---|---|---|
| Filename | modeM0/AS1A13_017T02_9000006032_44942cztM0_level2.fits | modeM0/AS1A13_017T02_9000006032_44942cztM0_level2_quad_clean.evt |
| Size (bytes) | 672,189,120 | 113,947,200 |
| Size | 641.0 MB | 108.7 MB |
| Events in quadrant A | 5,958,898 | 806,673 |
| Events in quadrant B | 4,074,913 | 824,997 |
| Events in quadrant C | 3,466,304 | 805,268 |
| Events in quadrant D | 10,808,803 | 497,895 |
| Mode SS | |||
|---|---|---|---|
| Quadrant | BADHDUFLAG | Total packets | Discarded packets |
| A | 0 | 148 | 0 |
| B | 0 | 148 | 0 |
| C | 0 | 148 | 0 |
| D | 0 | 148 | 0 |
| Mode M0 | |||
|---|---|---|---|
| Quadrant | BADHDUFLAG | Total packets | Discarded packets |
| A | 0 | 23101 | 0 |
| B | 0 | 17163 | 0 |
| C | 0 | 15578 | 0 |
| D | 0 | 37207 | 0 |
| Quadrant | Total seconds | Saturated seconds | Saturation percentage |
|---|---|---|---|
| A | 7397 | 125 | 1.689874% |
| B | 7397 | 121 | 1.635798% |
| C | 7397 | 22 | 0.297418% |
| D | 7397 | 2599 | 35.135866% |
Noise dominated data is calculated using 1-second bins in cleaned event files. If a bin has >2000 counts, and if more than 50% of those come from <1% of pixels, then it is considered to be noise-dominated and hence unusable.
| Quadrant | # 1 sec bins | Bins with >0 counts | Bins with >2000 counts | High rate bins dominated by noise | Noise dominated (total time) | Noise dominated (detector-on time) | Marked lightcurve |
|---|---|---|---|---|---|---|---|
| A | 7397 | 7397 | 14 | 14 | 0.19% | 0.19% | 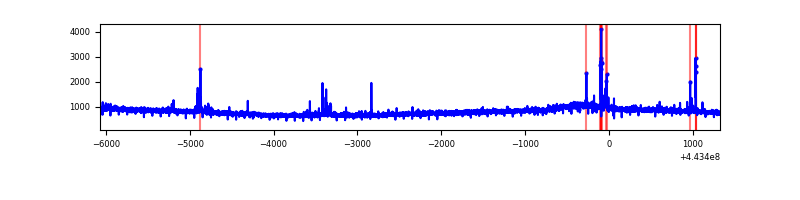 |
| B | 7397 | 7397 | 30 | 30 | 0.41% | 0.41% | 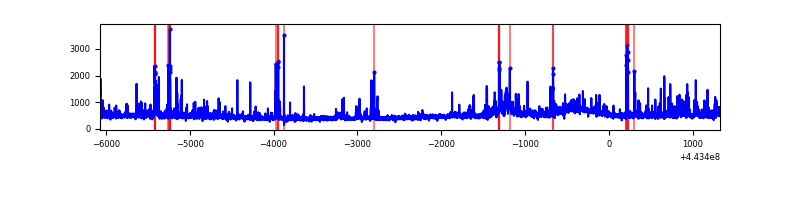 |
| C | 7397 | 7397 | 10 | 10 | 0.14% | 0.14% | 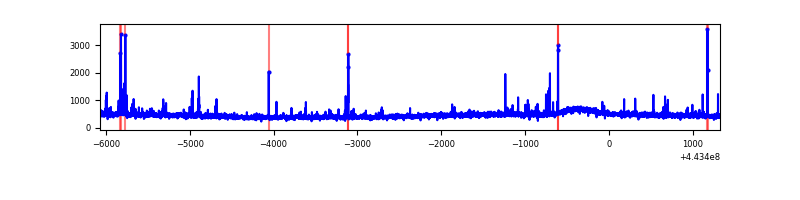 |
| D | 7397 | 7397 | 2253 | 2253 | 30.46% | 30.46% | 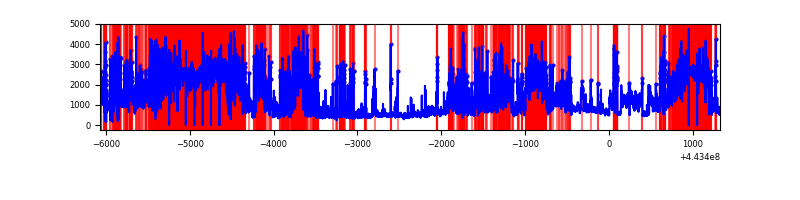 |
Top three noisy pixels from each quadrant. If the there are fewer than three noisy pixels in the level2.evt file, extra rows are filled as -1
| Pixel properties | Quadrant properties | ||||||
|---|---|---|---|---|---|---|---|
| Quadrant | DetID | PixID | Counts | Sigma | Mean | Median | Sigma |
| A | 10 | 83 | 2530599 | 14180.59 | 851 | 832 | 178.4 |
| A | 7 | 191 | 57346 | 316.79 | 851 | 832 | 178.4 |
| A | 7 | 3 | 38350 | 210.31 | 851 | 832 | 178.4 |
| B | 4 | 171 | 236613 | 1418.07 | 850 | 823 | 166.3 |
| B | 0 | 168 | 104723 | 624.87 | 850 | 823 | 166.3 |
| B | 0 | 219 | 98690 | 588.58 | 850 | 823 | 166.3 |
| C | 12 | 2 | 68698 | 343.23 | 840 | 844 | 197.7 |
| C | 14 | 254 | 43640 | 216.48 | 840 | 844 | 197.7 |
| C | 1 | 3 | 27684 | 135.77 | 840 | 844 | 197.7 |
| D | 5 | 171 | 3421014 | 19434.57 | 682 | 658 | 176.0 |
| D | 1 | 52 | 1675359 | 9515.71 | 682 | 658 | 176.0 |
| D | 1 | 47 | 938050 | 5326.29 | 682 | 658 | 176.0 |
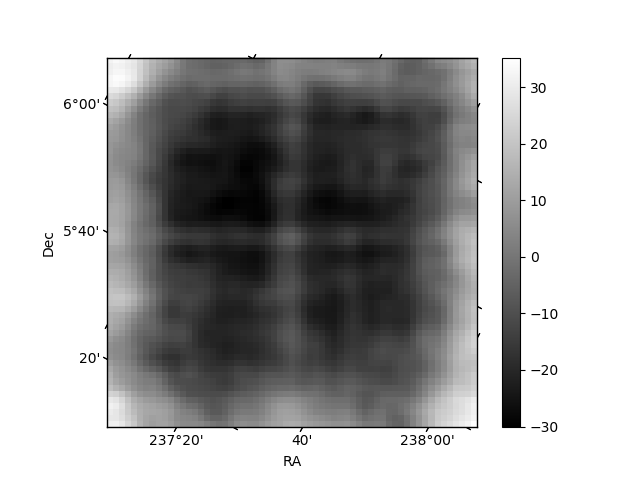
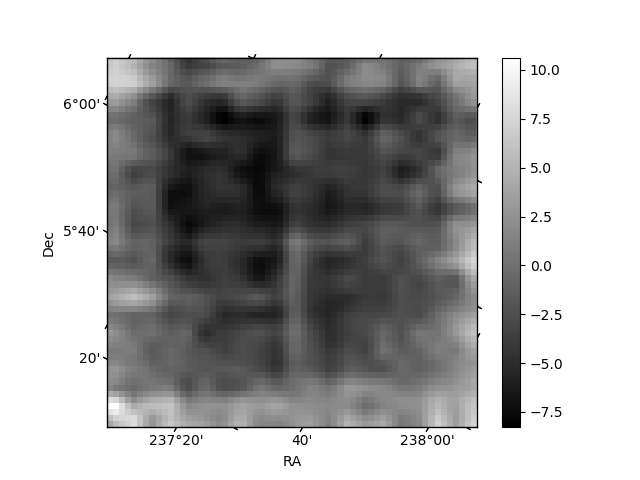
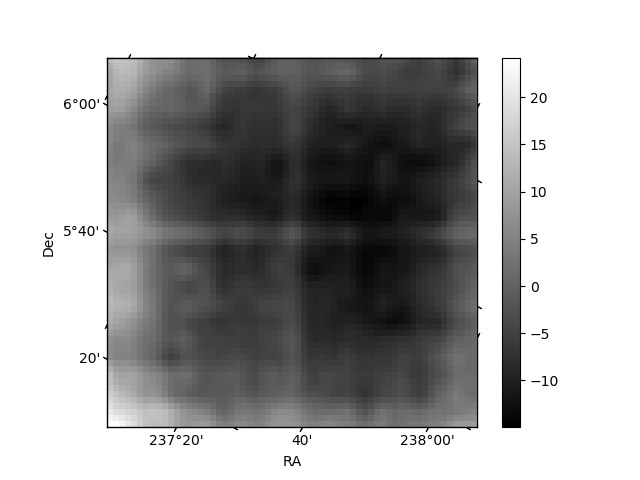
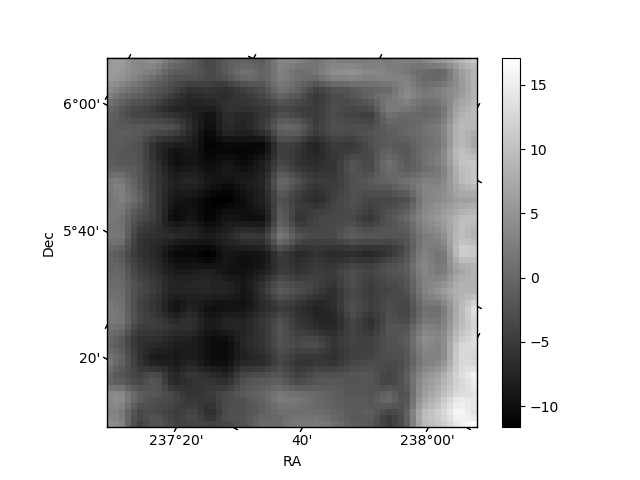
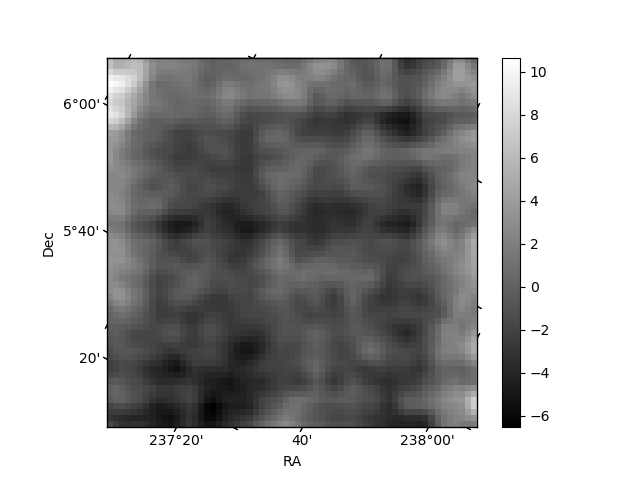
Histogram calculated using DETX and DETY for each event in the final _common_clean file
| Quadrant A | 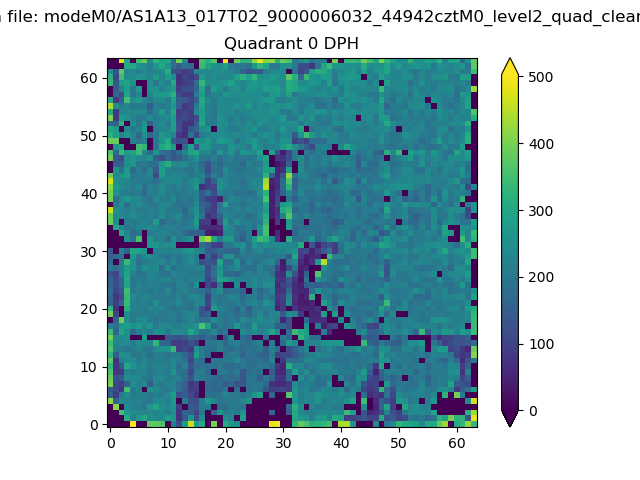 |
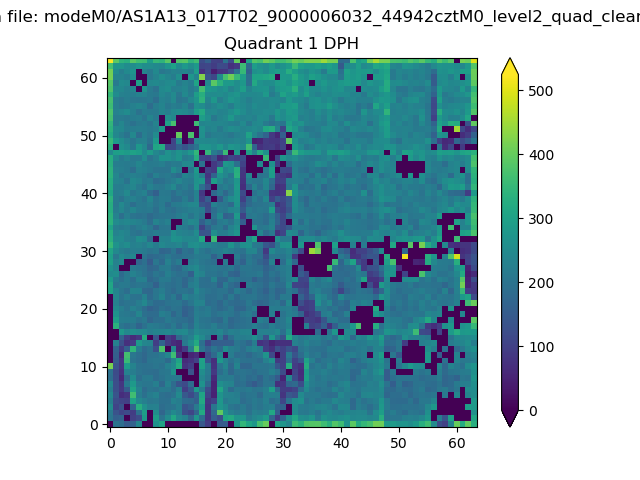 |
Quadrant B |
|---|---|---|---|
| Quadrant D | 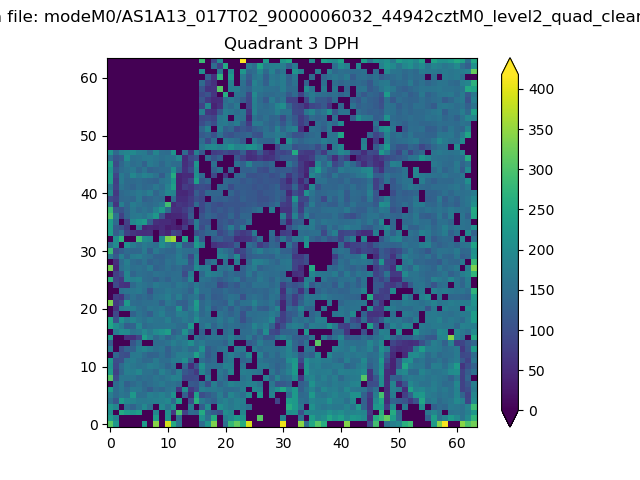 |
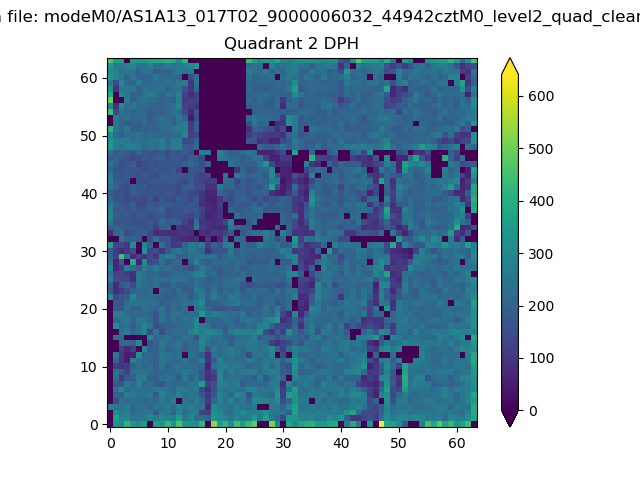 |
Quadrant C |
| Plot type | Count rate plots | Images |
|---|---|---|
| Comparison with Poisson distribution Blue bars denote a histogram of data divided into 1 sec bins. Red curve is a Poisson curve with rate = median count rate of data. |
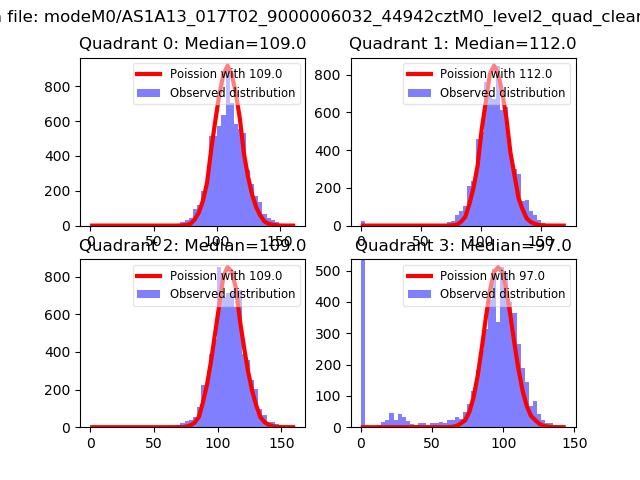 |
 |
| Quadrant-wise count rates Data is divided into 100 sec bins |
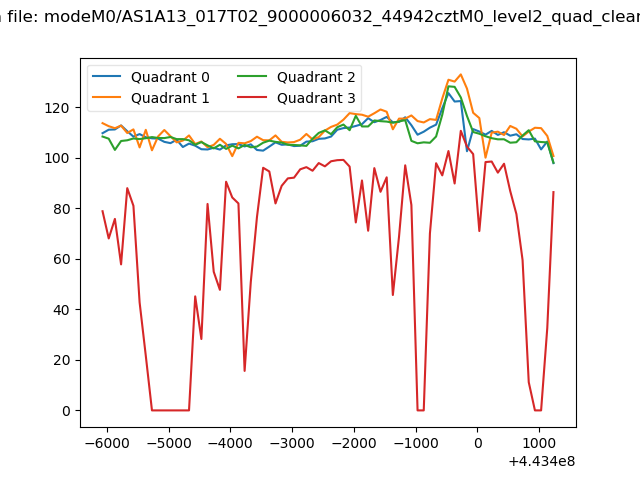 |
|
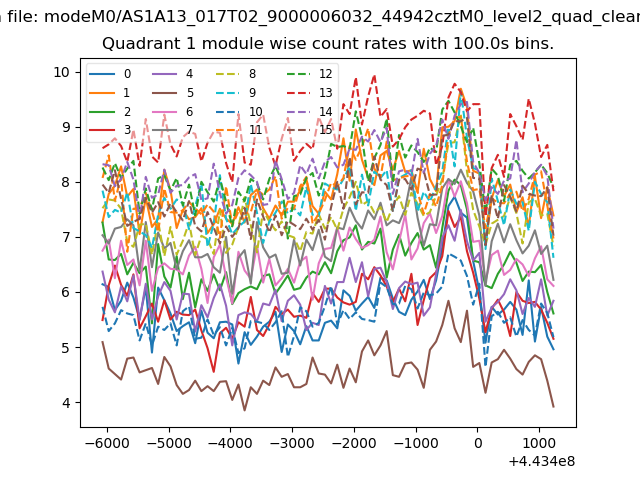
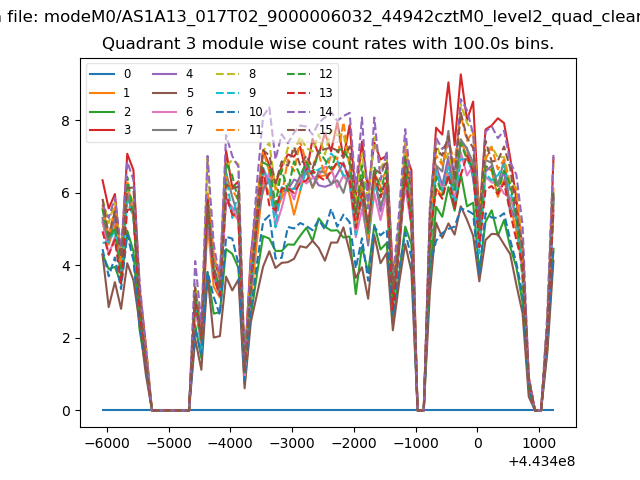
| Module-wise count rates for Quadrant A Data is divided into 100 sec bins |
 |
 |
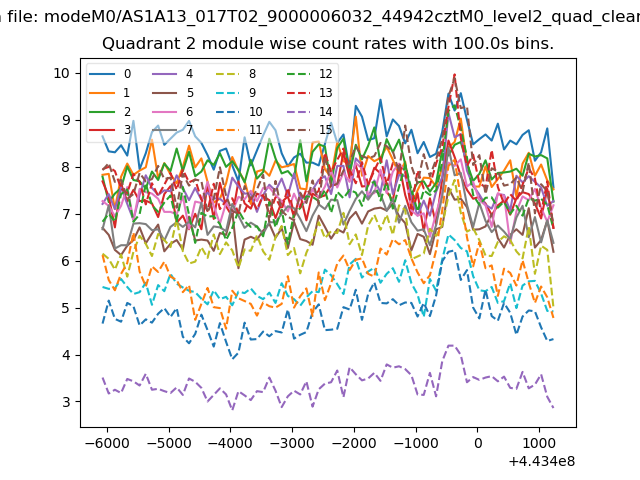
| Module-wise count rates for Quadrant B Data is divided into 100 sec bins |
 |
 |
| Module-wise count rates for Quadrant C Data is divided into 100 sec bins |
 |
 |
| Module-wise count rates for Quadrant D Data is divided into 100 sec bins |
 |
 |
| Parameter | Plot |
|---|---|
| CZT HV Monitor | 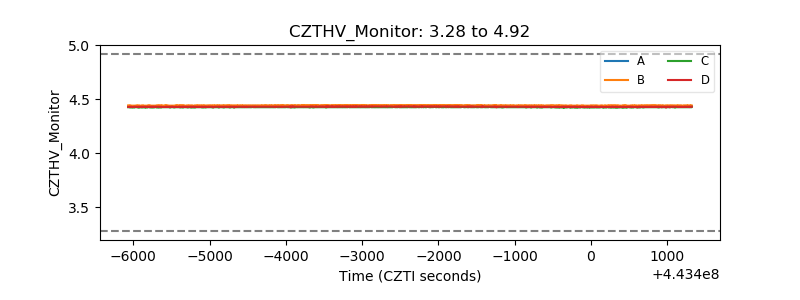 |
| D_VDD | 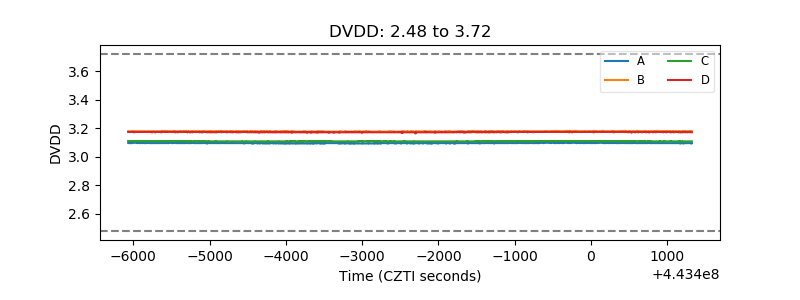 |
| Temperature 1 | 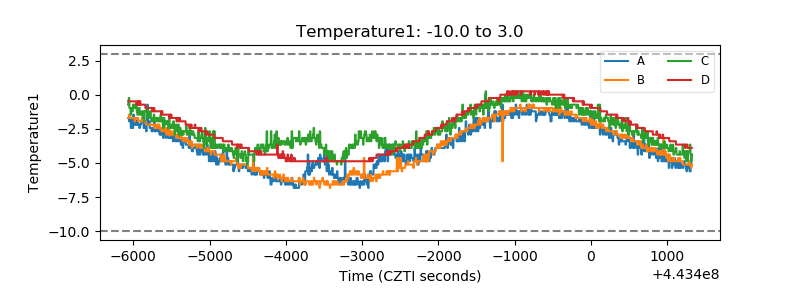 |
| Veto HV Monitor |  |
| Veto LLD | 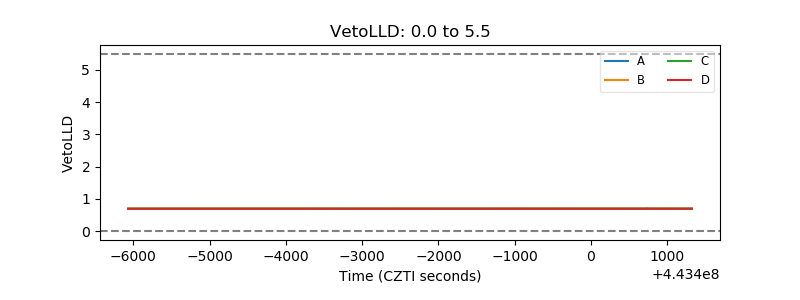 |
| Alpha Counter | 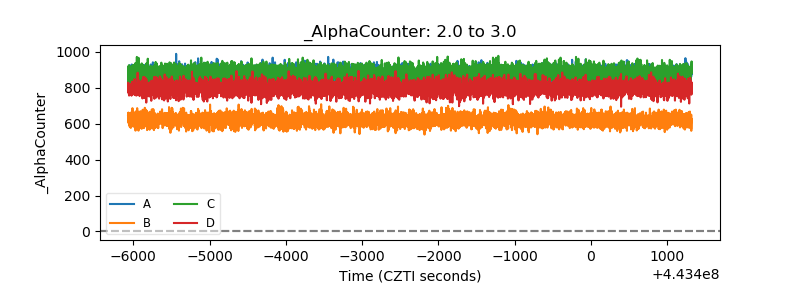 |
| _CPM_Rate | 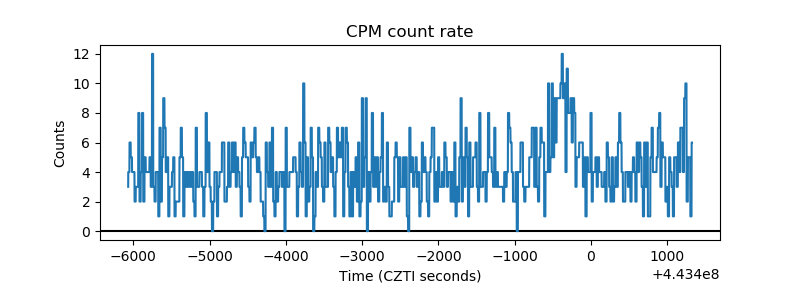 |
| CZT Counter | 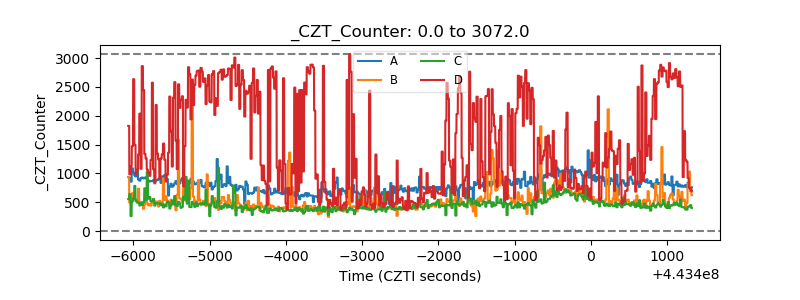 |
| +2.5 Volts monitor | 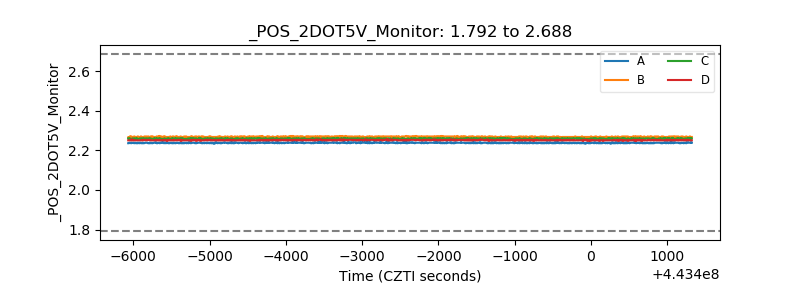 |
| +5 Volts monitor | 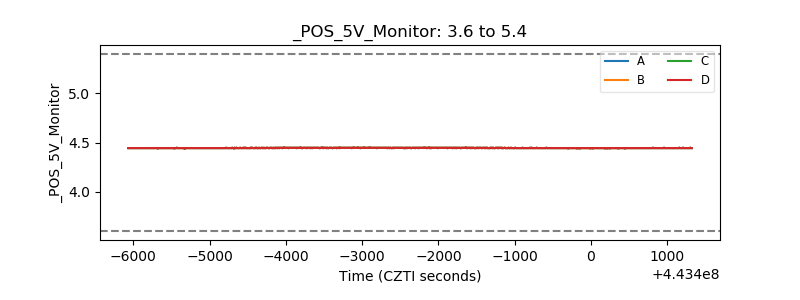 |
| _ROLL_ROT | 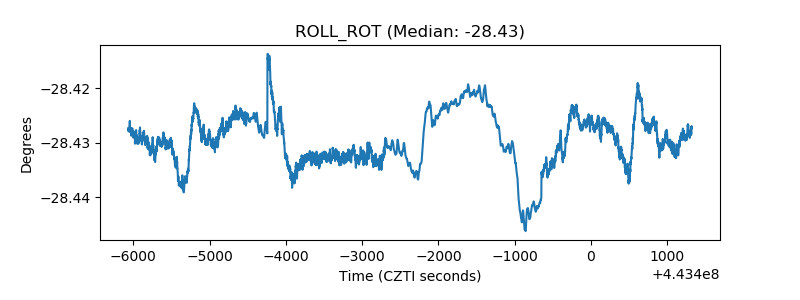 |
| _Roll_DEC | 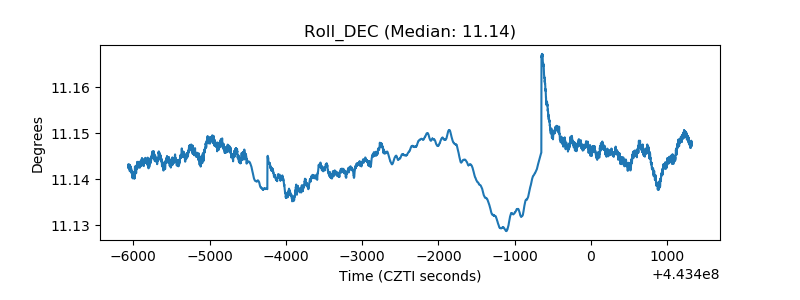 |
| _Roll_RA | 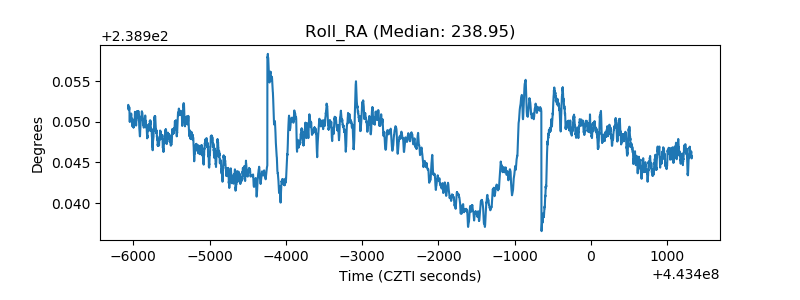 |
| Veto Counter | 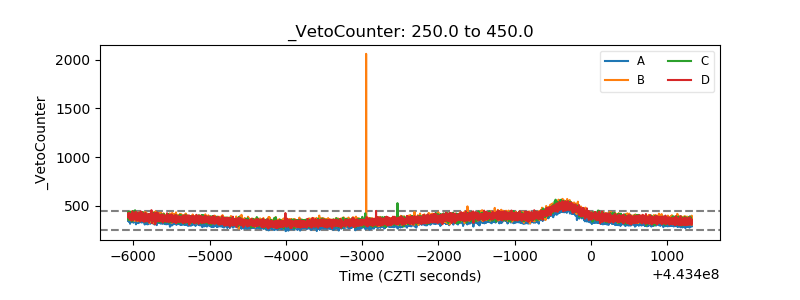 |