| Param | Original file | Final file |
|---|---|---|
| Filename | modeM0/AS1A13_017T02_9000006032_44943cztM0_level2.fits | modeM0/AS1A13_017T02_9000006032_44943cztM0_level2_quad_clean.evt |
| Size (bytes) | 470,733,120 | 92,733,120 |
| Size | 448.9 MB | 88.4 MB |
| Events in quadrant A | 4,591,209 | 630,264 |
| Events in quadrant B | 3,490,760 | 641,337 |
| Events in quadrant C | 2,661,562 | 633,214 |
| Events in quadrant D | 6,228,139 | 495,084 |
| Mode SS | |||
|---|---|---|---|
| Quadrant | BADHDUFLAG | Total packets | Discarded packets |
| A | 0 | 116 | 0 |
| B | 0 | 116 | 0 |
| C | 0 | 116 | 0 |
| D | 0 | 116 | 0 |
| Mode M0 | |||
|---|---|---|---|
| Quadrant | BADHDUFLAG | Total packets | Discarded packets |
| A | 0 | 18229 | 0 |
| B | 0 | 14490 | 0 |
| C | 0 | 12211 | 0 |
| D | 0 | 22642 | 0 |
| Quadrant | Total seconds | Saturated seconds | Saturation percentage |
|---|---|---|---|
| A | 5838 | 116 | 1.986982% |
| B | 5839 | 208 | 3.562254% |
| C | 5839 | 14 | 0.239767% |
| D | 5839 | 997 | 17.074842% |
Noise dominated data is calculated using 1-second bins in cleaned event files. If a bin has >2000 counts, and if more than 50% of those come from <1% of pixels, then it is considered to be noise-dominated and hence unusable.
| Quadrant | # 1 sec bins | Bins with >0 counts | Bins with >2000 counts | High rate bins dominated by noise | Noise dominated (total time) | Noise dominated (detector-on time) | Marked lightcurve |
|---|---|---|---|---|---|---|---|
| A | 5838 | 5838 | 13 | 13 | 0.22% | 0.22% |  |
| B | 5839 | 5839 | 108 | 108 | 1.85% | 1.85% |  |
| C | 5839 | 5839 | 5 | 5 | 0.09% | 0.09% |  |
| D | 5839 | 5839 | 826 | 826 | 14.15% | 14.15% |  |
Top three noisy pixels from each quadrant. If the there are fewer than three noisy pixels in the level2.evt file, extra rows are filled as -1
| Pixel properties | Quadrant properties | ||||||
|---|---|---|---|---|---|---|---|
| Quadrant | DetID | PixID | Counts | Sigma | Mean | Median | Sigma |
| A | 10 | 83 | 1937012 | 13830.94 | 665 | 651 | 140.0 |
| A | 7 | 191 | 40872 | 287.29 | 665 | 651 | 140.0 |
| A | 7 | 3 | 21453 | 148.58 | 665 | 651 | 140.0 |
| B | 4 | 171 | 454184 | 3466.54 | 660 | 638 | 130.8 |
| B | 5 | 172 | 117067 | 889.89 | 660 | 638 | 130.8 |
| B | 5 | 255 | 86555 | 656.68 | 660 | 638 | 130.8 |
| C | 14 | 254 | 34538 | 215.57 | 658 | 662 | 157.1 |
| C | 1 | 3 | 27808 | 172.74 | 658 | 662 | 157.1 |
| C | 3 | 233 | 13913 | 84.32 | 658 | 662 | 157.1 |
| D | 5 | 171 | 1302718 | 8557.44 | 605 | 588 | 152.2 |
| D | 13 | 187 | 1025482 | 6735.48 | 605 | 588 | 152.2 |
| D | 1 | 52 | 633138 | 4157.04 | 605 | 588 | 152.2 |
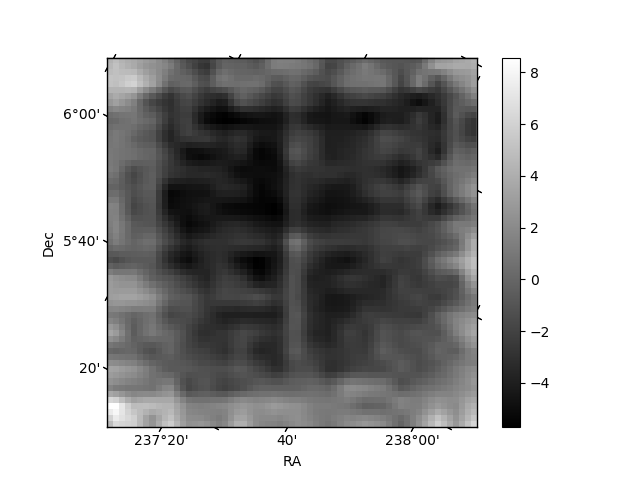
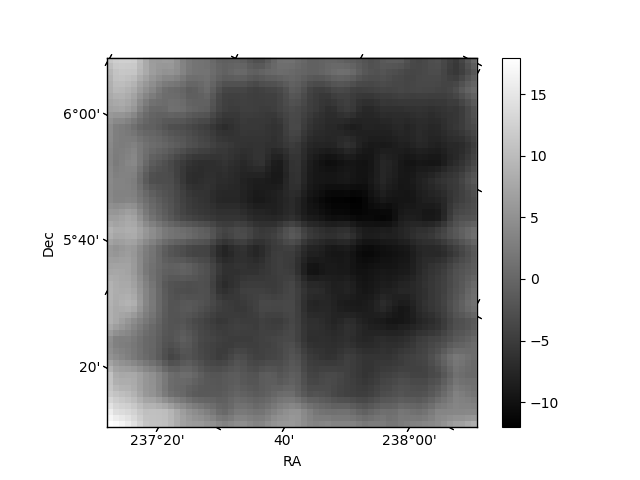
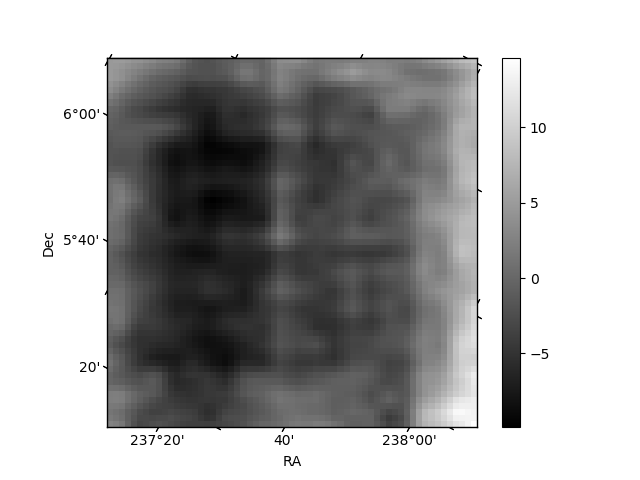
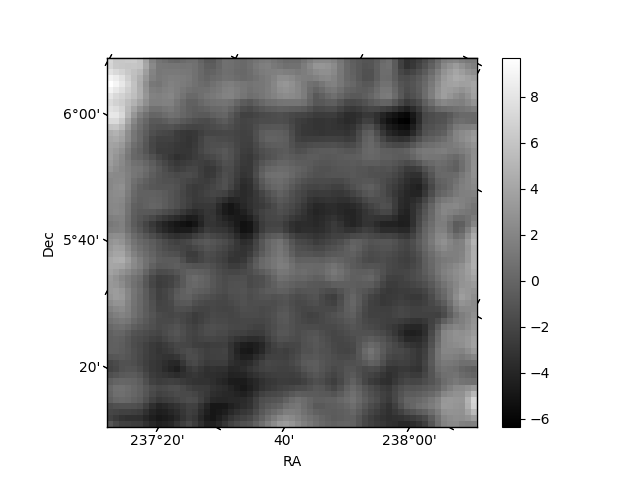
Histogram calculated using DETX and DETY for each event in the final _common_clean file
| Quadrant A | 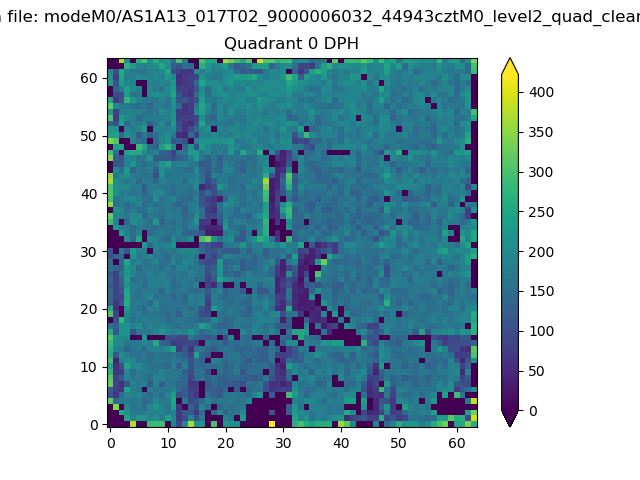 |
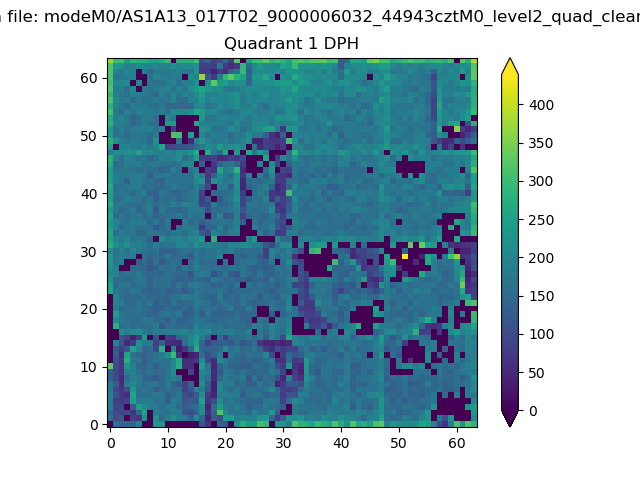 |
Quadrant B |
|---|---|---|---|
| Quadrant D | 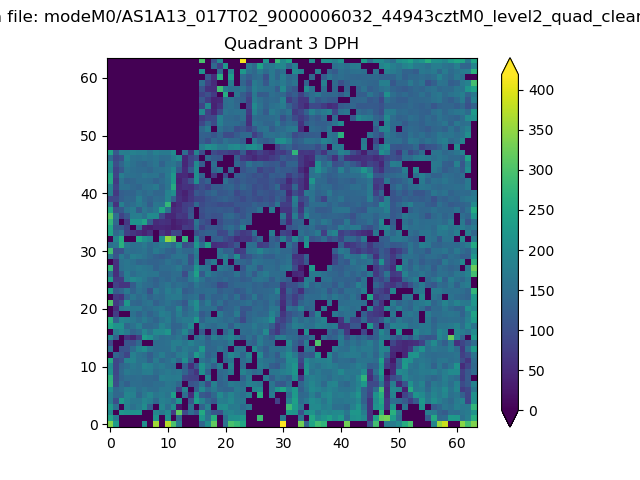 |
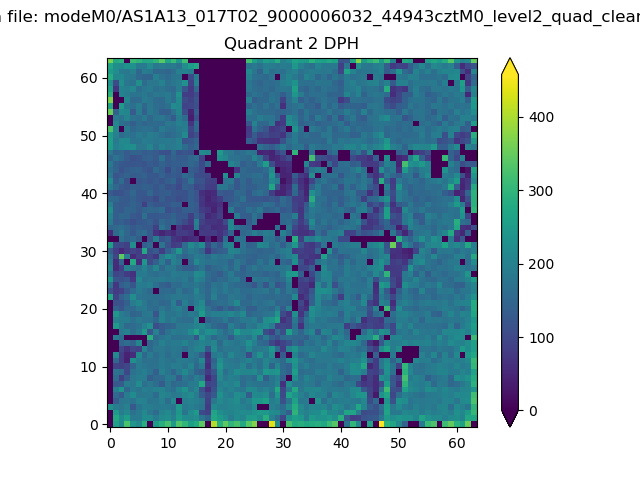 |
Quadrant C |
| Plot type | Count rate plots | Images |
|---|---|---|
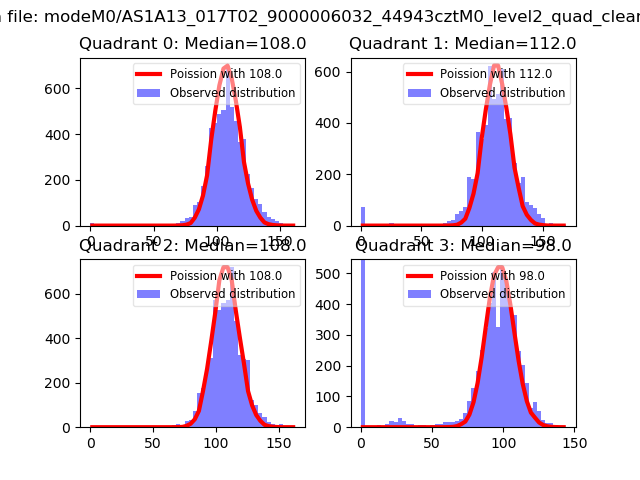
| Comparison with Poisson distribution Blue bars denote a histogram of data divided into 1 sec bins. Red curve is a Poisson curve with rate = median count rate of data. |
 |
 |
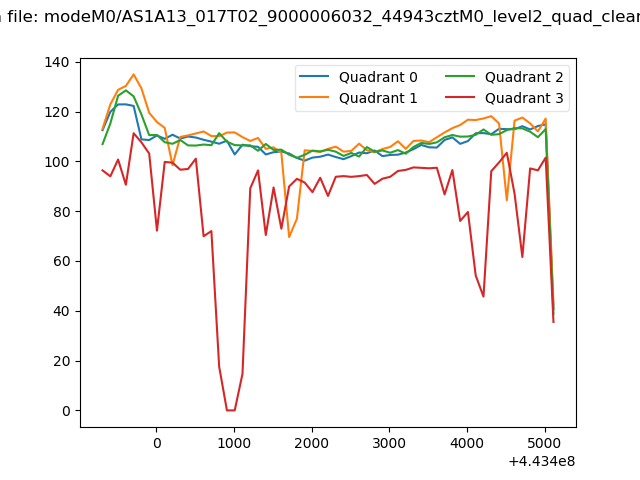
| Quadrant-wise count rates Data is divided into 100 sec bins |
 |
|
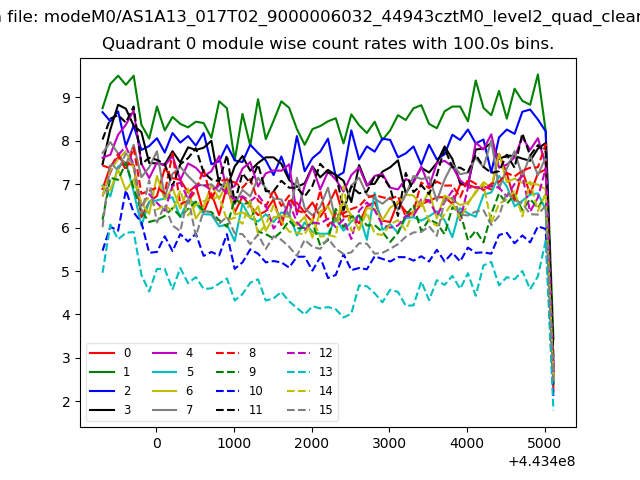
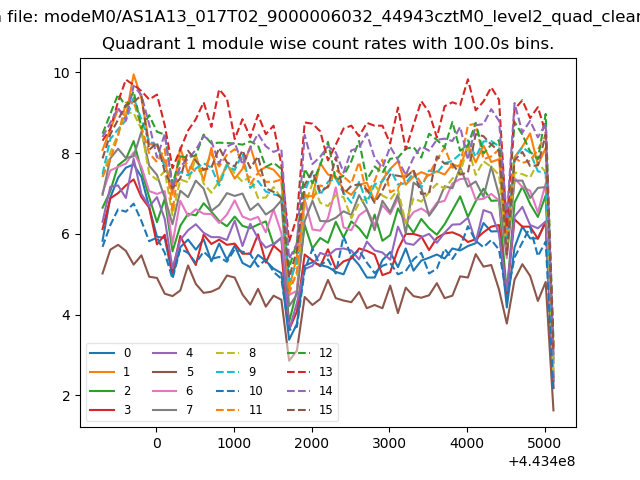
| Module-wise count rates for Quadrant A Data is divided into 100 sec bins |
 |
 |
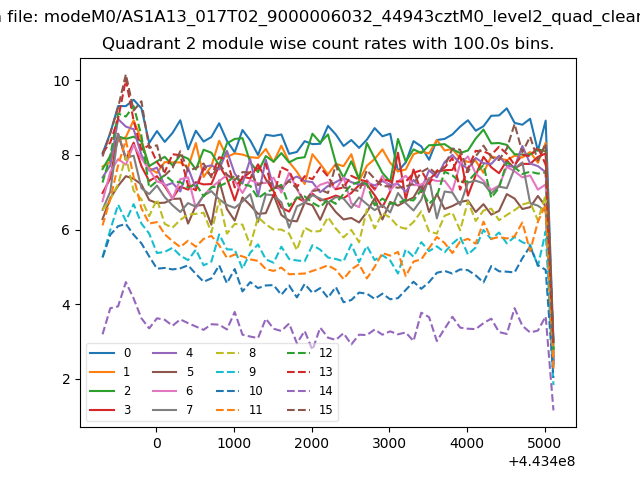
| Module-wise count rates for Quadrant B Data is divided into 100 sec bins |
 |
 |
| Module-wise count rates for Quadrant C Data is divided into 100 sec bins |
 |
 |
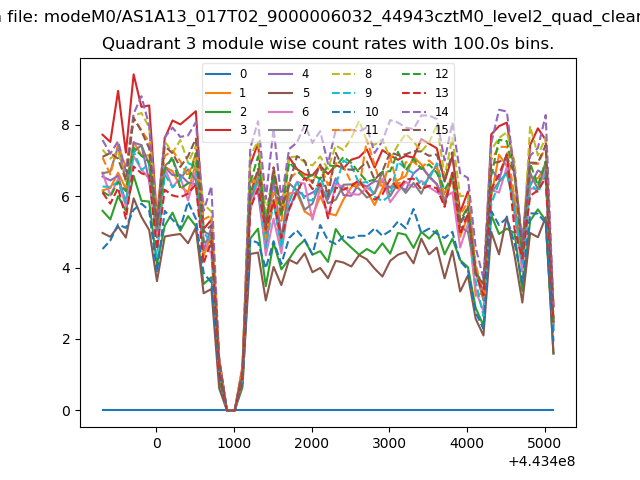
| Module-wise count rates for Quadrant D Data is divided into 100 sec bins |
 |
 |
| Parameter | Plot |
|---|---|
| CZT HV Monitor | 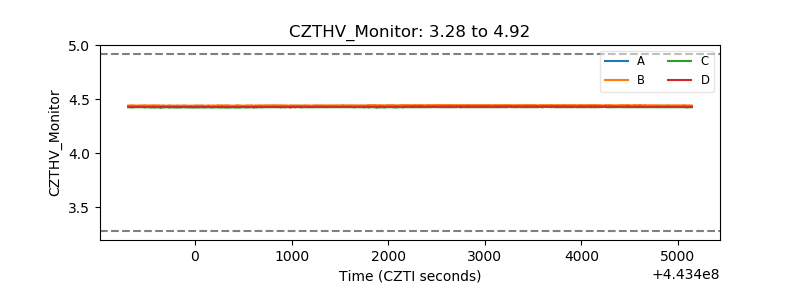 |
| D_VDD | 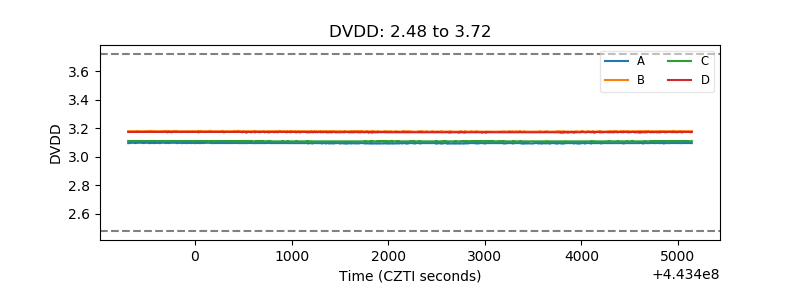 |
| Temperature 1 | 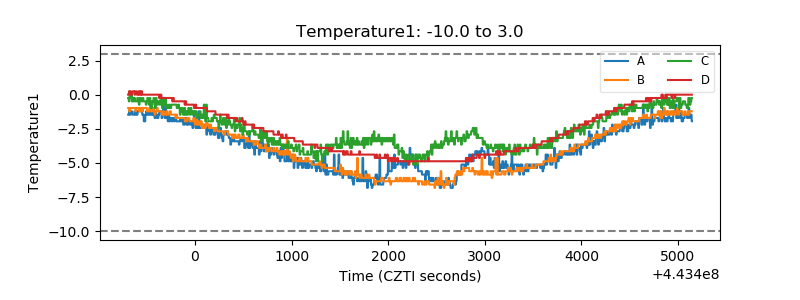 |
| Veto HV Monitor | 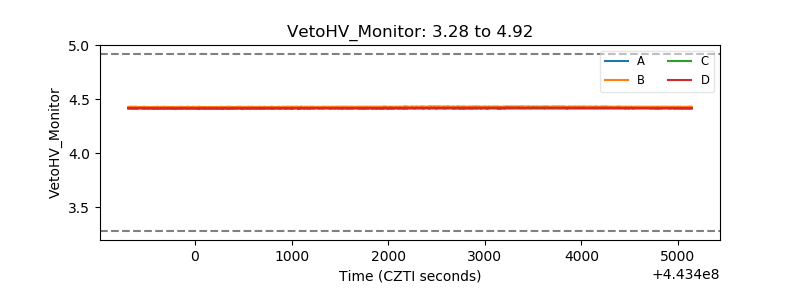 |
| Veto LLD | 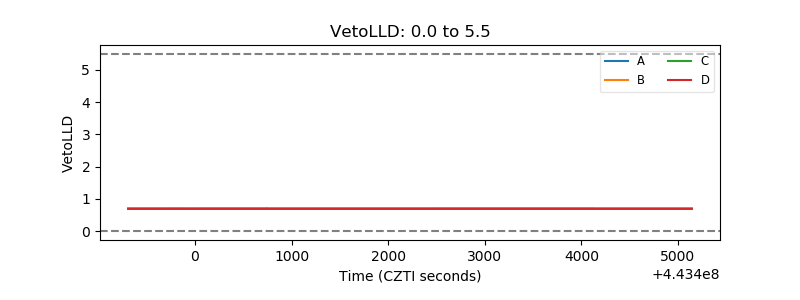 |
| Alpha Counter | 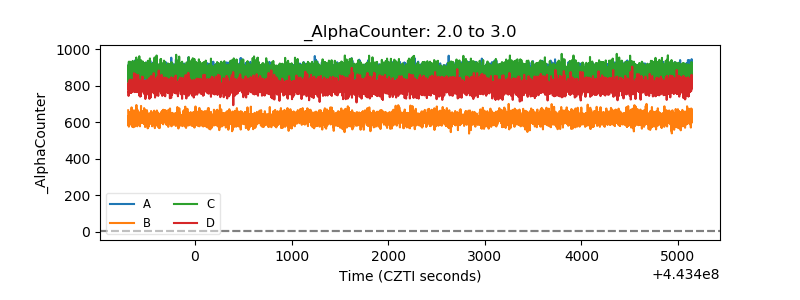 |
| _CPM_Rate | 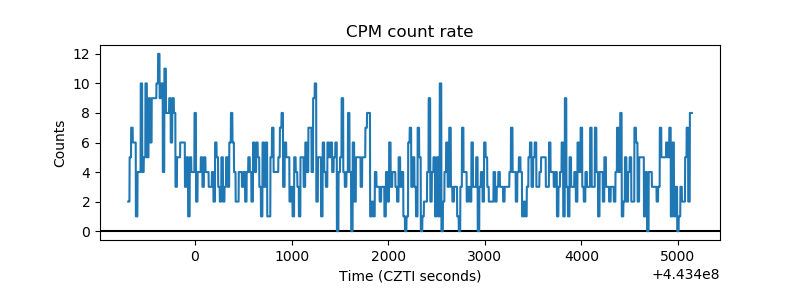 |
| CZT Counter | 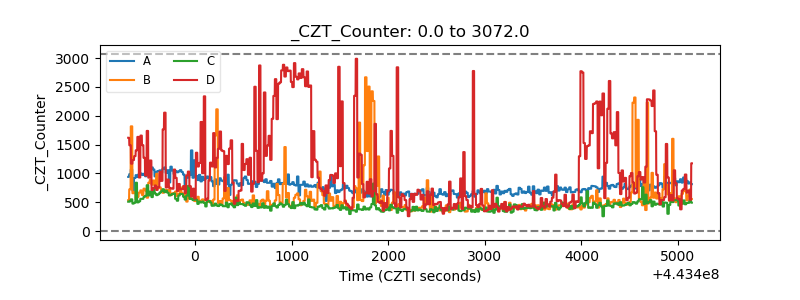 |
| +2.5 Volts monitor | 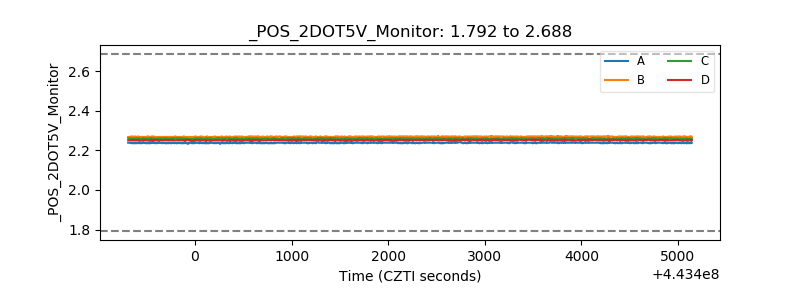 |
| +5 Volts monitor | 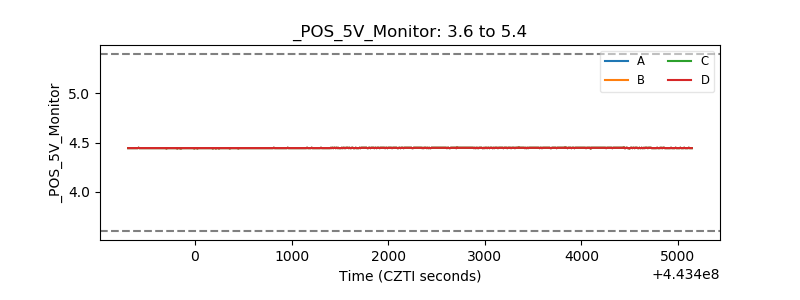 |
| _ROLL_ROT | 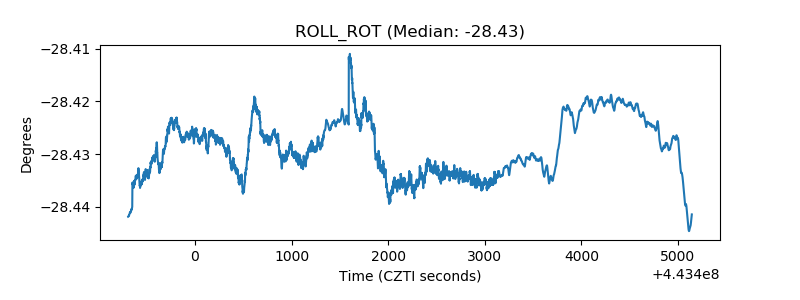 |
| _Roll_DEC |  |
| _Roll_RA | 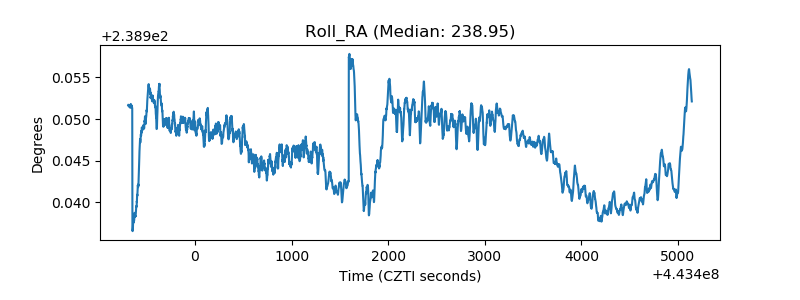 |
| Veto Counter | 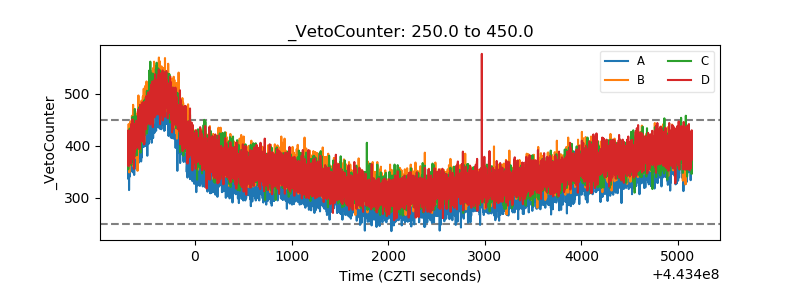 |