| Param | Original file | Final file |
|---|---|---|
| Filename | modeM0/AS1A13_017T02_9000006032_44946cztM0_level2.fits | modeM0/AS1A13_017T02_9000006032_44946cztM0_level2_quad_clean.evt |
| Size (bytes) | 1,079,634,240 | 219,746,880 |
| Size | 1.0 GB | 209.6 MB |
| Events in quadrant A | 10,890,110 | 1,471,173 |
| Events in quadrant B | 7,706,672 | 1,514,334 |
| Events in quadrant C | 6,651,429 | 1,490,703 |
| Events in quadrant D | 13,644,477 | 1,219,187 |
| Mode SS | |||
|---|---|---|---|
| Quadrant | BADHDUFLAG | Total packets | Discarded packets |
| A | 0 | 278 | 0 |
| B | 0 | 278 | 0 |
| C | 0 | 278 | 0 |
| D | 0 | 278 | 0 |
| Mode M0 | |||
|---|---|---|---|
| Quadrant | BADHDUFLAG | Total packets | Discarded packets |
| A | 0 | 42970 | 1 |
| B | 0 | 32536 | 1 |
| C | 0 | 29714 | 1 |
| D | 0 | 50182 | 1 |
| Mode M9 | |||
|---|---|---|---|
| Quadrant | BADHDUFLAG | Total packets | Discarded packets |
| A | 0 | 5 | 0 |
| B | 0 | 5 | 0 |
| C | 0 | 5 | 0 |
| D | 0 | 5 | 0 |
| Quadrant | Total seconds | Saturated seconds | Saturation percentage |
|---|---|---|---|
| A | 13868 | 346 | 2.494952% |
| B | 13868 | 457 | 3.295356% |
| C | 13869 | 108 | 0.778715% |
| D | 13869 | 1654 | 11.925878% |
Noise dominated data is calculated using 1-second bins in cleaned event files. If a bin has >2000 counts, and if more than 50% of those come from <1% of pixels, then it is considered to be noise-dominated and hence unusable.
| Quadrant | # 1 sec bins | Bins with >0 counts | Bins with >2000 counts | High rate bins dominated by noise | Noise dominated (total time) | Noise dominated (detector-on time) | Marked lightcurve |
|---|---|---|---|---|---|---|---|
| A | 14293 | 13869 | 1 | 1 | 0.01% | 0.01% | 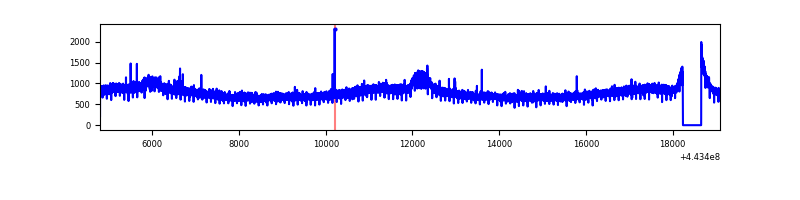 |
| B | 14293 | 13869 | 100 | 100 | 0.70% | 0.72% | 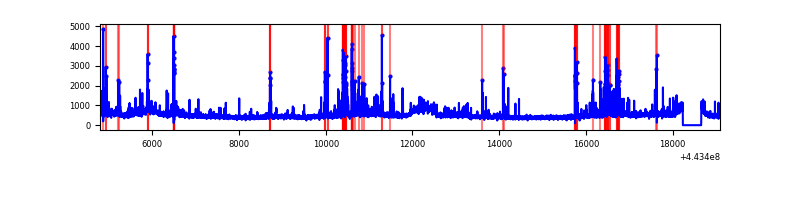 |
| C | 14294 | 13870 | 24 | 24 | 0.17% | 0.17% | 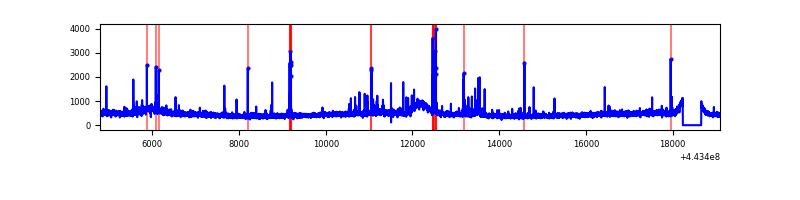 |
| D | 14294 | 13870 | 1415 | 1415 | 9.90% | 10.20% | 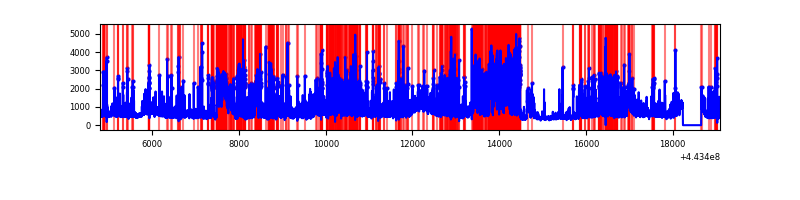 |
Top three noisy pixels from each quadrant. If the there are fewer than three noisy pixels in the level2.evt file, extra rows are filled as -1
| Pixel properties | Quadrant properties | ||||||
|---|---|---|---|---|---|---|---|
| Quadrant | DetID | PixID | Counts | Sigma | Mean | Median | Sigma |
| A | 10 | 83 | 4552355 | 13343.75 | 1625 | 1589 | 341.0 |
| A | 0 | 243 | 19999 | 53.98 | 1625 | 1589 | 341.0 |
| A | 13 | 254 | 19326 | 52.01 | 1625 | 1589 | 341.0 |
| B | 5 | 172 | 421629 | 1308.27 | 1619 | 1569 | 321.1 |
| B | 4 | 171 | 210320 | 650.15 | 1619 | 1569 | 321.1 |
| B | 5 | 255 | 152451 | 469.92 | 1619 | 1569 | 321.1 |
| C | 14 | 254 | 109942 | 286.42 | 1603 | 1613 | 378.2 |
| C | 1 | 241 | 86111 | 223.41 | 1603 | 1613 | 378.2 |
| C | 1 | 3 | 78881 | 204.29 | 1603 | 1613 | 378.2 |
| D | 13 | 187 | 2528162 | 6422.65 | 1545 | 1496 | 393.4 |
| D | 1 | 52 | 1528845 | 3882.44 | 1545 | 1496 | 393.4 |
| D | 13 | 249 | 1496883 | 3801.19 | 1545 | 1496 | 393.4 |
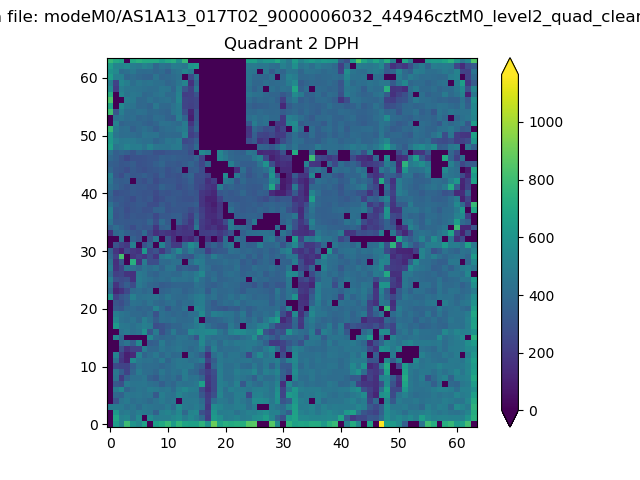
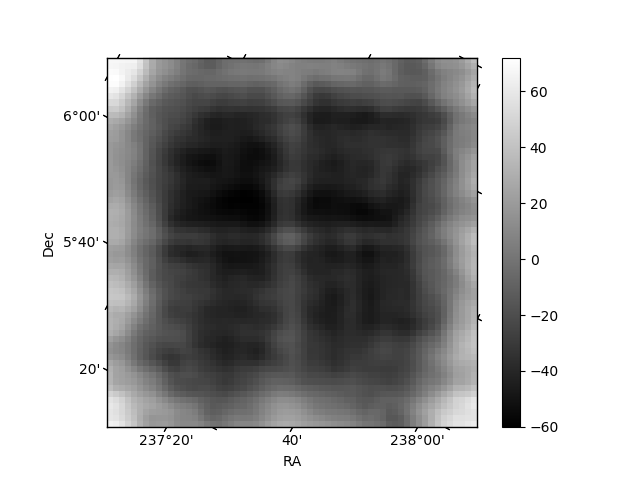
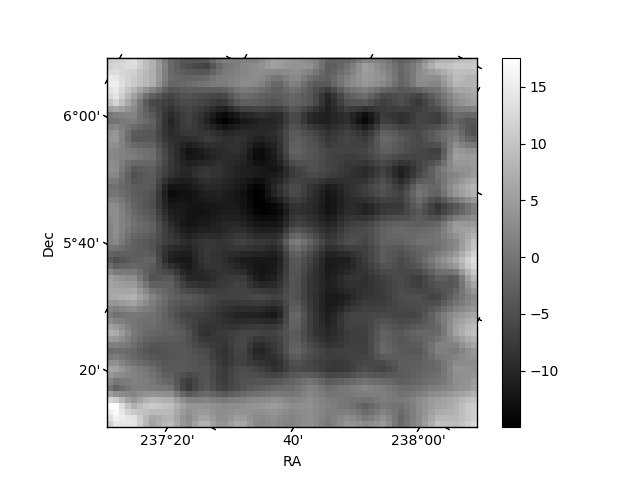
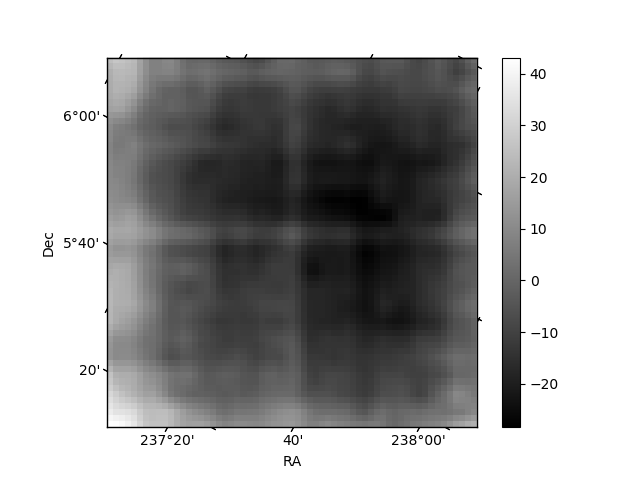
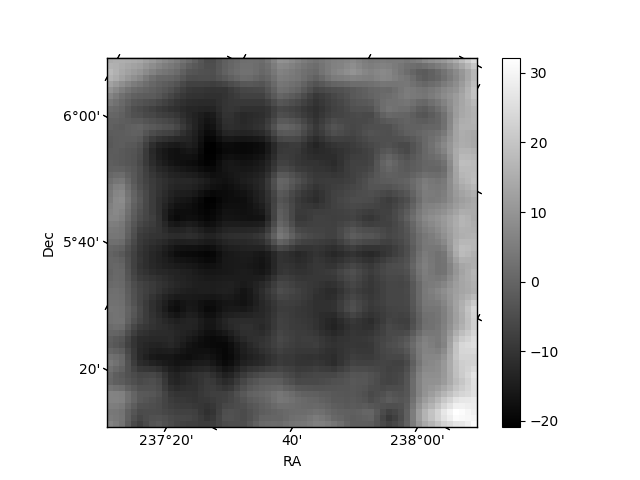
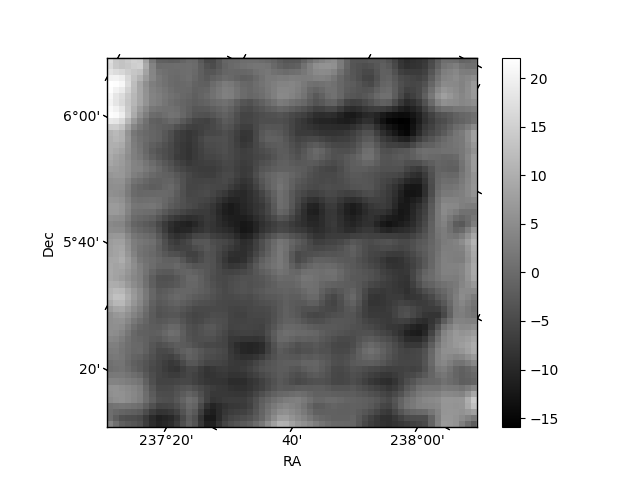
Histogram calculated using DETX and DETY for each event in the final _common_clean file
| Quadrant A | 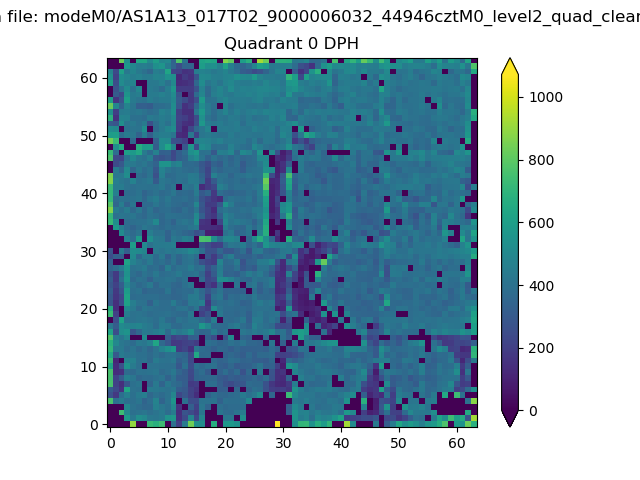 |
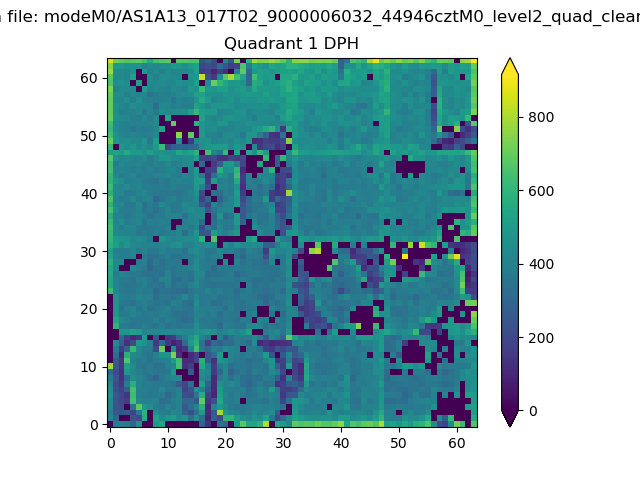 |
Quadrant B |
|---|---|---|---|
| Quadrant D | 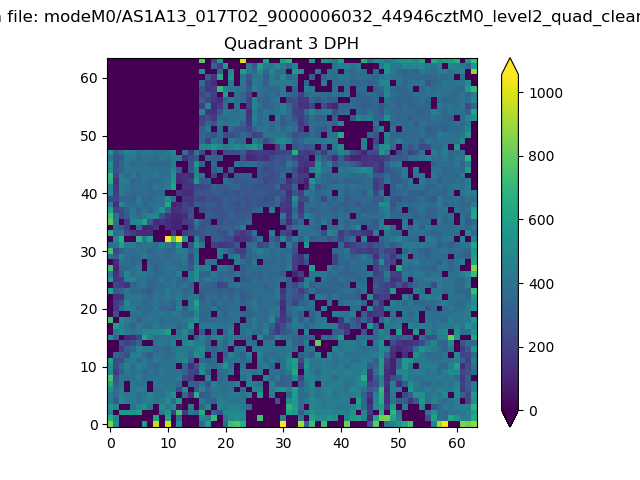 |
 |
Quadrant C |
| Plot type | Count rate plots | Images |
|---|---|---|
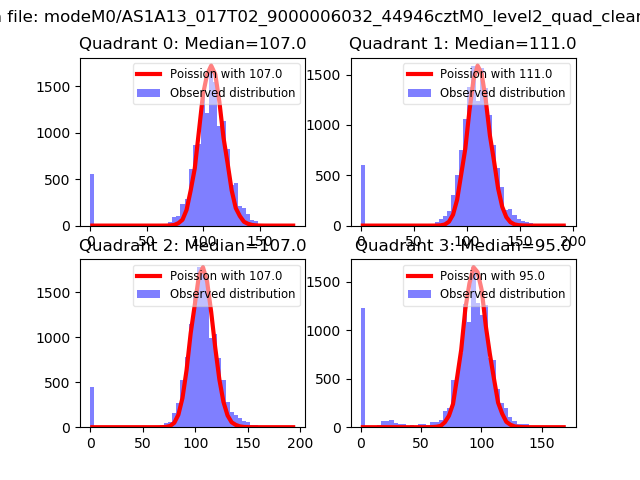
| Comparison with Poisson distribution Blue bars denote a histogram of data divided into 1 sec bins. Red curve is a Poisson curve with rate = median count rate of data. |
 |
 |
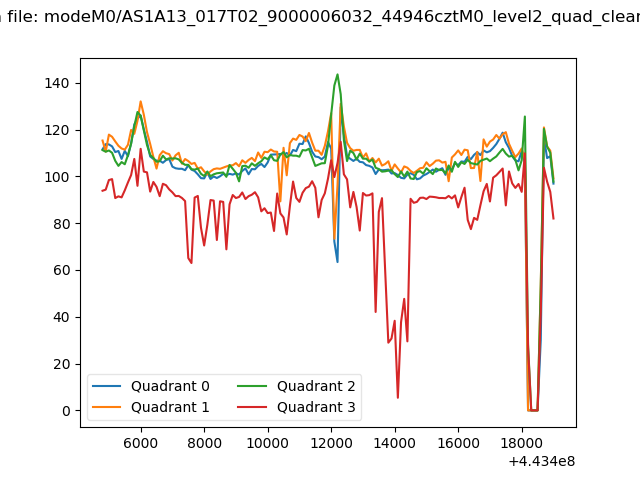
| Quadrant-wise count rates Data is divided into 100 sec bins |
 |
|
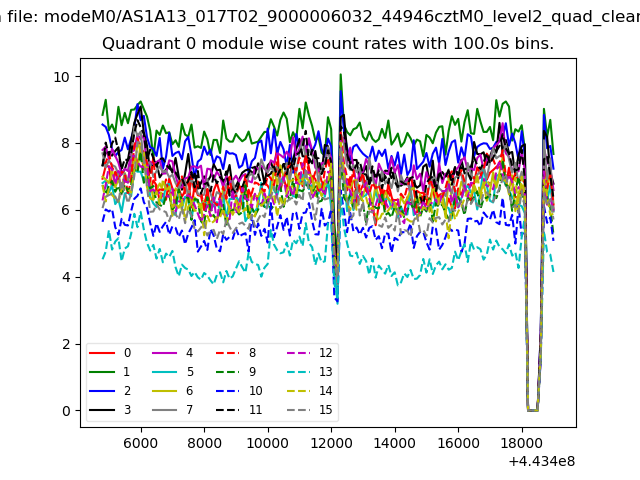
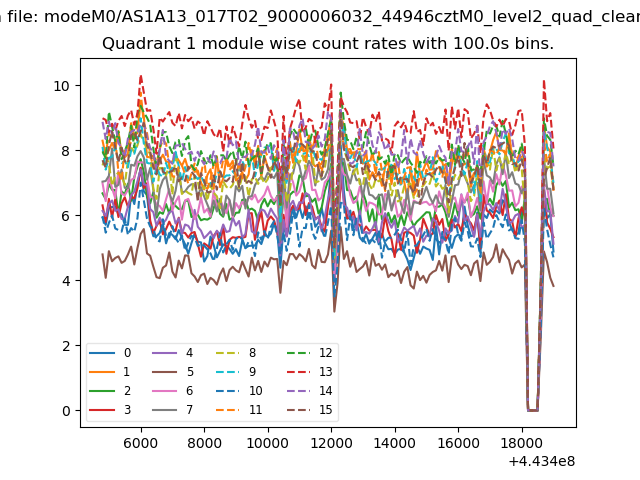
| Module-wise count rates for Quadrant A Data is divided into 100 sec bins |
 |
 |
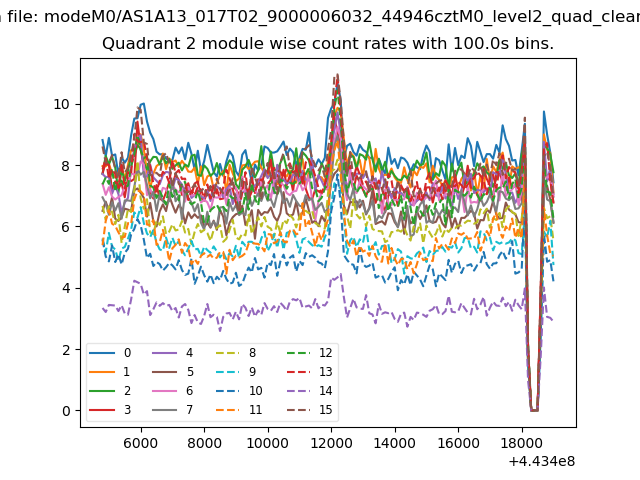
| Module-wise count rates for Quadrant B Data is divided into 100 sec bins |
 |
 |
| Module-wise count rates for Quadrant C Data is divided into 100 sec bins |
 |
 |
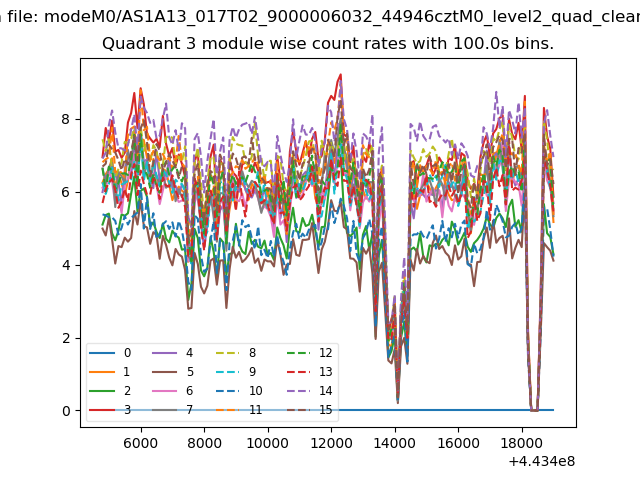
| Module-wise count rates for Quadrant D Data is divided into 100 sec bins |
 |
 |
| Parameter | Plot |
|---|---|
| CZT HV Monitor | 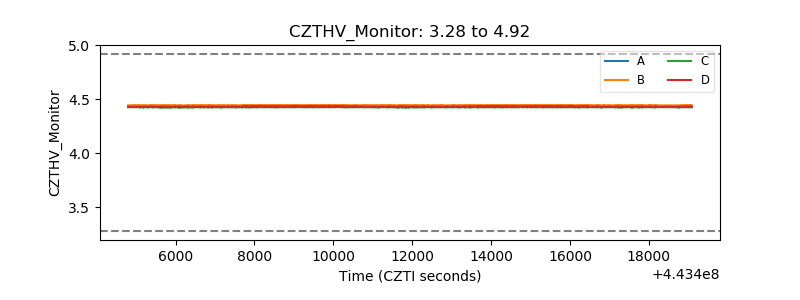 |
| D_VDD | 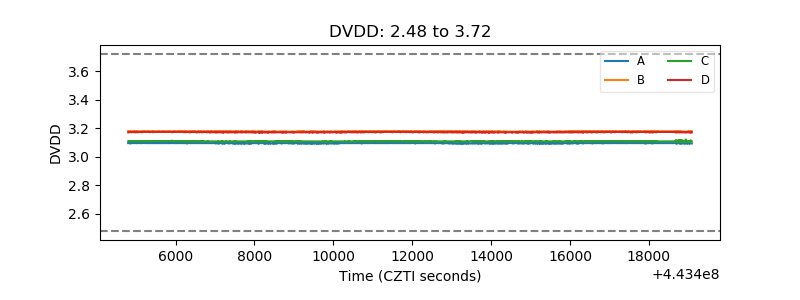 |
| Temperature 1 | 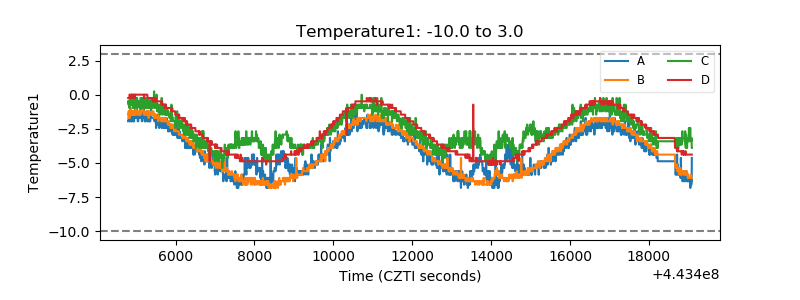 |
| Veto HV Monitor | 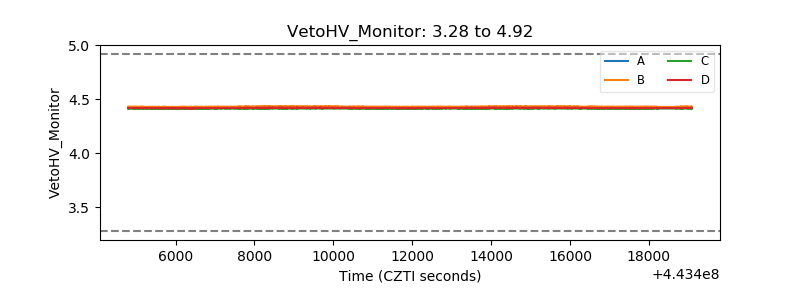 |
| Veto LLD | 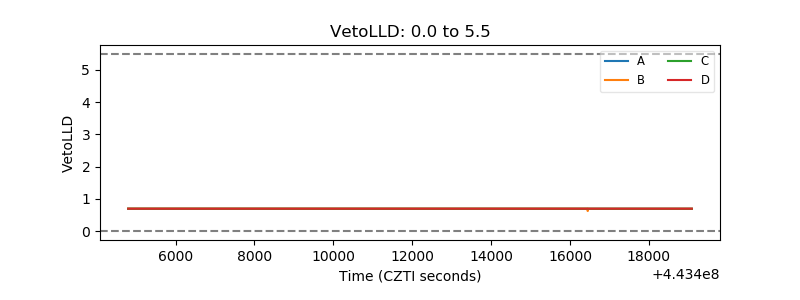 |
| Alpha Counter | 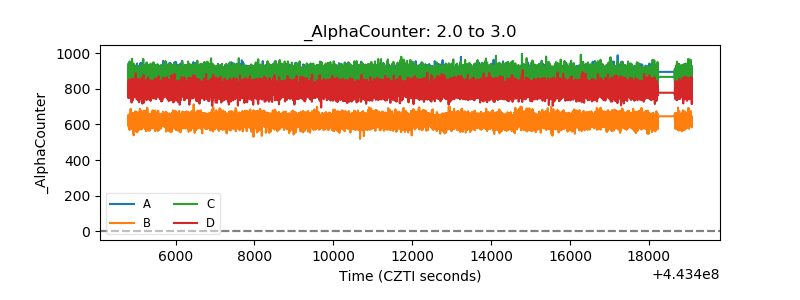 |
| _CPM_Rate | 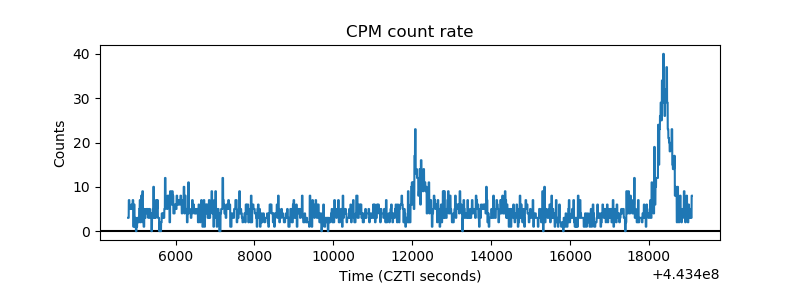 |
| CZT Counter | 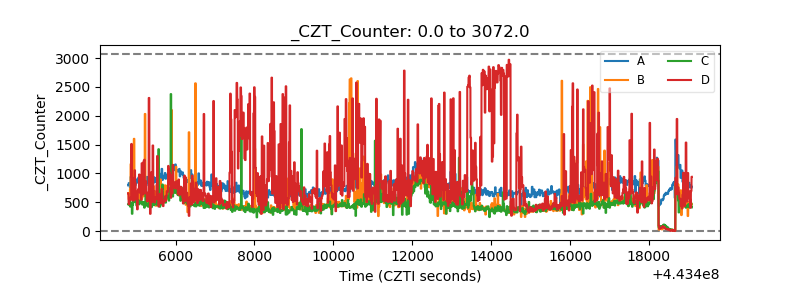 |
| +2.5 Volts monitor | 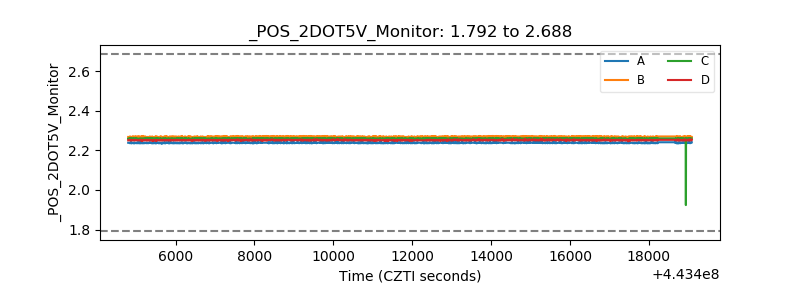 |
| +5 Volts monitor | 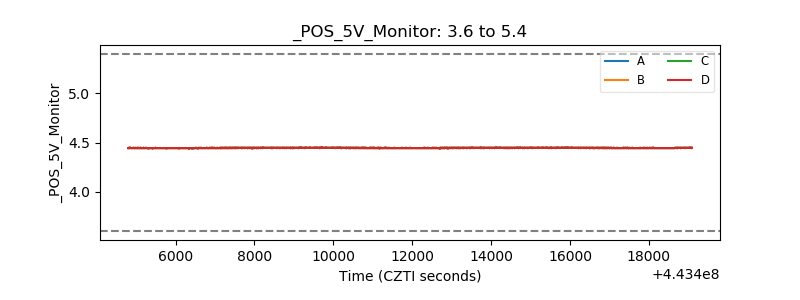 |
| _ROLL_ROT | 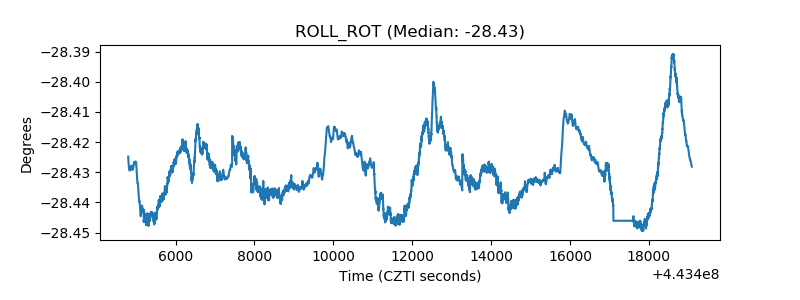 |
| _Roll_DEC | 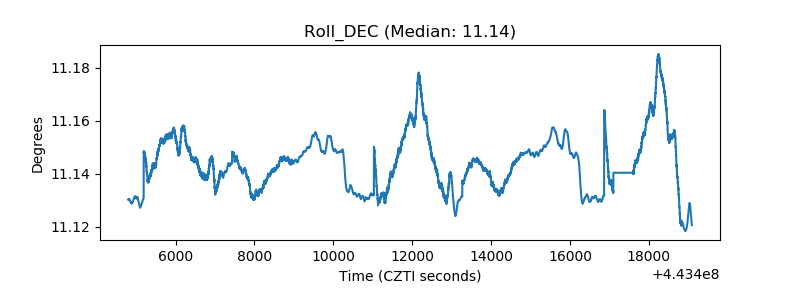 |
| _Roll_RA |  |
| Veto Counter | 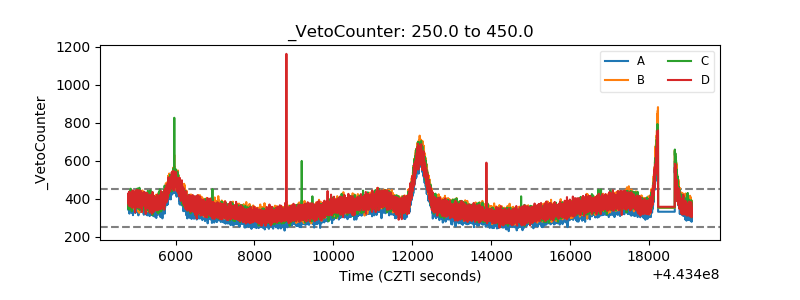 |