| Param | Original file | Final file |
|---|---|---|
| Filename | modeM0/AS1A13_017T02_9000006032_44947cztM0_level2.fits | modeM0/AS1A13_017T02_9000006032_44947cztM0_level2_quad_clean.evt |
| Size (bytes) | 991,330,560 | 197,588,160 |
| Size | 945.4 MB | 188.4 MB |
| Events in quadrant A | 9,803,533 | 1,342,496 |
| Events in quadrant B | 7,586,938 | 1,365,048 |
| Events in quadrant C | 5,771,434 | 1,361,707 |
| Events in quadrant D | 12,540,907 | 1,026,151 |
| Mode SS | |||
|---|---|---|---|
| Quadrant | BADHDUFLAG | Total packets | Discarded packets |
| A | 0 | 262 | 0 |
| B | 0 | 262 | 0 |
| C | 0 | 262 | 0 |
| D | 0 | 262 | 0 |
| Mode M0 | |||
|---|---|---|---|
| Quadrant | BADHDUFLAG | Total packets | Discarded packets |
| A | 0 | 39378 | 3 |
| B | 0 | 31340 | 3 |
| C | 0 | 26617 | 3 |
| D | 0 | 46194 | 3 |
| Mode M9 | |||
|---|---|---|---|
| Quadrant | BADHDUFLAG | Total packets | Discarded packets |
| A | 0 | 19 | 0 |
| B | 0 | 19 | 0 |
| C | 0 | 19 | 0 |
| D | 0 | 19 | 0 |
| Quadrant | Total seconds | Saturated seconds | Saturation percentage |
|---|---|---|---|
| A | 12829 | 300 | 2.338452% |
| B | 12829 | 590 | 4.598955% |
| C | 12830 | 95 | 0.740452% |
| D | 12830 | 2205 | 17.186282% |
Noise dominated data is calculated using 1-second bins in cleaned event files. If a bin has >2000 counts, and if more than 50% of those come from <1% of pixels, then it is considered to be noise-dominated and hence unusable.
| Quadrant | # 1 sec bins | Bins with >0 counts | Bins with >2000 counts | High rate bins dominated by noise | Noise dominated (total time) | Noise dominated (detector-on time) | Marked lightcurve |
|---|---|---|---|---|---|---|---|
| A | 14659 | 12832 | 4 | 4 | 0.03% | 0.03% | 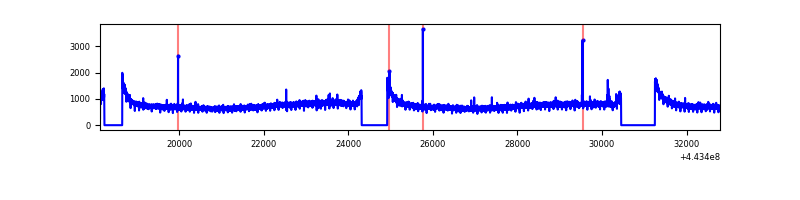 |
| B | 14659 | 12832 | 286 | 286 | 1.95% | 2.23% | 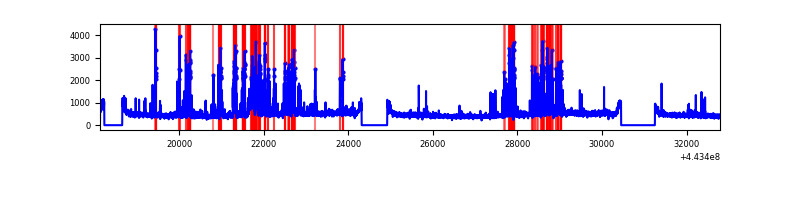 |
| C | 14660 | 12833 | 11 | 11 | 0.08% | 0.09% | 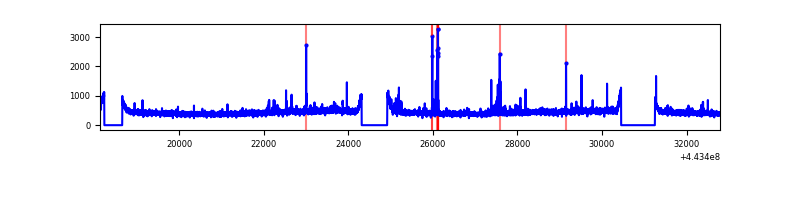 |
| D | 14660 | 12833 | 1718 | 1718 | 11.72% | 13.39% | 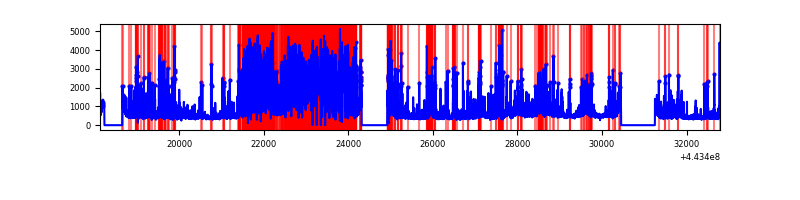 |
Top three noisy pixels from each quadrant. If the there are fewer than three noisy pixels in the level2.evt file, extra rows are filled as -1
| Pixel properties | Quadrant properties | ||||||
|---|---|---|---|---|---|---|---|
| Quadrant | DetID | PixID | Counts | Sigma | Mean | Median | Sigma |
| A | 10 | 83 | 4158714 | 13737.32 | 1446 | 1414 | 302.6 |
| A | 3 | 137 | 16726 | 50.6 | 1446 | 1414 | 302.6 |
| A | 13 | 254 | 14045 | 41.74 | 1446 | 1414 | 302.6 |
| B | 0 | 190 | 701079 | 2450.94 | 1436 | 1392 | 285.5 |
| B | 5 | 172 | 460343 | 1607.66 | 1436 | 1392 | 285.5 |
| B | 4 | 171 | 173170 | 601.72 | 1436 | 1392 | 285.5 |
| C | 3 | 233 | 57769 | 167.79 | 1430 | 1438 | 335.7 |
| C | 1 | 3 | 57626 | 167.37 | 1430 | 1438 | 335.7 |
| C | 1 | 241 | 50370 | 145.75 | 1430 | 1438 | 335.7 |
| D | 1 | 52 | 2951879 | 9006.69 | 1298 | 1259 | 327.6 |
| D | 13 | 249 | 1217667 | 3713.05 | 1298 | 1259 | 327.6 |
| D | 12 | 233 | 1044436 | 3184.27 | 1298 | 1259 | 327.6 |
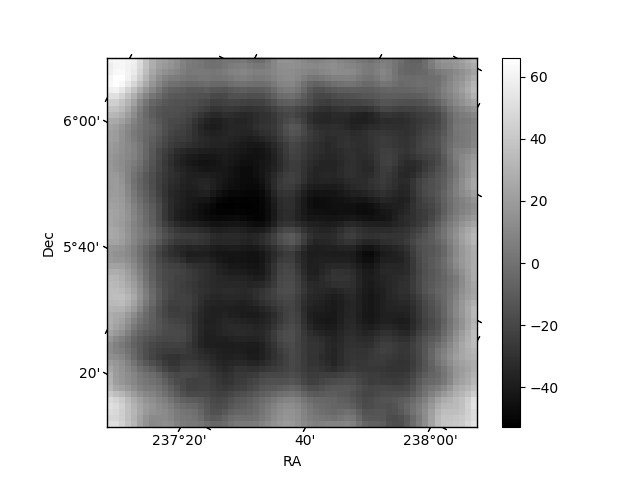
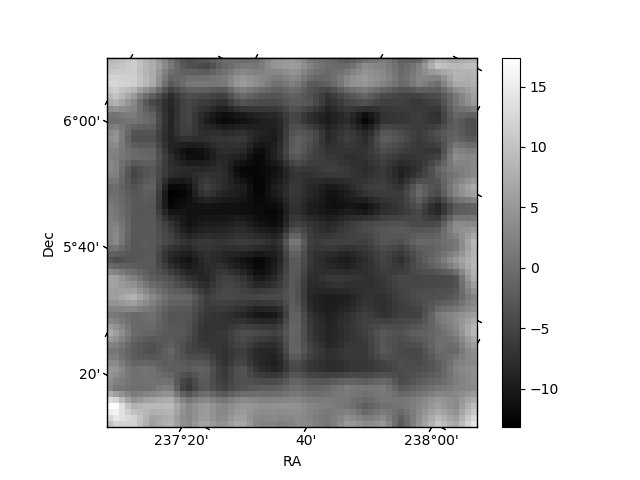
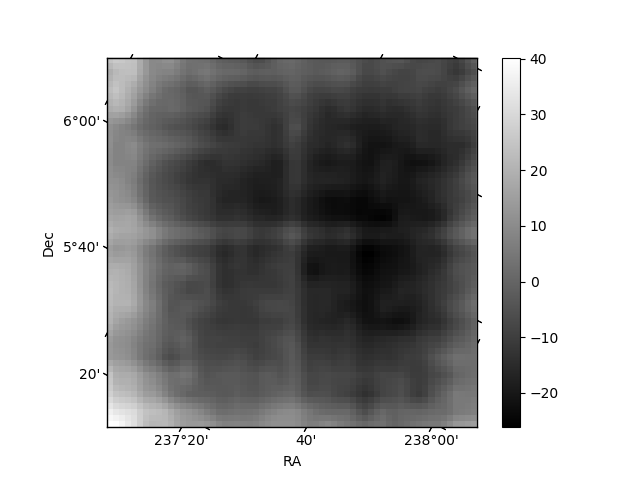
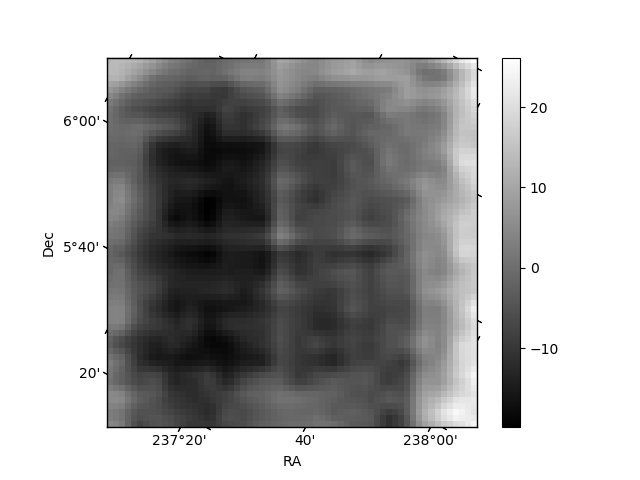
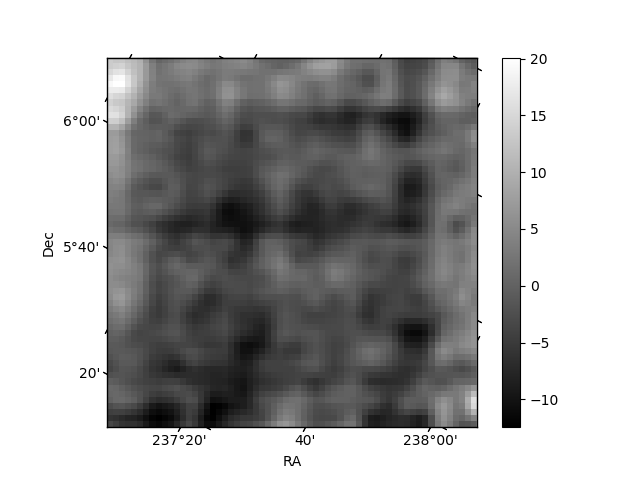
Histogram calculated using DETX and DETY for each event in the final _common_clean file
| Quadrant A | 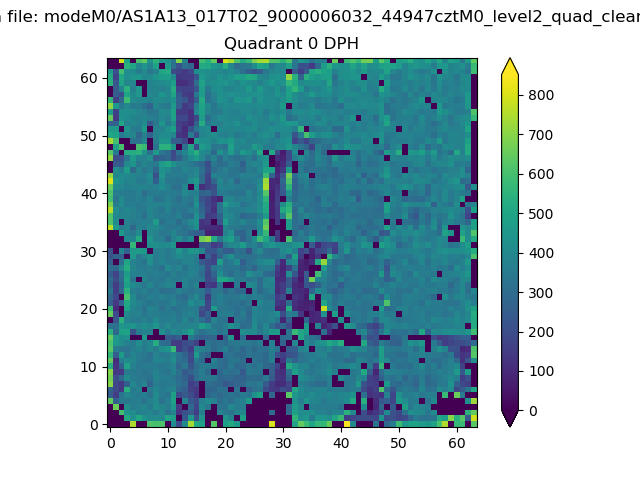 |
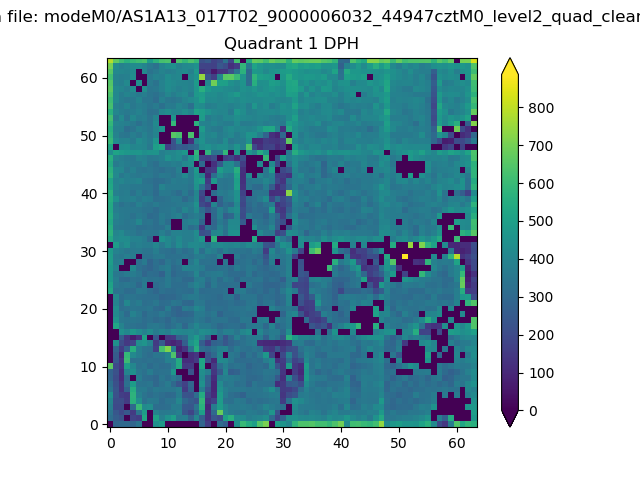 |
Quadrant B |
|---|---|---|---|
| Quadrant D | 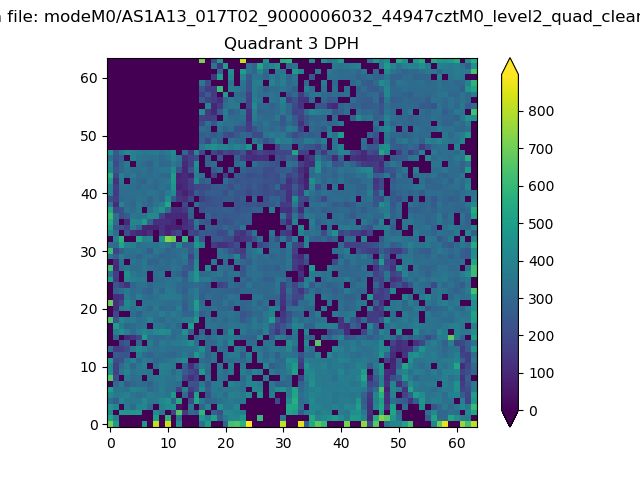 |
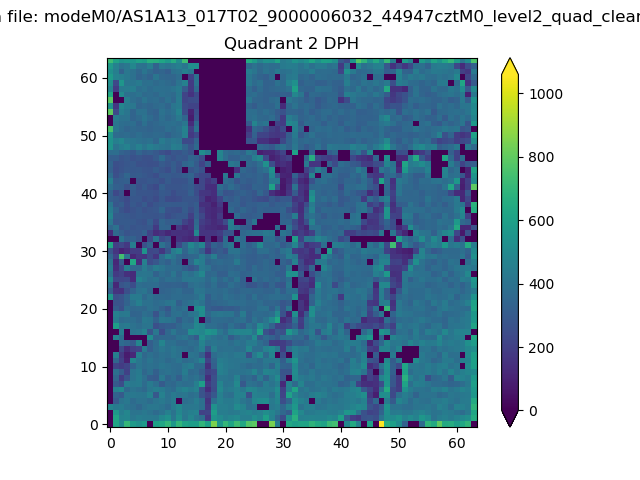 |
Quadrant C |
| Plot type | Count rate plots | Images |
|---|---|---|
| Comparison with Poisson distribution Blue bars denote a histogram of data divided into 1 sec bins. Red curve is a Poisson curve with rate = median count rate of data. |
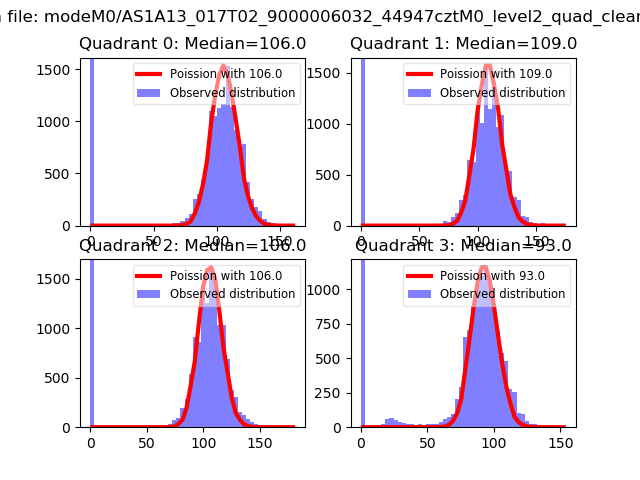 |
 |
| Quadrant-wise count rates Data is divided into 100 sec bins |
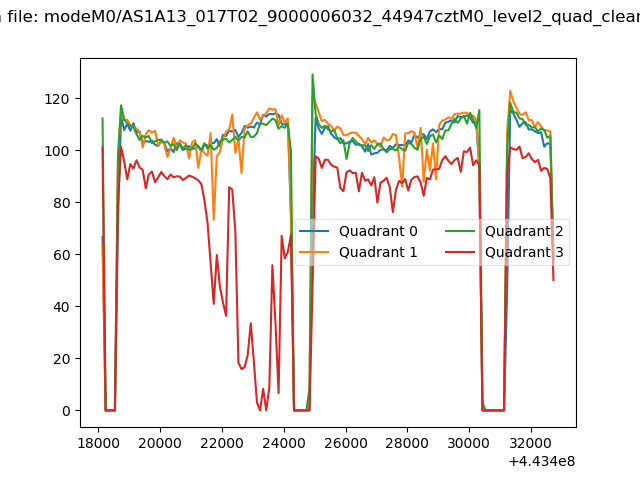 |
|
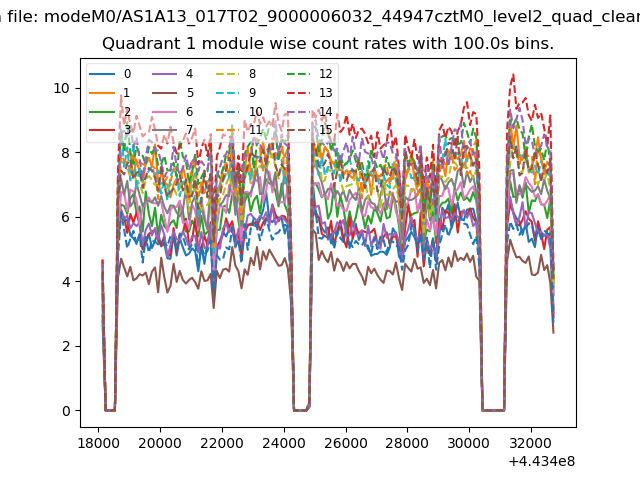
| Module-wise count rates for Quadrant A Data is divided into 100 sec bins |
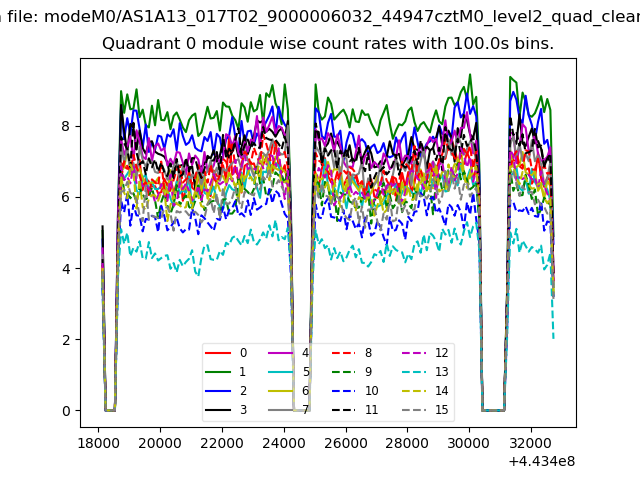 |
 |
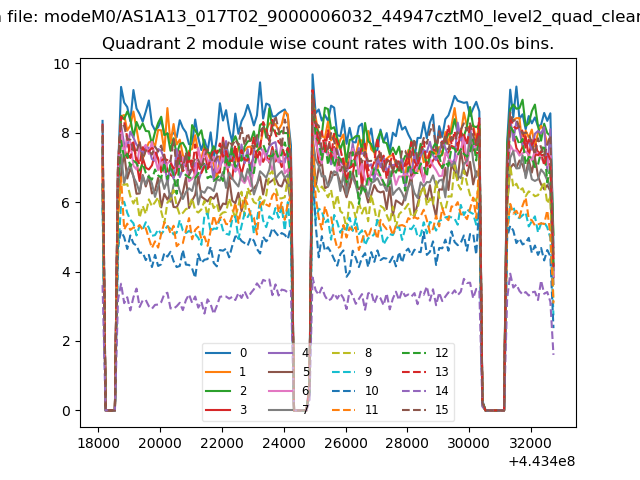
| Module-wise count rates for Quadrant B Data is divided into 100 sec bins |
 |
 |
| Module-wise count rates for Quadrant C Data is divided into 100 sec bins |
 |
 |
| Module-wise count rates for Quadrant D Data is divided into 100 sec bins |
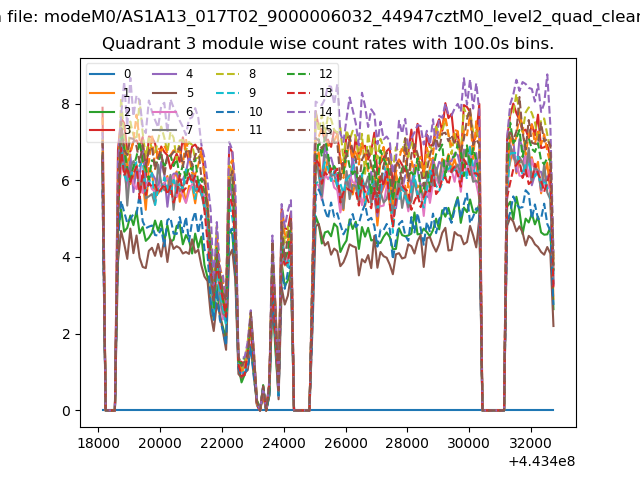 |
 |
| Parameter | Plot |
|---|---|
| CZT HV Monitor | 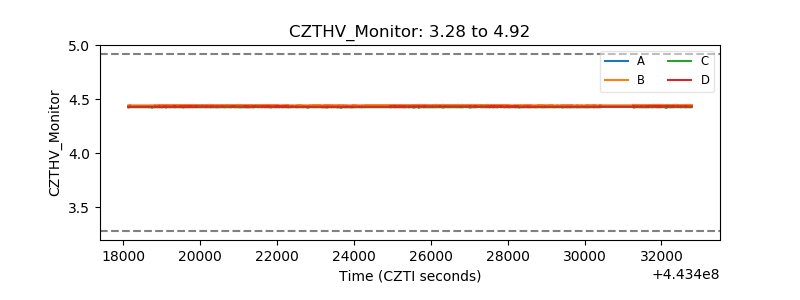 |
| D_VDD | 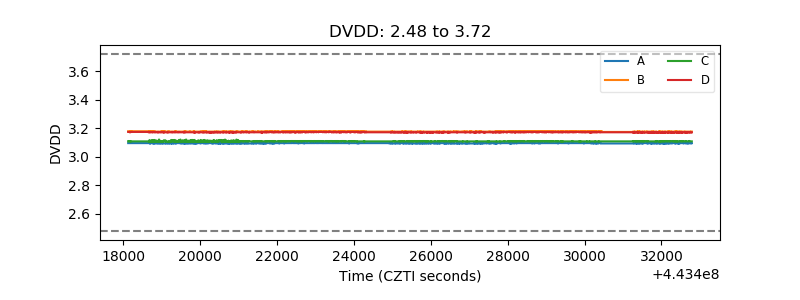 |
| Temperature 1 | 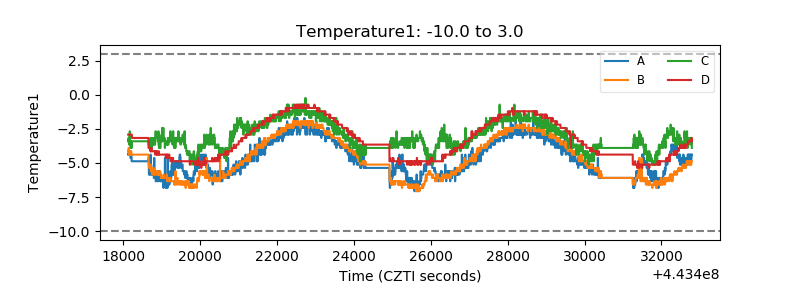 |
| Veto HV Monitor | 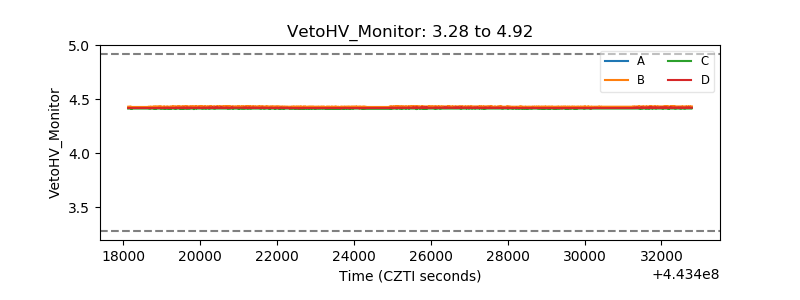 |
| Veto LLD | 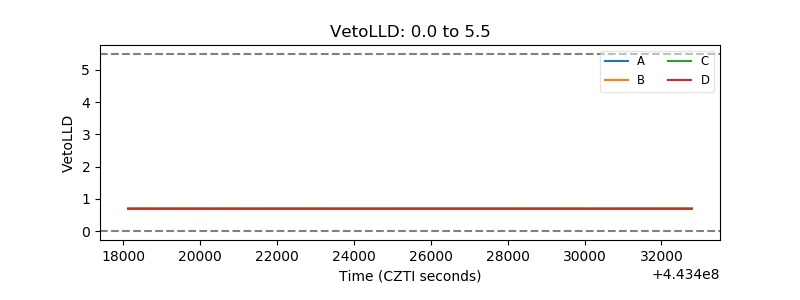 |
| Alpha Counter | 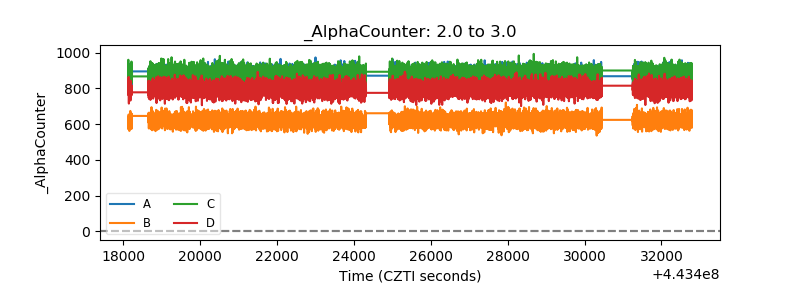 |
| _CPM_Rate | 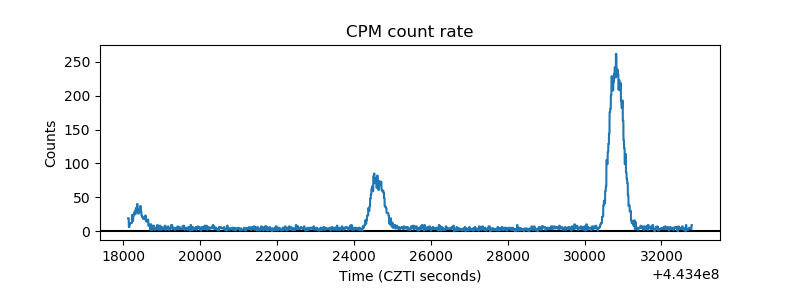 |
| CZT Counter | 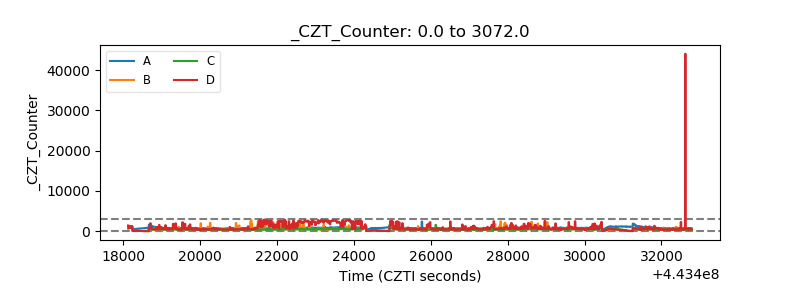 |
| +2.5 Volts monitor | 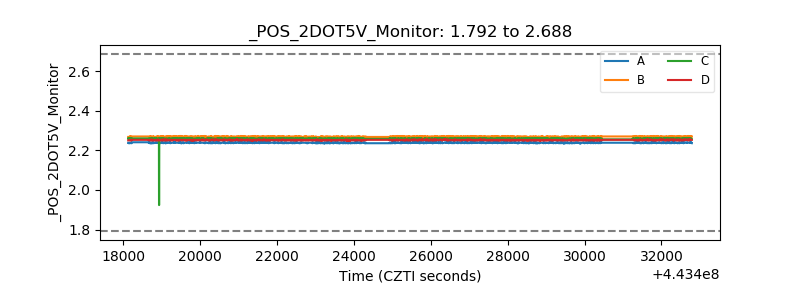 |
| +5 Volts monitor | 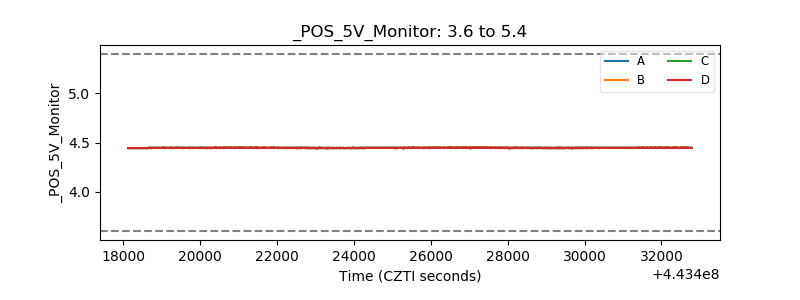 |
| _ROLL_ROT | 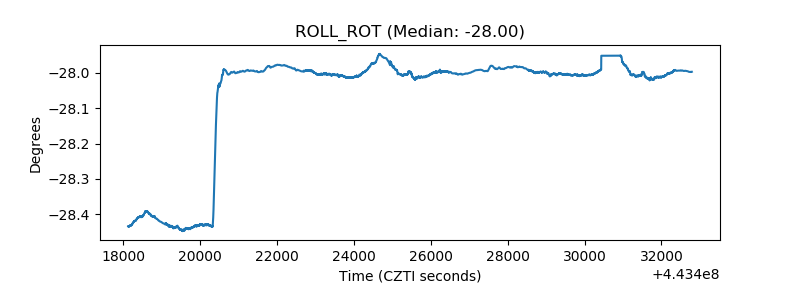 |
| _Roll_DEC | 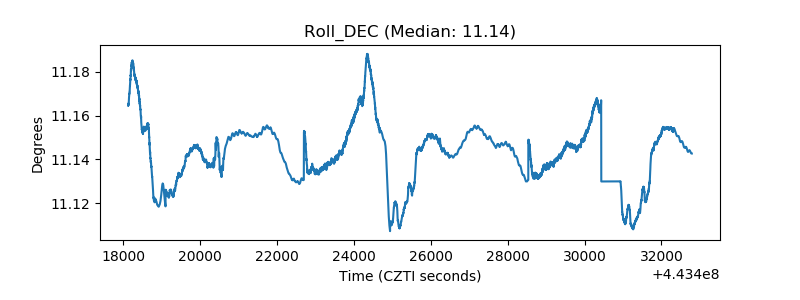 |
| _Roll_RA | 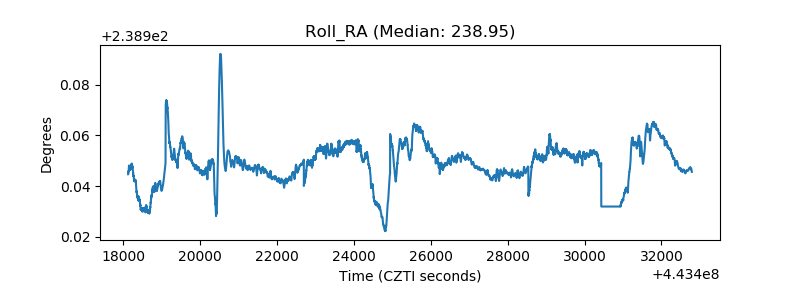 |
| Veto Counter |  |