| Param | Original file | Final file |
|---|---|---|
| Filename | modeM0/AS1A13_017T02_9000006032_44948cztM0_level2.fits | modeM0/AS1A13_017T02_9000006032_44948cztM0_level2_quad_clean.evt |
| Size (bytes) | 431,426,880 | 100,134,720 |
| Size | 411.4 MB | 95.5 MB |
| Events in quadrant A | 4,807,323 | 662,497 |
| Events in quadrant B | 3,491,546 | 683,586 |
| Events in quadrant C | 2,735,195 | 670,478 |
| Events in quadrant D | 4,456,287 | 584,280 |
| Mode SS | |||
|---|---|---|---|
| Quadrant | BADHDUFLAG | Total packets | Discarded packets |
| A | 0 | 126 | 0 |
| B | 0 | 126 | 0 |
| C | 0 | 126 | 0 |
| D | 0 | 126 | 0 |
| Mode M0 | |||
|---|---|---|---|
| Quadrant | BADHDUFLAG | Total packets | Discarded packets |
| A | 0 | 19035 | 1 |
| B | 0 | 14586 | 1 |
| C | 0 | 12569 | 1 |
| D | 0 | 17431 | 1 |
| Mode M9 | |||
|---|---|---|---|
| Quadrant | BADHDUFLAG | Total packets | Discarded packets |
| A | 0 | 10 | 0 |
| B | 0 | 10 | 0 |
| C | 0 | 10 | 0 |
| D | 0 | 10 | 0 |
| Quadrant | Total seconds | Saturated seconds | Saturation percentage |
|---|---|---|---|
| A | 6173 | 96 | 1.555160% |
| B | 6173 | 183 | 2.964523% |
| C | 6174 | 32 | 0.518303% |
| D | 6174 | 347 | 5.620343% |
Noise dominated data is calculated using 1-second bins in cleaned event files. If a bin has >2000 counts, and if more than 50% of those come from <1% of pixels, then it is considered to be noise-dominated and hence unusable.
| Quadrant | # 1 sec bins | Bins with >0 counts | Bins with >2000 counts | High rate bins dominated by noise | Noise dominated (total time) | Noise dominated (detector-on time) | Marked lightcurve |
|---|---|---|---|---|---|---|---|
| A | 7148 | 6174 | 2 | 2 | 0.03% | 0.03% | 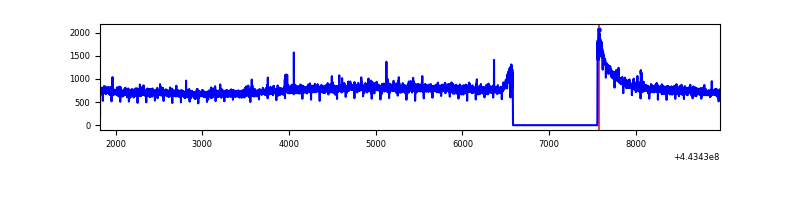 |
| B | 7148 | 6174 | 74 | 74 | 1.04% | 1.20% | 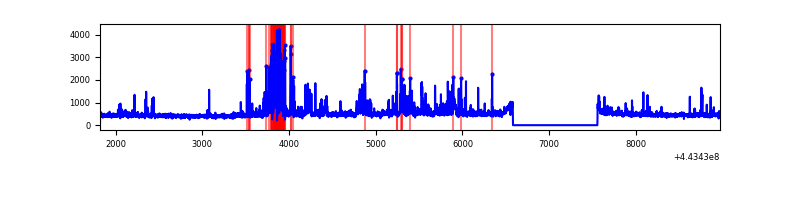 |
| C | 7149 | 6175 | 1 | 1 | 0.01% | 0.02% | 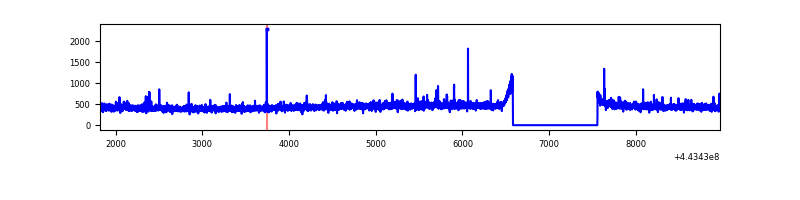 |
| D | 7149 | 6175 | 258 | 258 | 3.61% | 4.18% | 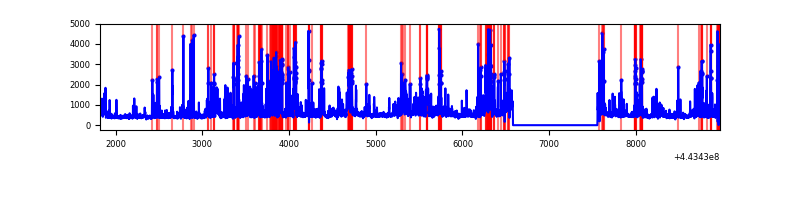 |
Top three noisy pixels from each quadrant. If the there are fewer than three noisy pixels in the level2.evt file, extra rows are filled as -1
| Pixel properties | Quadrant properties | ||||||
|---|---|---|---|---|---|---|---|
| Quadrant | DetID | PixID | Counts | Sigma | Mean | Median | Sigma |
| A | 10 | 83 | 2087309 | 14323.66 | 695 | 680 | 145.7 |
| A | 7 | 3 | 25487 | 170.29 | 695 | 680 | 145.7 |
| A | 3 | 137 | 7844 | 49.18 | 695 | 680 | 145.7 |
| B | 5 | 172 | 303395 | 2210.54 | 688 | 668 | 136.9 |
| B | 4 | 171 | 243758 | 1775.07 | 688 | 668 | 136.9 |
| B | 5 | 255 | 64784 | 468.18 | 688 | 668 | 136.9 |
| C | 1 | 3 | 19748 | 117.21 | 686 | 690 | 162.6 |
| C | 0 | 207 | 19182 | 113.73 | 686 | 690 | 162.6 |
| C | 3 | 233 | 14330 | 83.89 | 686 | 690 | 162.6 |
| D | 13 | 249 | 845084 | 4994.45 | 670 | 651 | 169.1 |
| D | 1 | 52 | 315789 | 1863.9 | 670 | 651 | 169.1 |
| D | 5 | 235 | 177376 | 1045.25 | 670 | 651 | 169.1 |
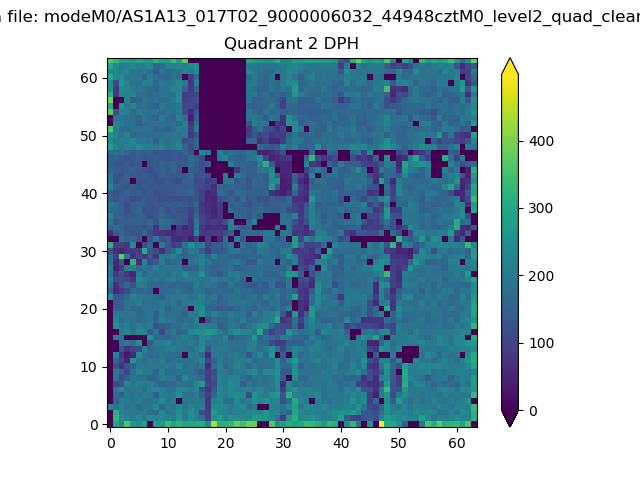
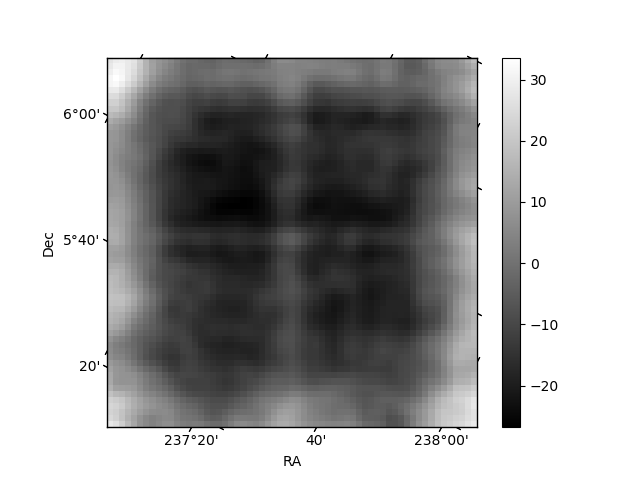
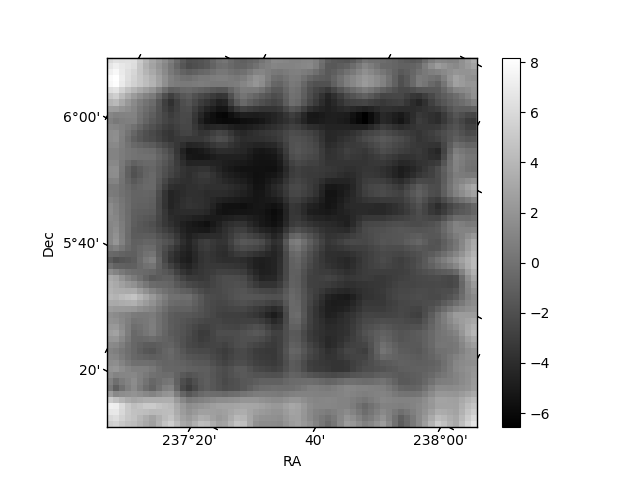
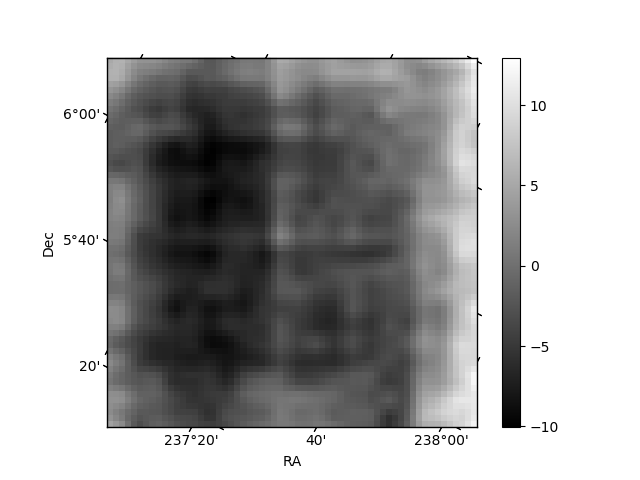
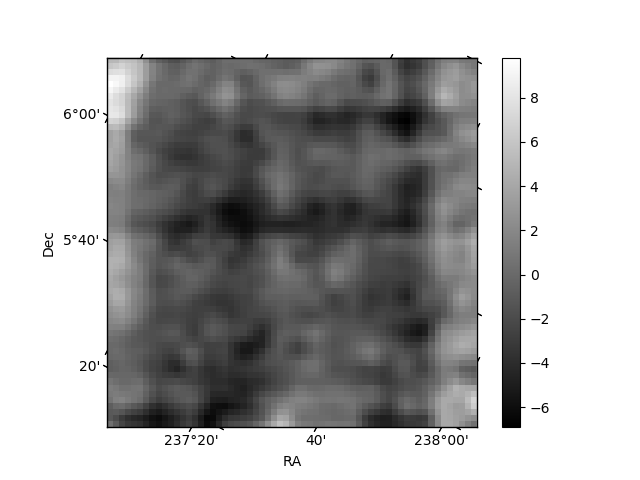
Histogram calculated using DETX and DETY for each event in the final _common_clean file
| Quadrant A | 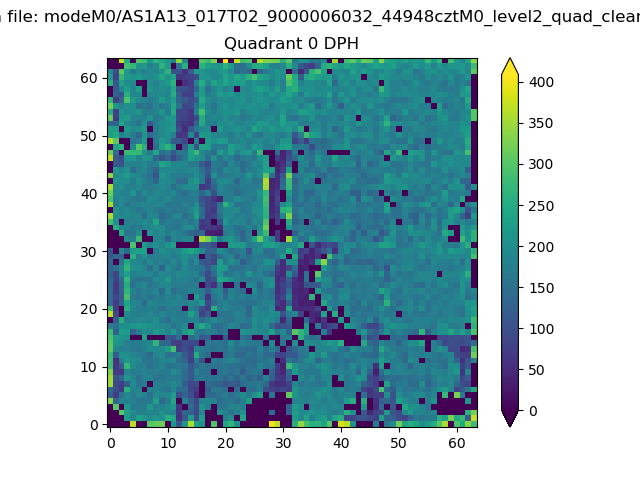 |
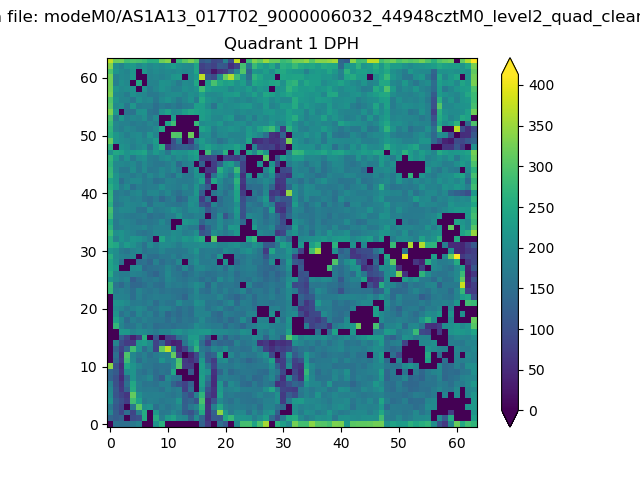 |
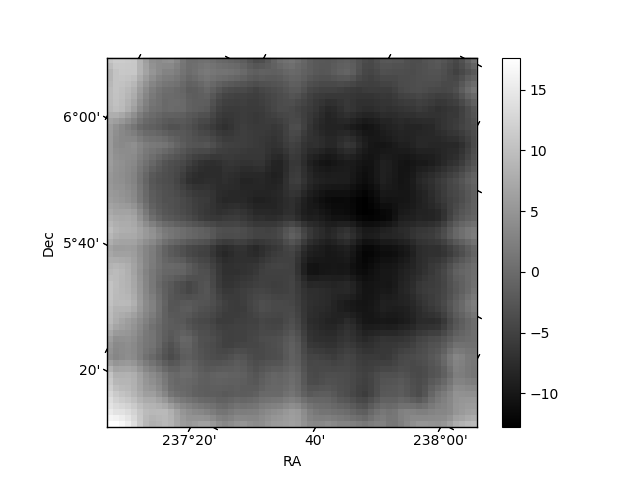
Quadrant B |
|---|---|---|---|
| Quadrant D | 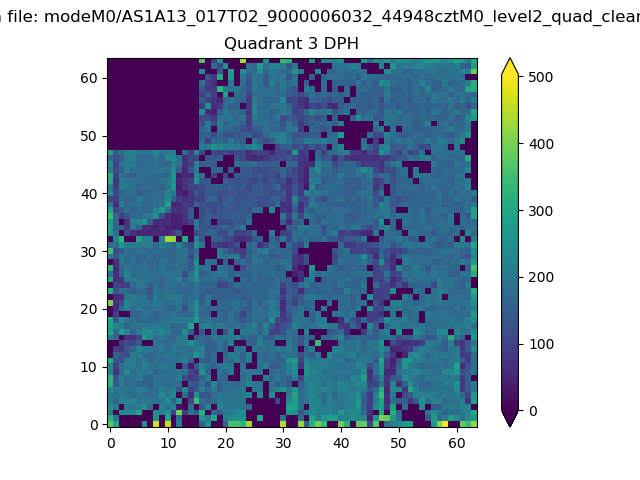 |
 |
Quadrant C |
| Plot type | Count rate plots | Images |
|---|---|---|
| Comparison with Poisson distribution Blue bars denote a histogram of data divided into 1 sec bins. Red curve is a Poisson curve with rate = median count rate of data. |
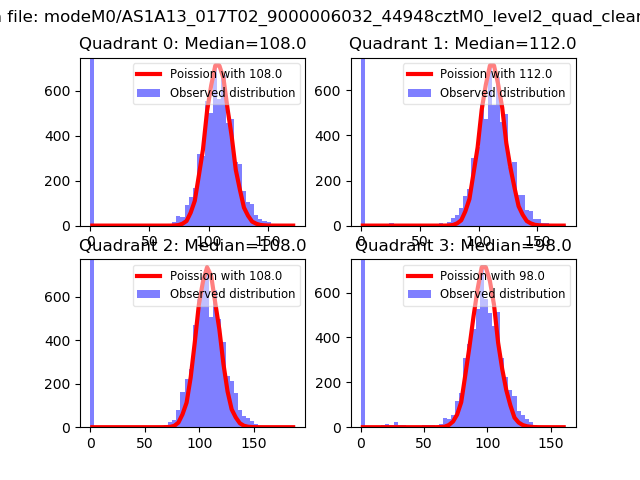 |
 |
| Quadrant-wise count rates Data is divided into 100 sec bins |
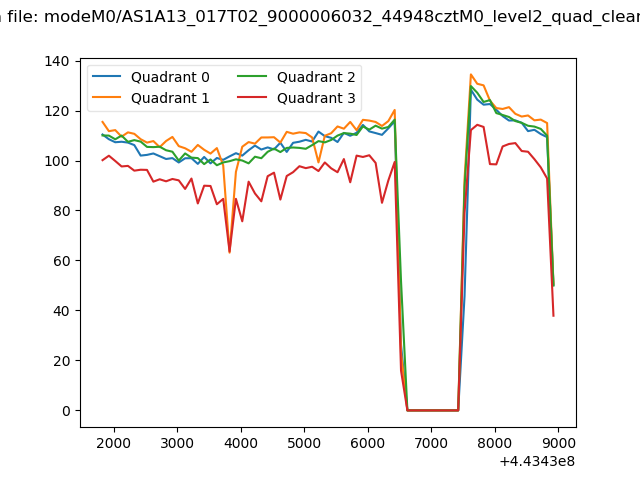 |
|
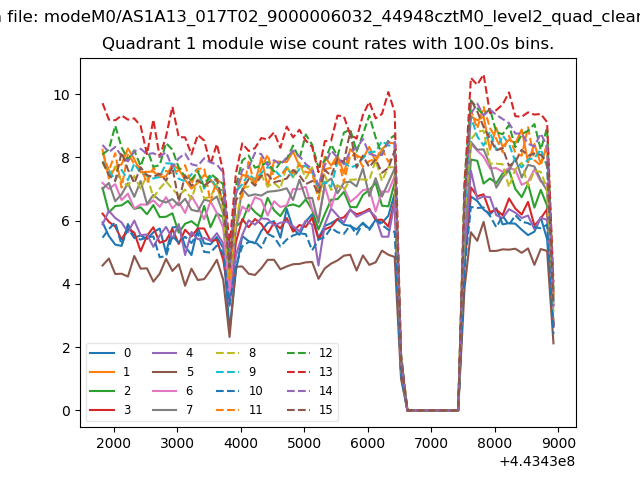
| Module-wise count rates for Quadrant A Data is divided into 100 sec bins |
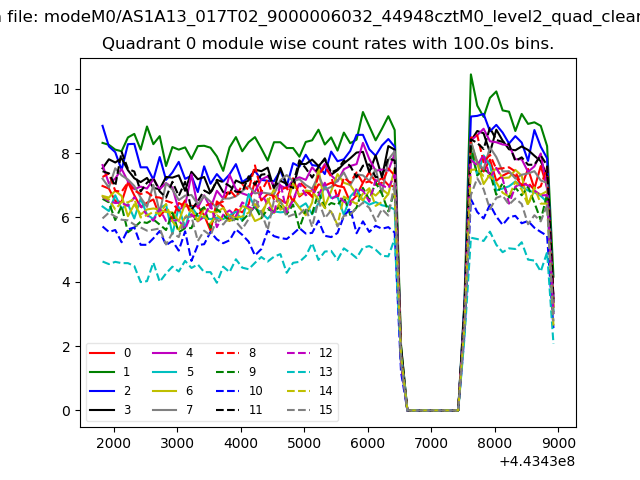 |
 |
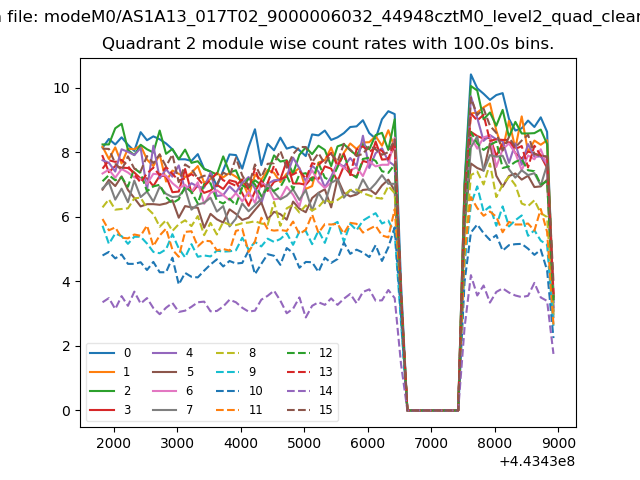
| Module-wise count rates for Quadrant B Data is divided into 100 sec bins |
 |
 |
| Module-wise count rates for Quadrant C Data is divided into 100 sec bins |
 |
 |
| Module-wise count rates for Quadrant D Data is divided into 100 sec bins |
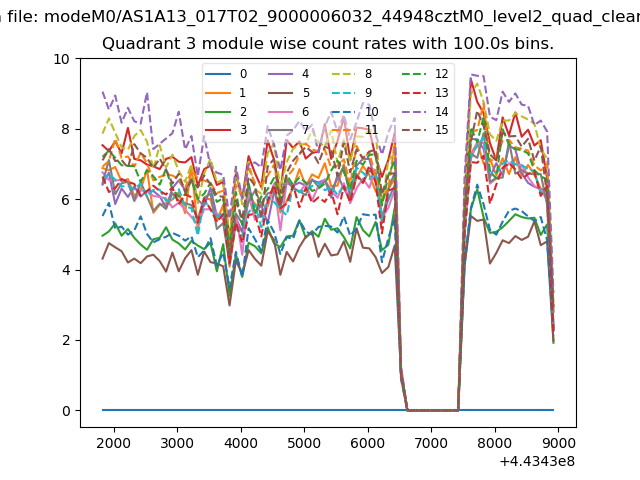 |
 |
| Parameter | Plot |
|---|---|
| CZT HV Monitor | 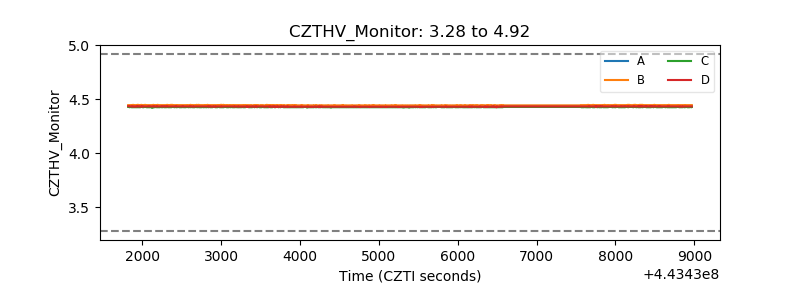 |
| D_VDD | 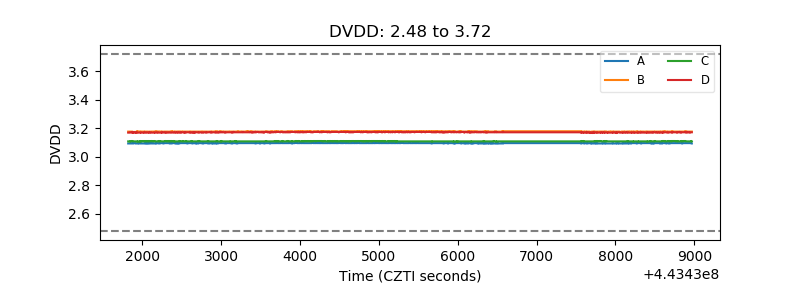 |
| Temperature 1 | 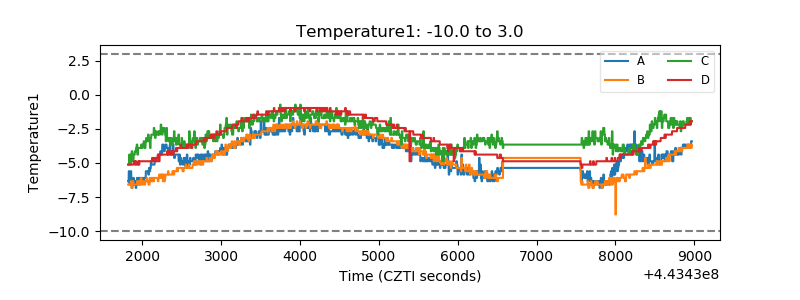 |
| Veto HV Monitor | 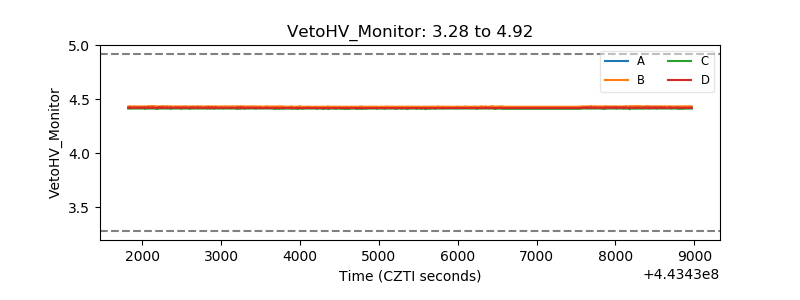 |
| Veto LLD | 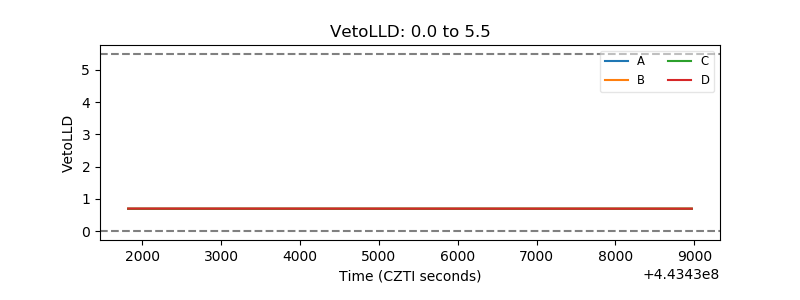 |
| Alpha Counter | 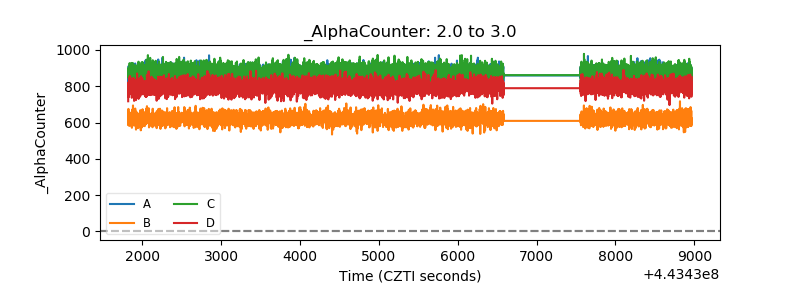 |
| _CPM_Rate | 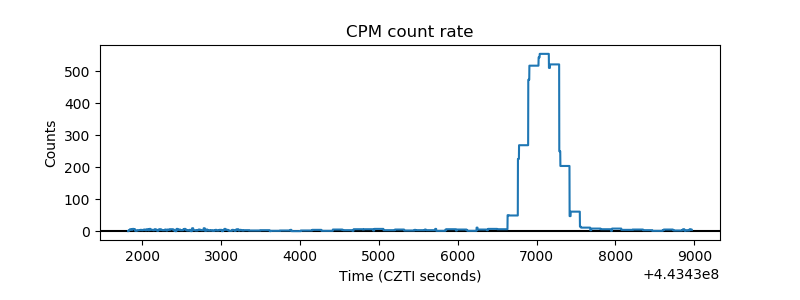 |
| CZT Counter | 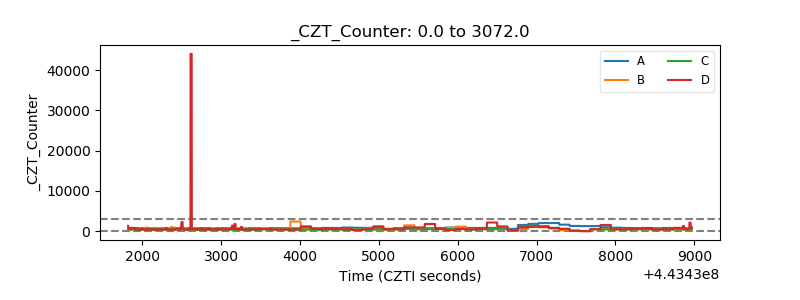 |
| +2.5 Volts monitor | 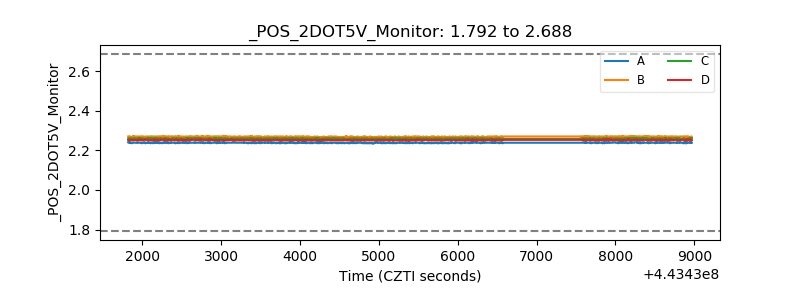 |
| +5 Volts monitor | 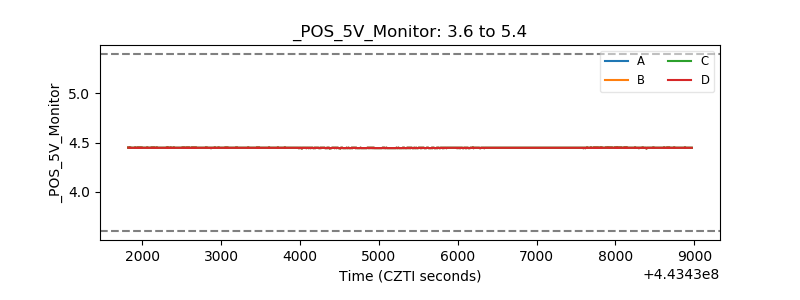 |
| _ROLL_ROT | 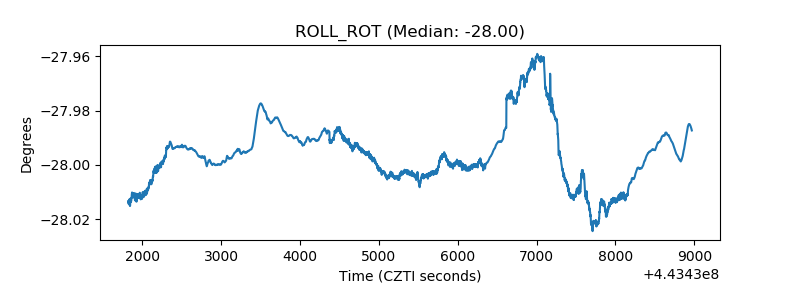 |
| _Roll_DEC | 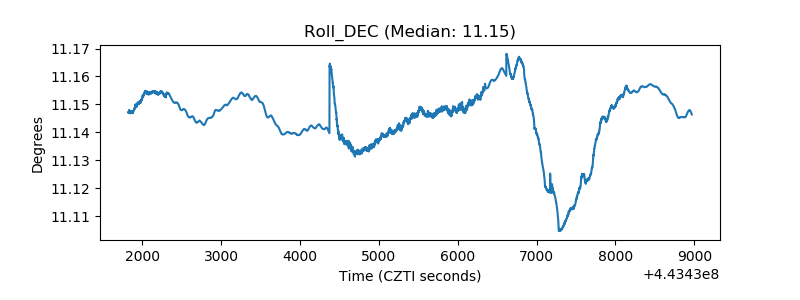 |
| _Roll_RA | 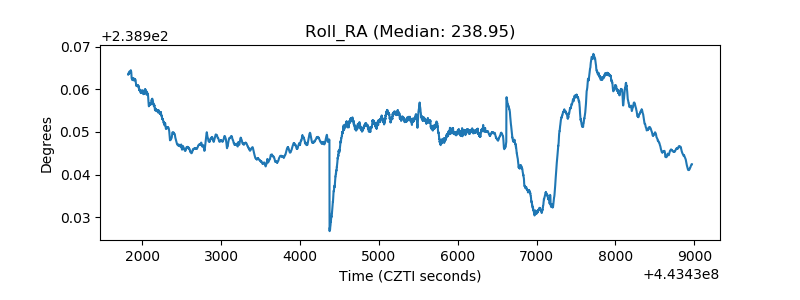 |
| Veto Counter | 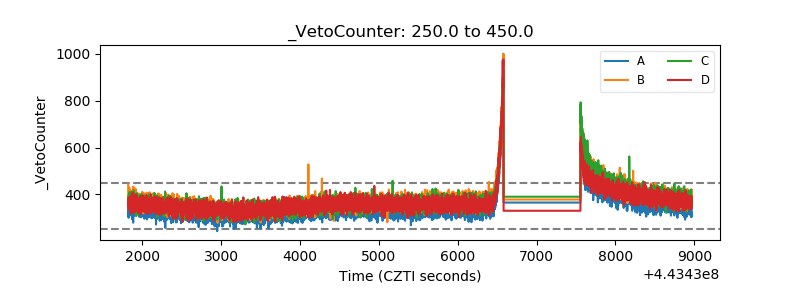 |