| Param | Original file | Final file |
|---|---|---|
| Filename | modeM0/AS1A13_017T02_9000006032_44950cztM0_level2.fits | modeM0/AS1A13_017T02_9000006032_44950cztM0_level2_quad_clean.evt |
| Size (bytes) | 500,627,520 | 105,819,840 |
| Size | 477.4 MB | 100.9 MB |
| Events in quadrant A | 5,144,486 | 717,470 |
| Events in quadrant B | 3,953,869 | 734,029 |
| Events in quadrant C | 3,398,274 | 705,071 |
| Events in quadrant D | 5,544,850 | 606,569 |
| Mode SS | |||
|---|---|---|---|
| Quadrant | BADHDUFLAG | Total packets | Discarded packets |
| A | 0 | 128 | 0 |
| B | 0 | 128 | 0 |
| C | 0 | 128 | 0 |
| D | 0 | 128 | 0 |
| Mode M0 | |||
|---|---|---|---|
| Quadrant | BADHDUFLAG | Total packets | Discarded packets |
| A | 0 | 19783 | 1 |
| B | 0 | 15879 | 1 |
| C | 0 | 14369 | 1 |
| D | 0 | 20703 | 1 |
| Mode M9 | |||
|---|---|---|---|
| Quadrant | BADHDUFLAG | Total packets | Discarded packets |
| A | 0 | 11 | 0 |
| B | 0 | 11 | 0 |
| C | 0 | 11 | 0 |
| D | 0 | 11 | 0 |
| Quadrant | Total seconds | Saturated seconds | Saturation percentage |
|---|---|---|---|
| A | 6318 | 126 | 1.994302% |
| B | 6319 | 196 | 3.101757% |
| C | 6319 | 159 | 2.516221% |
| D | 6319 | 635 | 10.049058% |
Noise dominated data is calculated using 1-second bins in cleaned event files. If a bin has >2000 counts, and if more than 50% of those come from <1% of pixels, then it is considered to be noise-dominated and hence unusable.
| Quadrant | # 1 sec bins | Bins with >0 counts | Bins with >2000 counts | High rate bins dominated by noise | Noise dominated (total time) | Noise dominated (detector-on time) | Marked lightcurve |
|---|---|---|---|---|---|---|---|
| A | 7403 | 6319 | 12 | 12 | 0.16% | 0.19% | 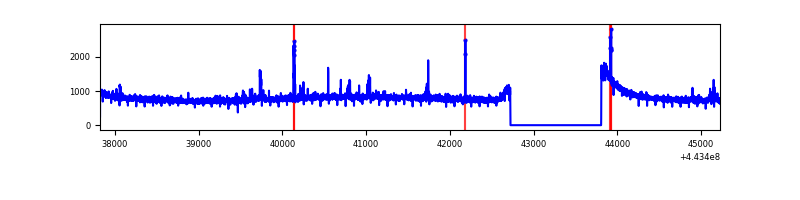 |
| B | 7404 | 6320 | 74 | 74 | 1.00% | 1.17% | 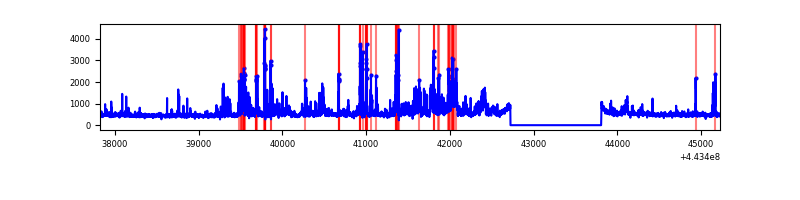 |
| C | 7404 | 6320 | 115 | 115 | 1.55% | 1.82% | 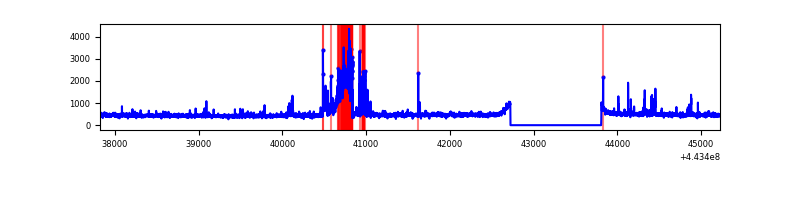 |
| D | 7404 | 6320 | 492 | 492 | 6.65% | 7.78% |  |
Top three noisy pixels from each quadrant. If the there are fewer than three noisy pixels in the level2.evt file, extra rows are filled as -1
| Pixel properties | Quadrant properties | ||||||
|---|---|---|---|---|---|---|---|
| Quadrant | DetID | PixID | Counts | Sigma | Mean | Median | Sigma |
| A | 10 | 83 | 2181890 | 14296.19 | 736 | 720 | 152.6 |
| A | 2 | 79 | 63279 | 410.03 | 736 | 720 | 152.6 |
| A | 13 | 248 | 18792 | 118.45 | 736 | 720 | 152.6 |
| B | 4 | 171 | 490884 | 3398.57 | 729 | 708 | 144.2 |
| B | 5 | 255 | 199581 | 1378.86 | 729 | 708 | 144.2 |
| B | 5 | 172 | 142901 | 985.88 | 729 | 708 | 144.2 |
| C | 15 | 208 | 474178 | 2782.05 | 722 | 727 | 170.2 |
| C | 5 | 4 | 33044 | 189.9 | 722 | 727 | 170.2 |
| C | 0 | 207 | 26683 | 152.52 | 722 | 727 | 170.2 |
| D | 5 | 235 | 705788 | 4037.06 | 702 | 684 | 174.7 |
| D | 13 | 249 | 562768 | 3218.2 | 702 | 684 | 174.7 |
| D | 5 | 171 | 238090 | 1359.26 | 702 | 684 | 174.7 |
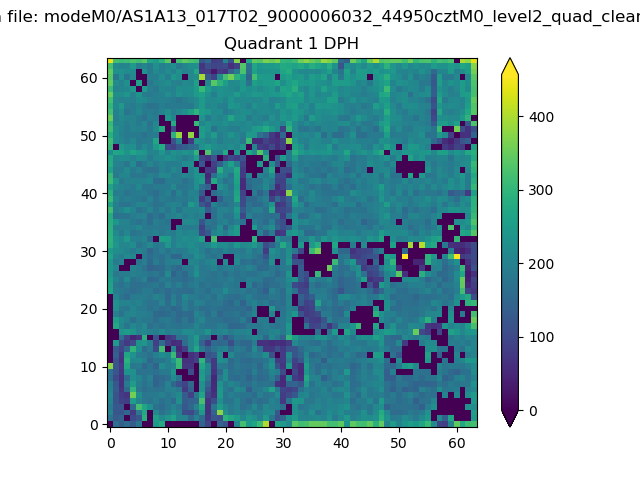
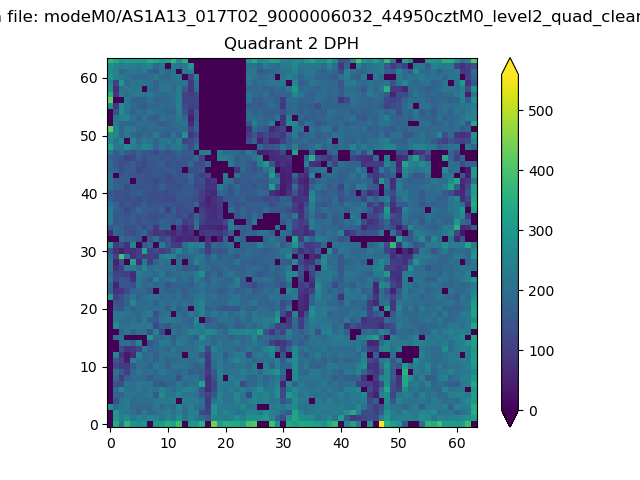
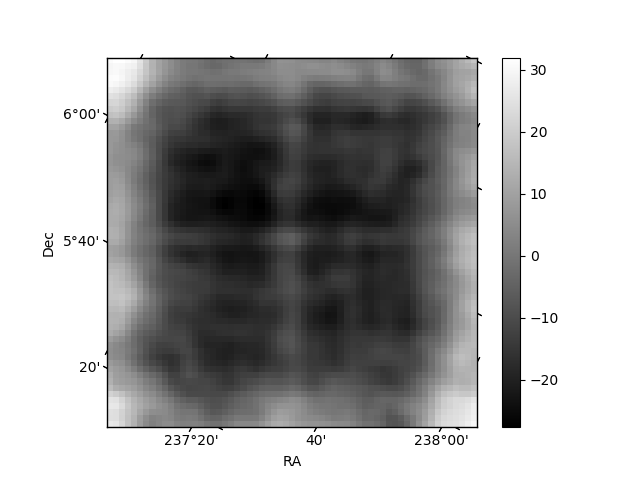
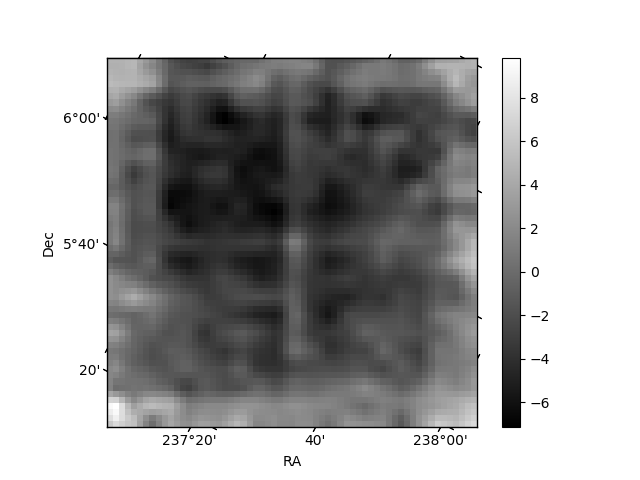
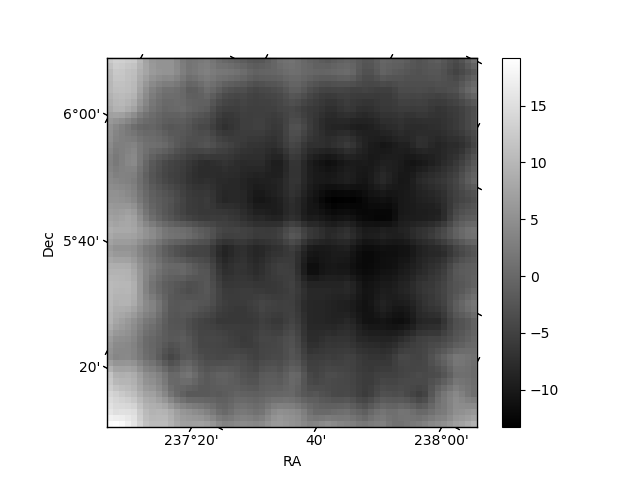
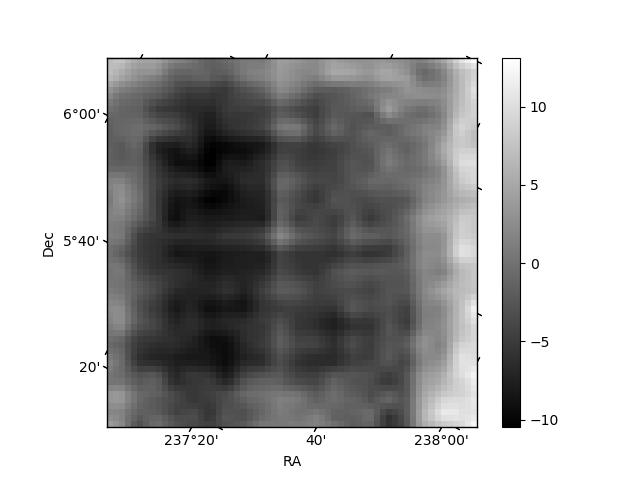
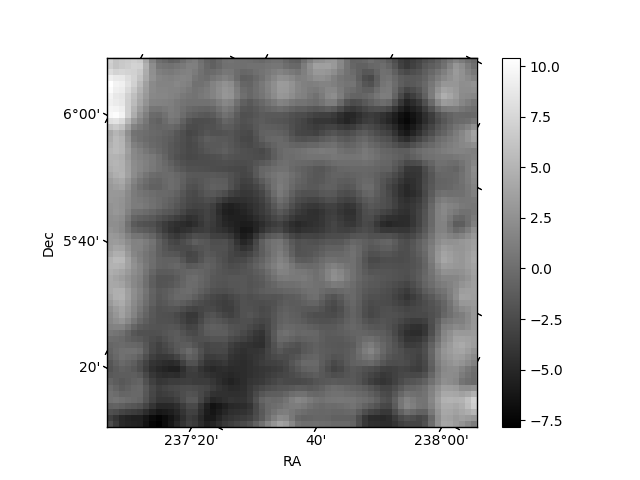
Histogram calculated using DETX and DETY for each event in the final _common_clean file
| Quadrant A | 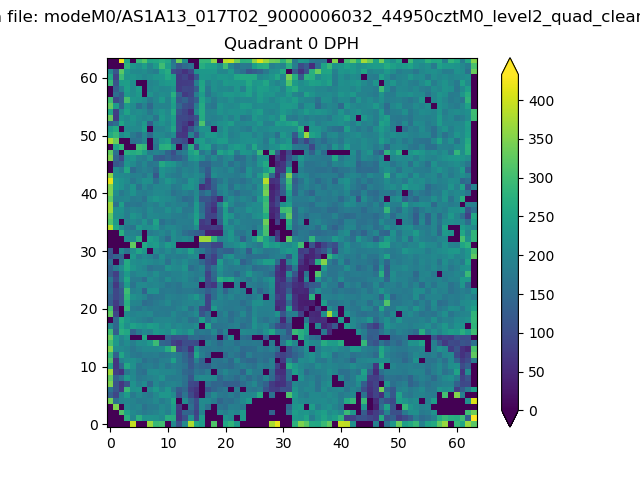 |
 |
Quadrant B |
|---|---|---|---|
| Quadrant D | 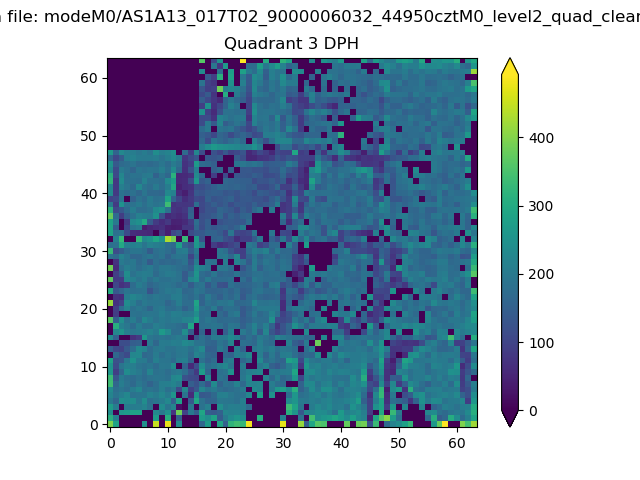 |
 |
Quadrant C |
| Plot type | Count rate plots | Images |
|---|---|---|
| Comparison with Poisson distribution Blue bars denote a histogram of data divided into 1 sec bins. Red curve is a Poisson curve with rate = median count rate of data. |
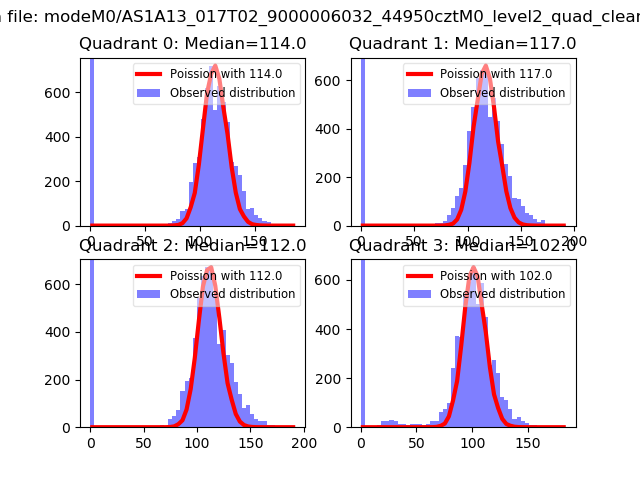 |
 |
| Quadrant-wise count rates Data is divided into 100 sec bins |
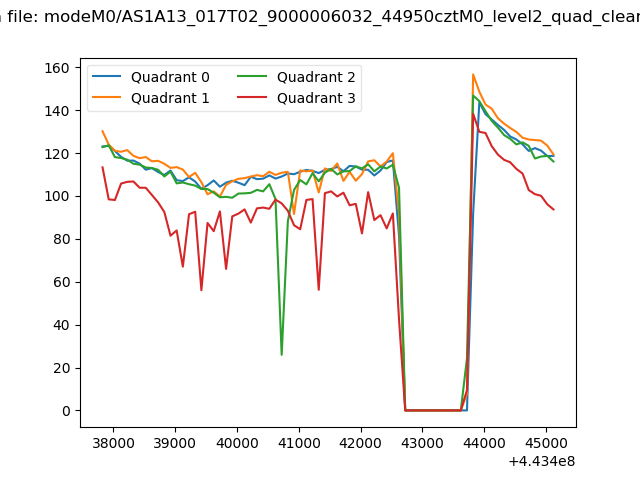 |
|
| Module-wise count rates for Quadrant A Data is divided into 100 sec bins |
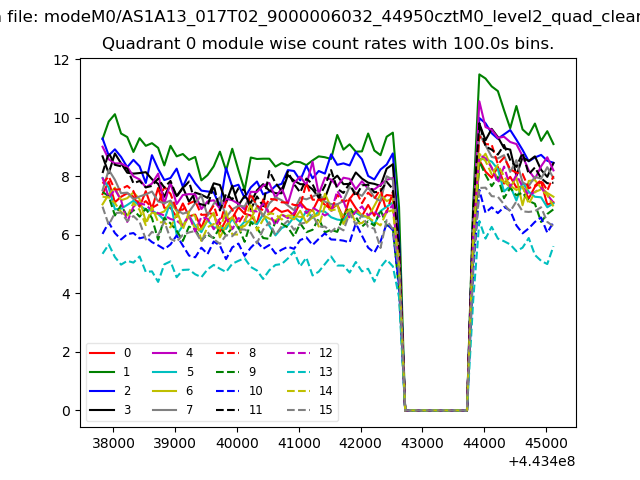 |
 |
| Module-wise count rates for Quadrant B Data is divided into 100 sec bins |
 |
 |
| Module-wise count rates for Quadrant C Data is divided into 100 sec bins |
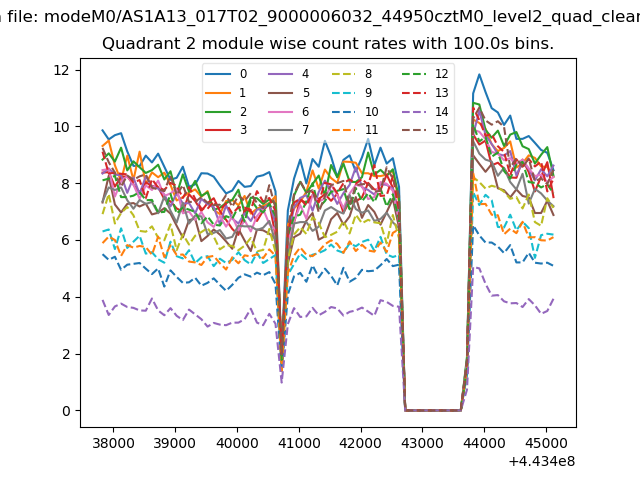 |
 |
| Module-wise count rates for Quadrant D Data is divided into 100 sec bins |
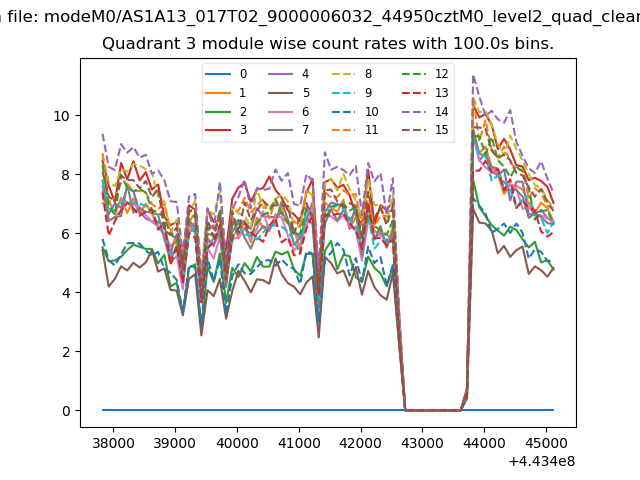 |
 |
| Parameter | Plot |
|---|---|
| CZT HV Monitor | 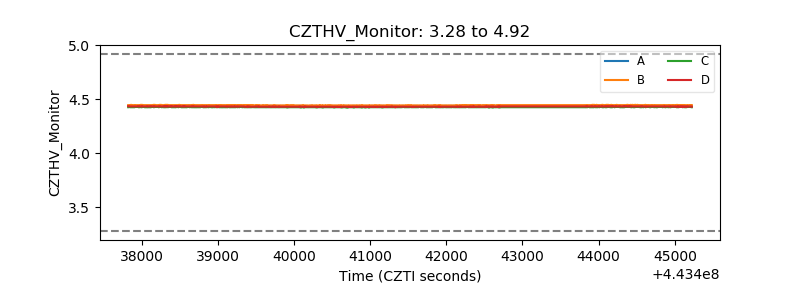 |
| D_VDD | 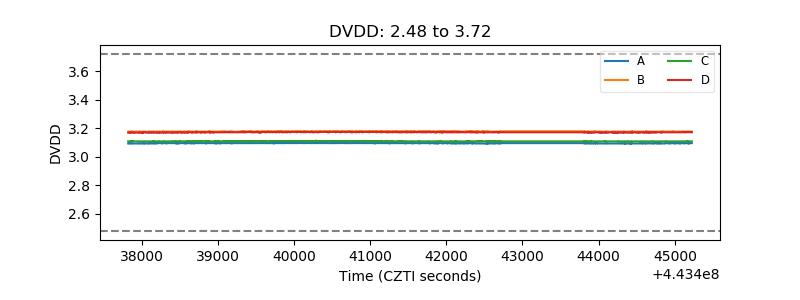 |
| Temperature 1 | 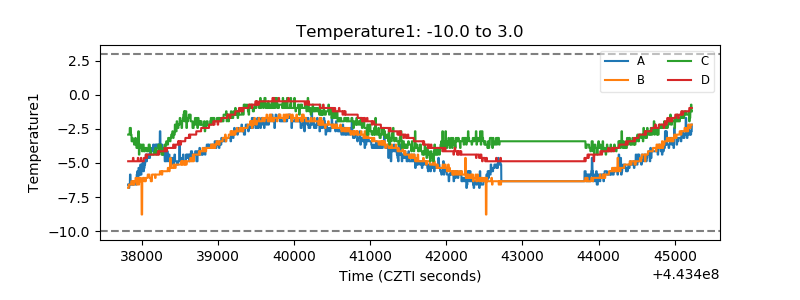 |
| Veto HV Monitor | 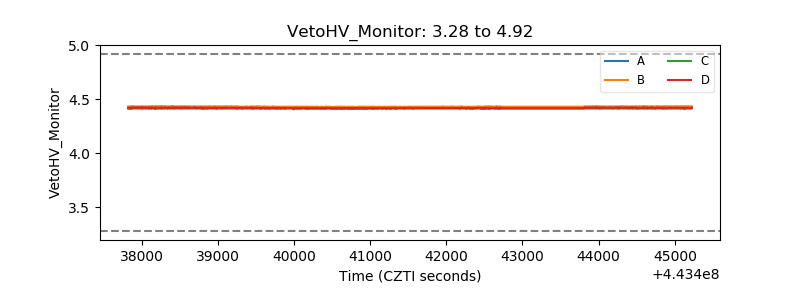 |
| Veto LLD | 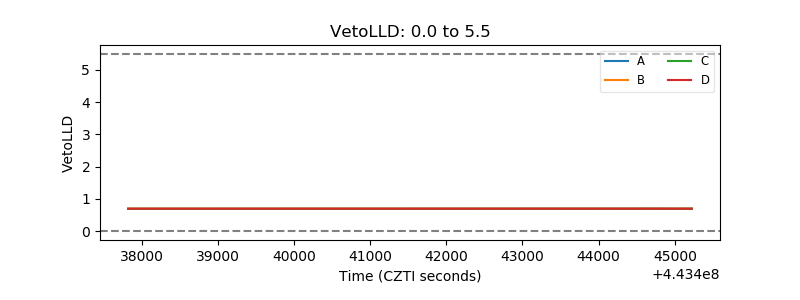 |
| Alpha Counter | 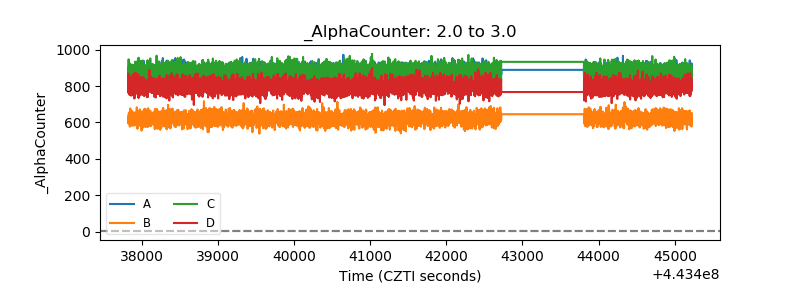 |
| _CPM_Rate | 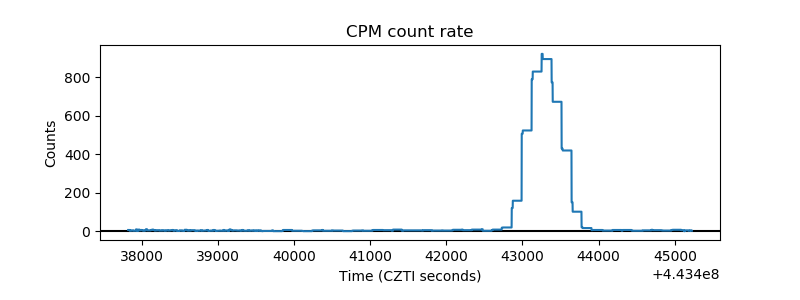 |
| CZT Counter | 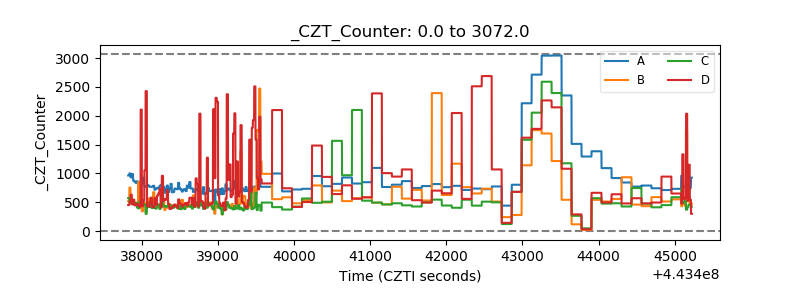 |
| +2.5 Volts monitor | 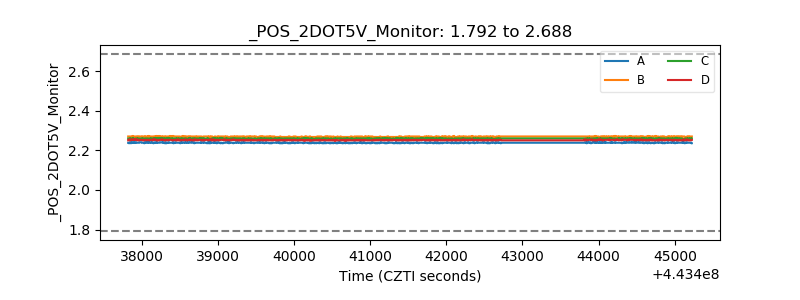 |
| +5 Volts monitor | 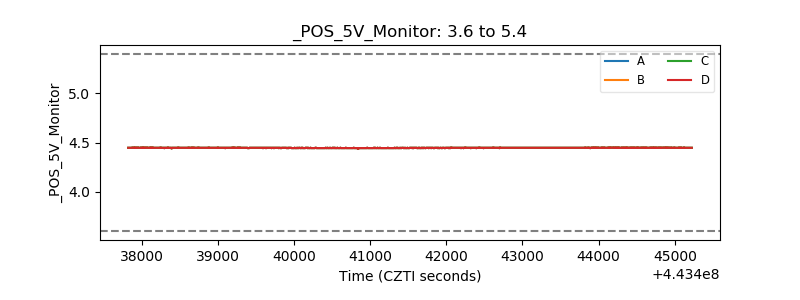 |
| _ROLL_ROT | 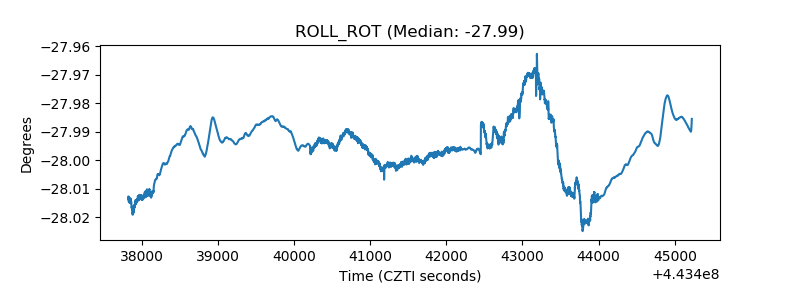 |
| _Roll_DEC | 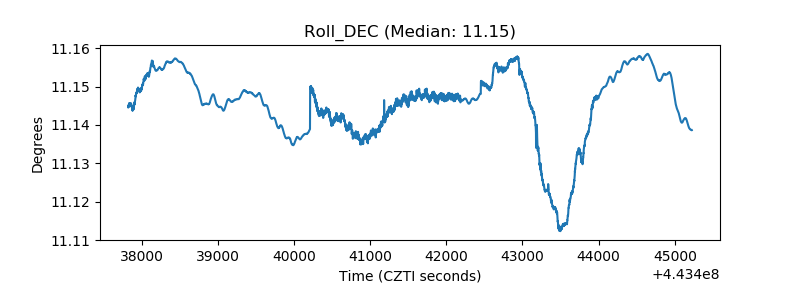 |
| _Roll_RA | 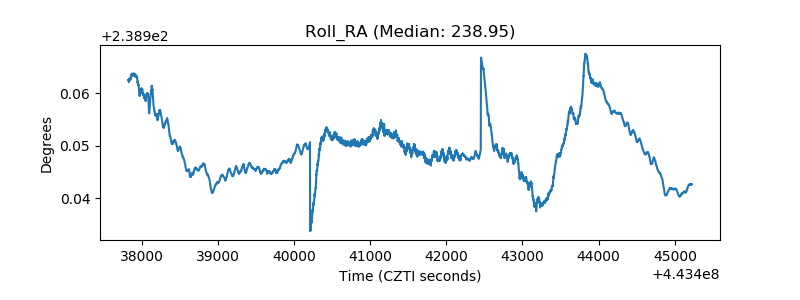 |
| Veto Counter | 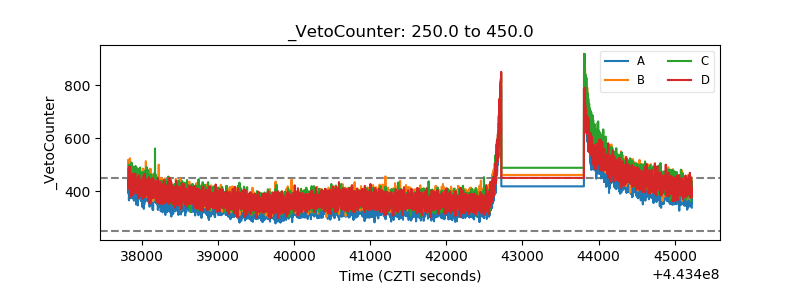 |