| Param | Original file | Final file |
|---|---|---|
| Filename | modeM0/AS1A13_017T02_9000006032_44954cztM0_level2.fits | modeM0/AS1A13_017T02_9000006032_44954cztM0_level2_quad_clean.evt |
| Size (bytes) | 634,576,320 | 112,106,880 |
| Size | 605.2 MB | 106.9 MB |
| Events in quadrant A | 5,836,330 | 773,144 |
| Events in quadrant B | 4,235,009 | 785,939 |
| Events in quadrant C | 3,467,012 | 774,876 |
| Events in quadrant D | 9,433,535 | 593,299 |
| Mode SS | |||
|---|---|---|---|
| Quadrant | BADHDUFLAG | Total packets | Discarded packets |
| A | 0 | 138 | 0 |
| B | 0 | 138 | 0 |
| C | 0 | 138 | 0 |
| D | 0 | 138 | 0 |
| Mode M0 | |||
|---|---|---|---|
| Quadrant | BADHDUFLAG | Total packets | Discarded packets |
| A | 0 | 21843 | 2 |
| B | 0 | 16947 | 1 |
| C | 0 | 14692 | 1 |
| D | 0 | 32699 | 1 |
| Mode M9 | |||
|---|---|---|---|
| Quadrant | BADHDUFLAG | Total packets | Discarded packets |
| A | 0 | 10 | 0 |
| B | 0 | 10 | 0 |
| C | 0 | 10 | 0 |
| D | 0 | 10 | 0 |
| Quadrant | Total seconds | Saturated seconds | Saturation percentage |
|---|---|---|---|
| A | 6694 | 246 | 3.674933% |
| B | 6694 | 317 | 4.735584% |
| C | 6694 | 118 | 1.762773% |
| D | 6695 | 1418 | 21.179985% |
Noise dominated data is calculated using 1-second bins in cleaned event files. If a bin has >2000 counts, and if more than 50% of those come from <1% of pixels, then it is considered to be noise-dominated and hence unusable.
| Quadrant | # 1 sec bins | Bins with >0 counts | Bins with >2000 counts | High rate bins dominated by noise | Noise dominated (total time) | Noise dominated (detector-on time) | Marked lightcurve |
|---|---|---|---|---|---|---|---|
| A | 7764 | 6695 | 11 | 11 | 0.14% | 0.16% | 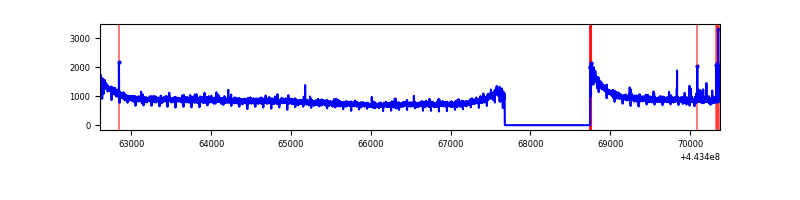 |
| B | 7764 | 6695 | 102 | 102 | 1.31% | 1.52% | 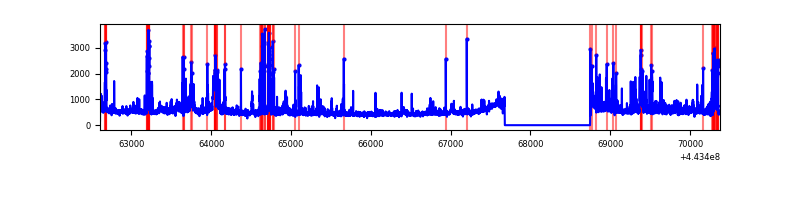 |
| C | 7764 | 6695 | 18 | 18 | 0.23% | 0.27% | 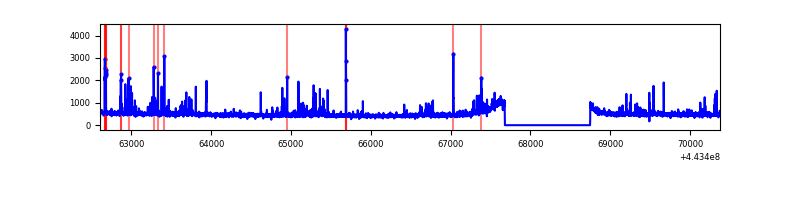 |
| D | 7765 | 6696 | 1166 | 1166 | 15.02% | 17.41% | 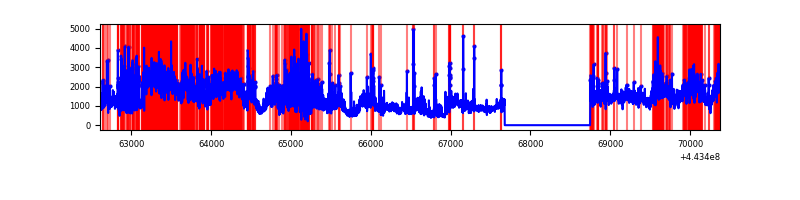 |
Top three noisy pixels from each quadrant. If the there are fewer than three noisy pixels in the level2.evt file, extra rows are filled as -1
| Pixel properties | Quadrant properties | ||||||
|---|---|---|---|---|---|---|---|
| Quadrant | DetID | PixID | Counts | Sigma | Mean | Median | Sigma |
| A | 10 | 83 | 2609944 | 15415.98 | 815 | 799 | 169.2 |
| A | 13 | 248 | 28605 | 164.29 | 815 | 799 | 169.2 |
| A | 0 | 243 | 25892 | 148.26 | 815 | 799 | 169.2 |
| B | 0 | 183 | 269705 | 1691.82 | 806 | 782 | 159.0 |
| B | 4 | 171 | 131828 | 824.42 | 806 | 782 | 159.0 |
| B | 5 | 255 | 116082 | 725.36 | 806 | 782 | 159.0 |
| C | 12 | 250 | 158133 | 828.69 | 810 | 817 | 189.8 |
| C | 1 | 3 | 64897 | 337.55 | 810 | 817 | 189.8 |
| C | 12 | 2 | 48210 | 249.65 | 810 | 817 | 189.8 |
| D | 12 | 33 | 3534710 | 18134.24 | 761 | 736 | 194.9 |
| D | 8 | 48 | 1221934 | 6266.45 | 761 | 736 | 194.9 |
| D | 5 | 235 | 336779 | 1724.37 | 761 | 736 | 194.9 |
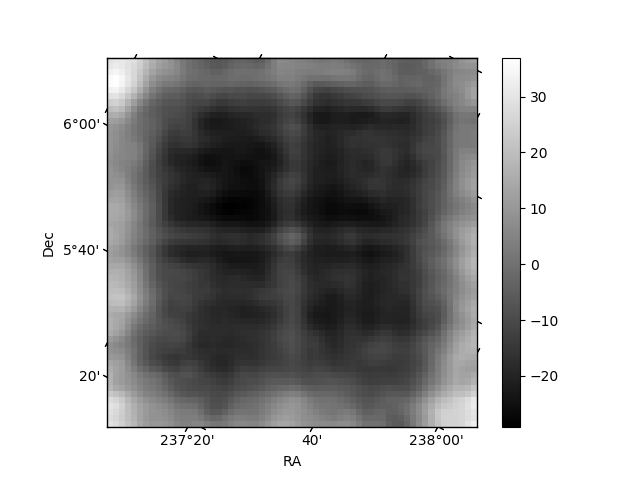
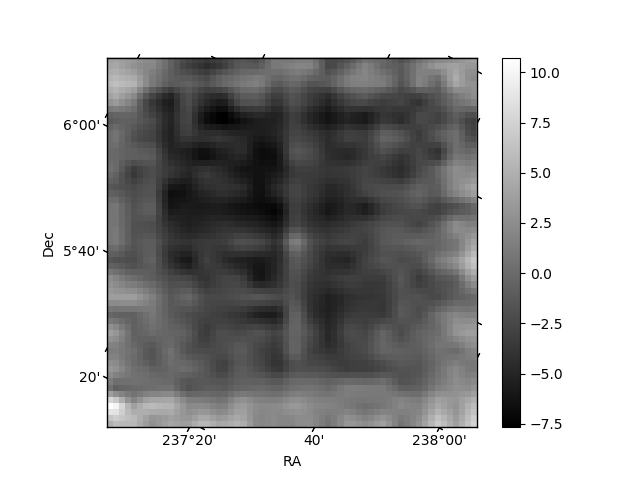
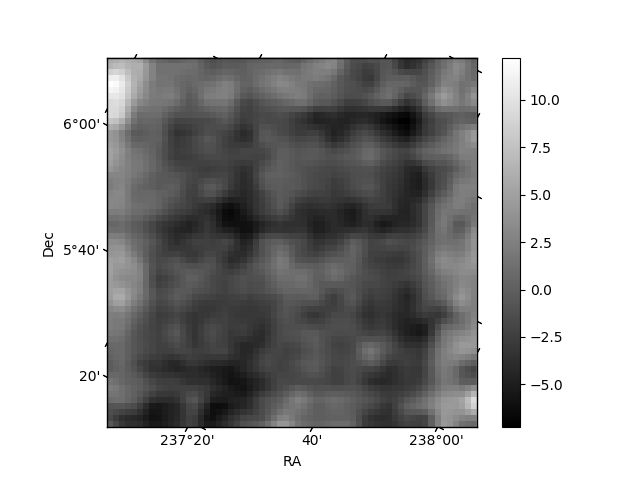
Histogram calculated using DETX and DETY for each event in the final _common_clean file
| Quadrant A | 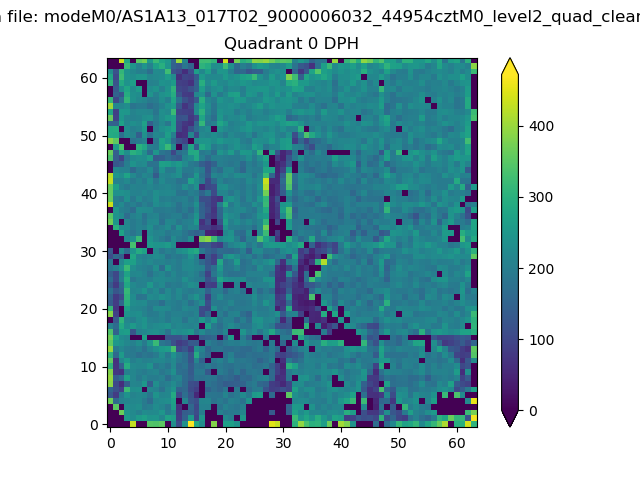 |
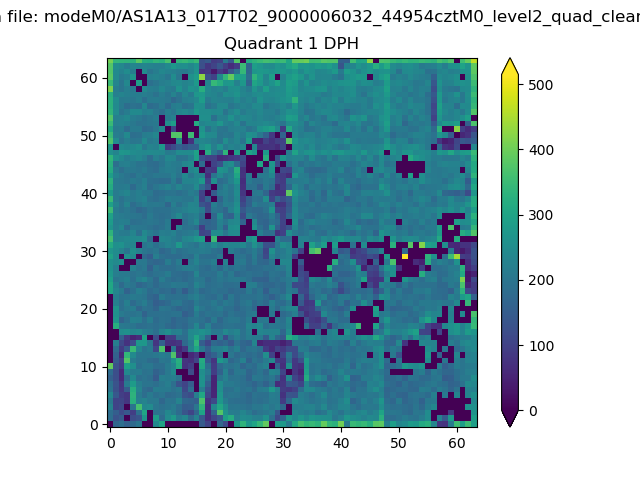 |
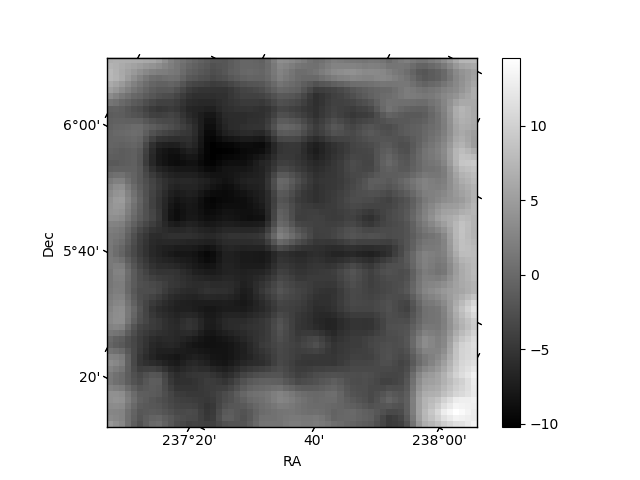
Quadrant B |
|---|---|---|---|
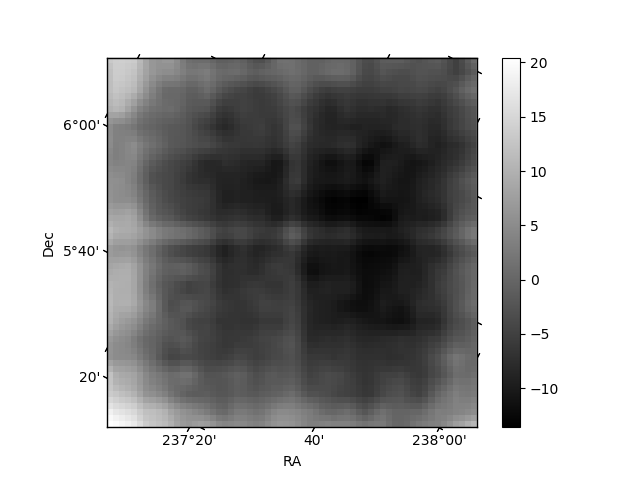
| Quadrant D | 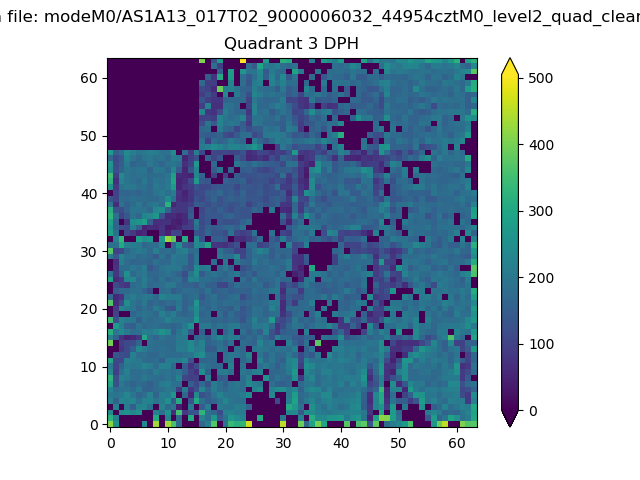 |
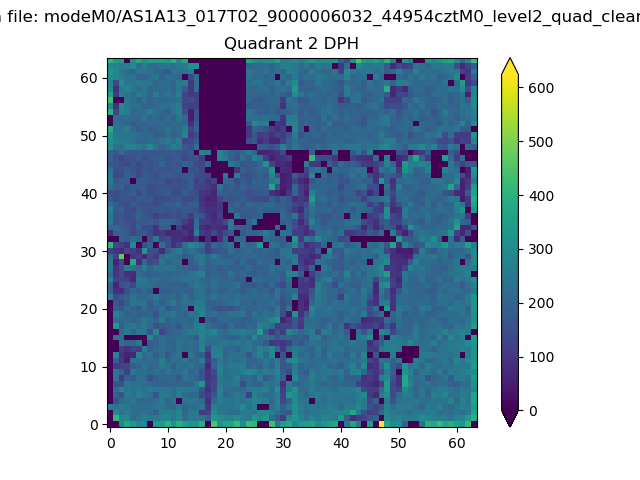 |
Quadrant C |
| Plot type | Count rate plots | Images |
|---|---|---|
| Comparison with Poisson distribution Blue bars denote a histogram of data divided into 1 sec bins. Red curve is a Poisson curve with rate = median count rate of data. |
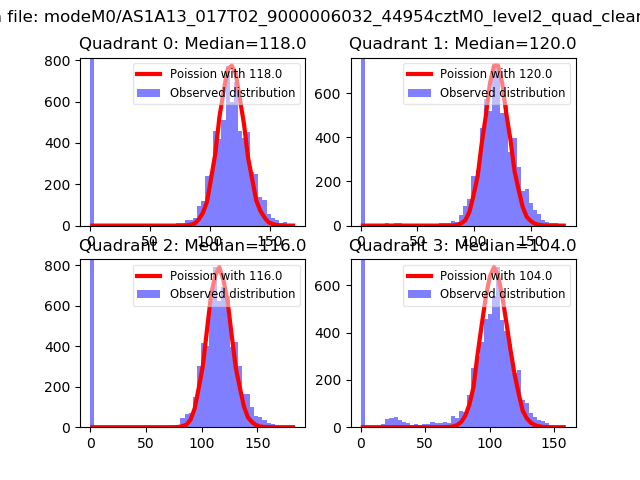 |
 |
| Quadrant-wise count rates Data is divided into 100 sec bins |
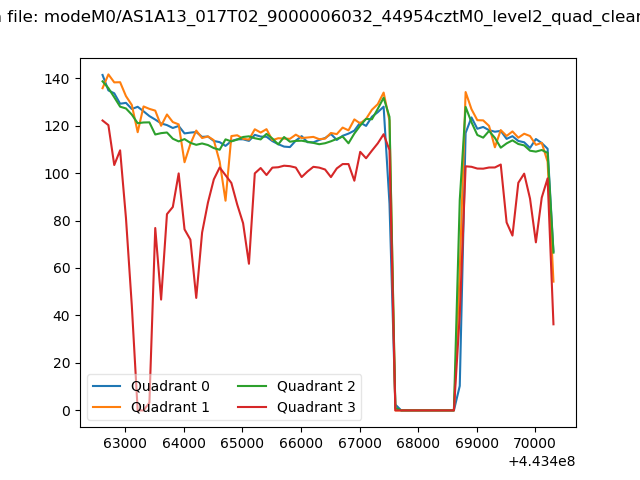 |
|
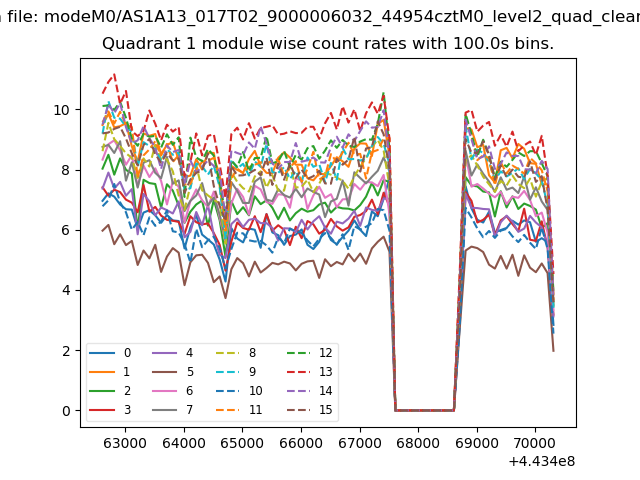
| Module-wise count rates for Quadrant A Data is divided into 100 sec bins |
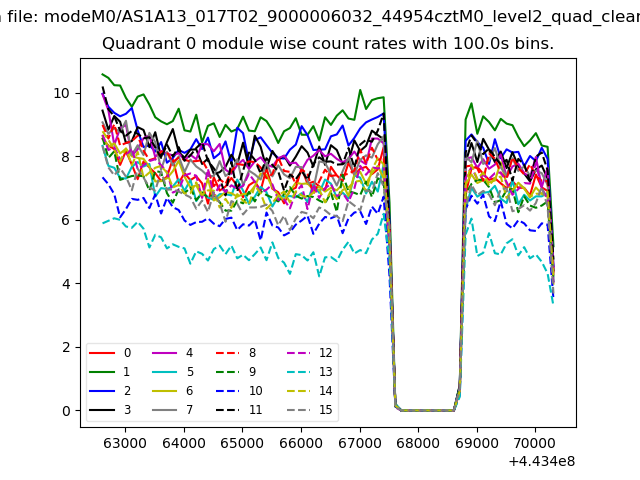 |
 |
| Module-wise count rates for Quadrant B Data is divided into 100 sec bins |
 |
 |
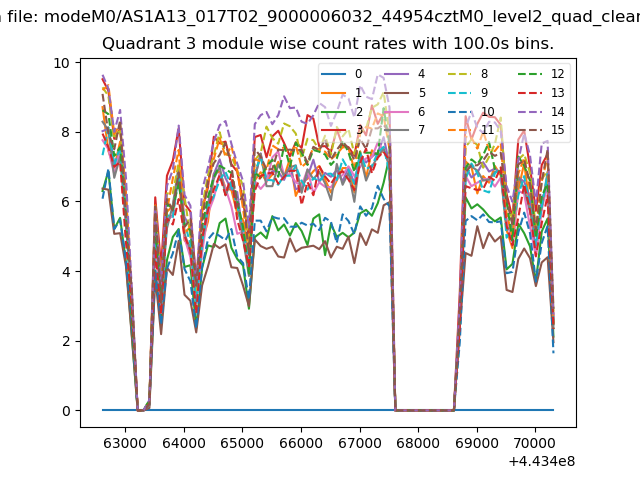
| Module-wise count rates for Quadrant C Data is divided into 100 sec bins |
 |
 |
| Module-wise count rates for Quadrant D Data is divided into 100 sec bins |
 |
 |
| Parameter | Plot |
|---|---|
| CZT HV Monitor |  |
| D_VDD | 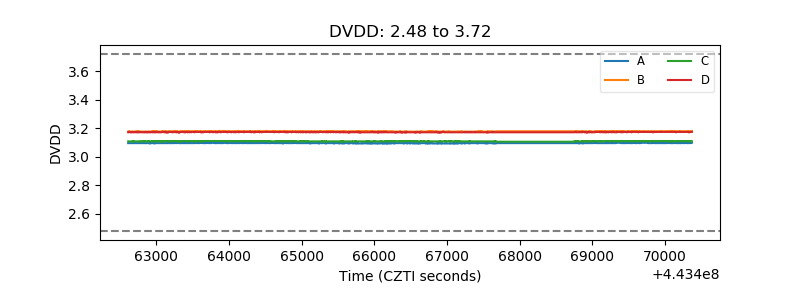 |
| Temperature 1 | 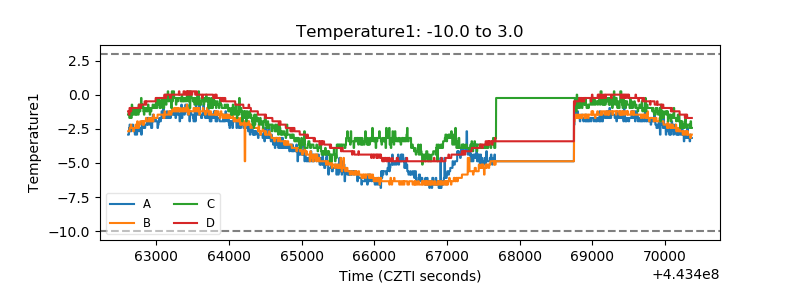 |
| Veto HV Monitor | 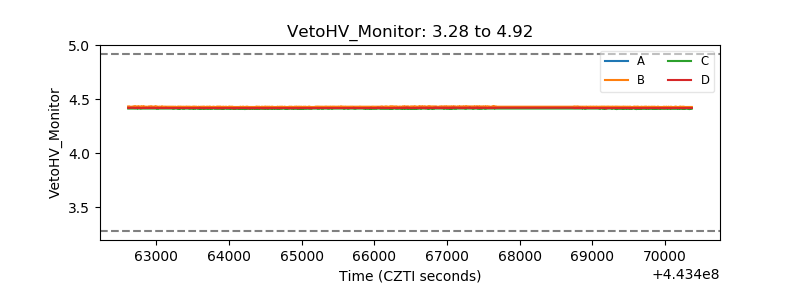 |
| Veto LLD | 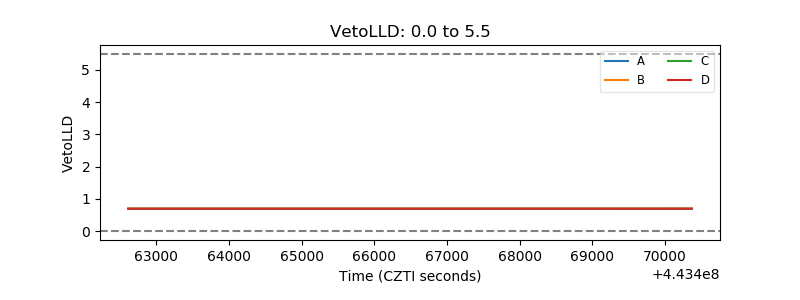 |
| Alpha Counter | 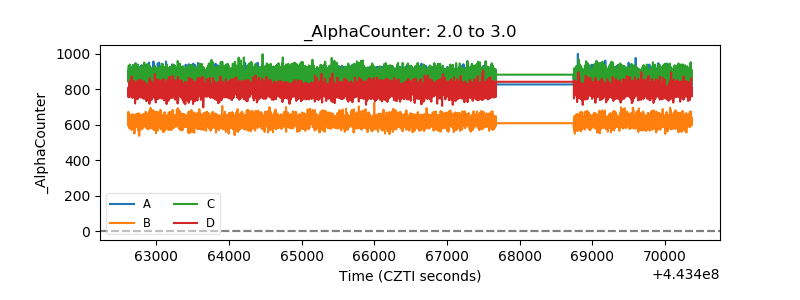 |
| _CPM_Rate | 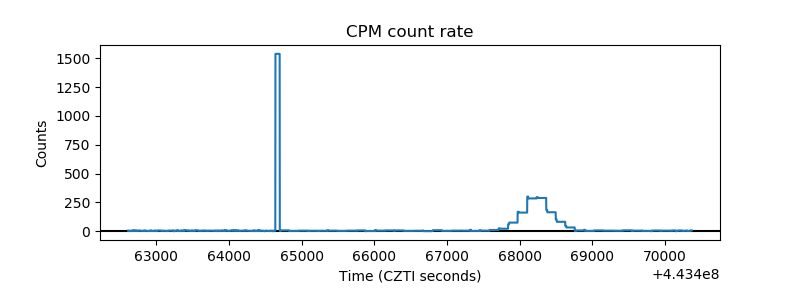 |
| CZT Counter | 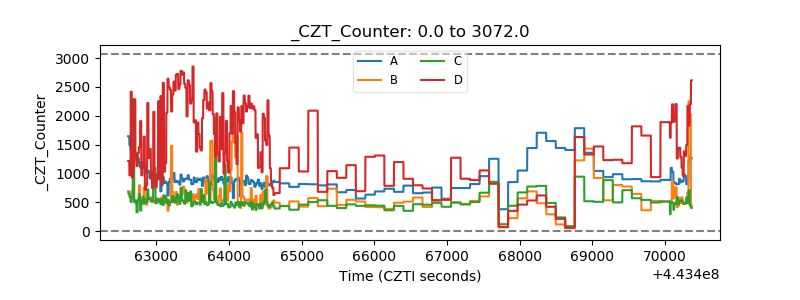 |
| +2.5 Volts monitor | 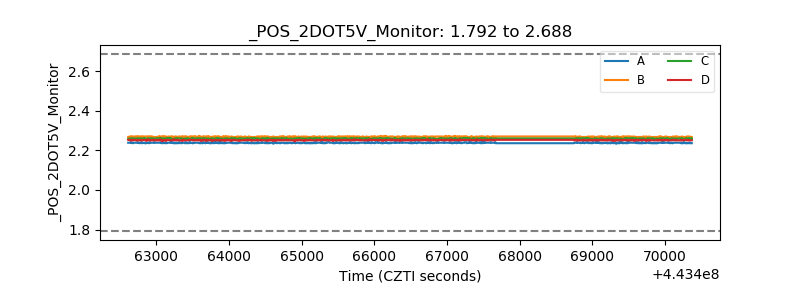 |
| +5 Volts monitor | 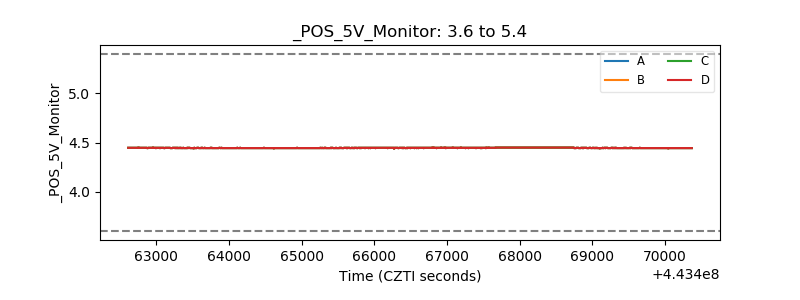 |
| _ROLL_ROT | 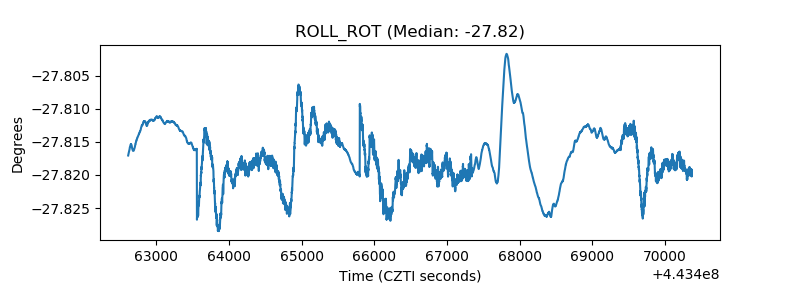 |
| _Roll_DEC | 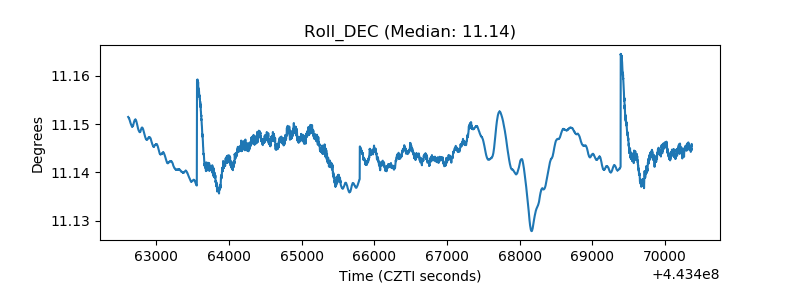 |
| _Roll_RA | 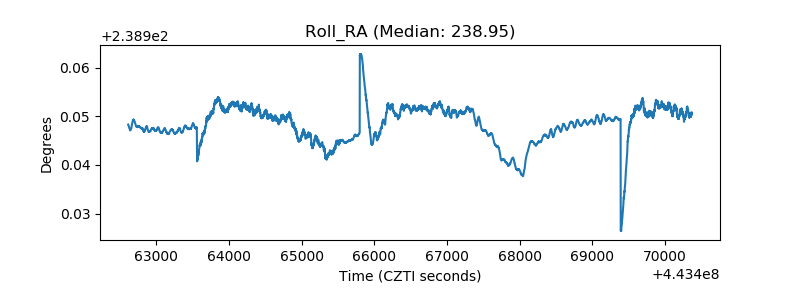 |
| Veto Counter | 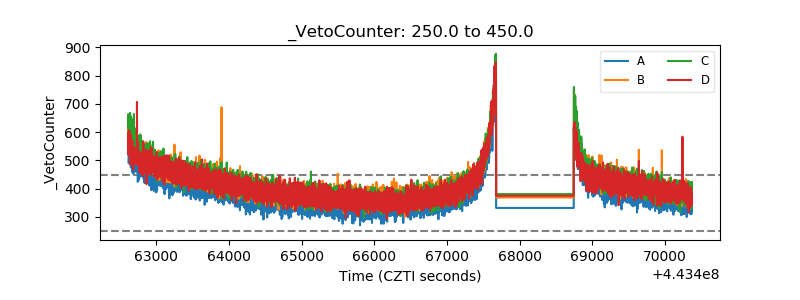 |