| Param | Original file | Final file |
|---|---|---|
| Filename | modeM0/AS1A13_017T02_9000006032_44955cztM0_level2.fits | modeM0/AS1A13_017T02_9000006032_44955cztM0_level2_quad_clean.evt |
| Size (bytes) | 727,338,240 | 94,449,600 |
| Size | 693.6 MB | 90.1 MB |
| Events in quadrant A | 5,415,046 | 703,527 |
| Events in quadrant B | 4,395,384 | 705,913 |
| Events in quadrant C | 3,169,405 | 714,333 |
| Events in quadrant D | 13,443,292 | 284,938 |
| Mode SS | |||
|---|---|---|---|
| Quadrant | BADHDUFLAG | Total packets | Discarded packets |
| A | 0 | 132 | 0 |
| B | 0 | 132 | 0 |
| C | 0 | 132 | 0 |
| D | 0 | 132 | 0 |
| Mode M0 | |||
|---|---|---|---|
| Quadrant | BADHDUFLAG | Total packets | Discarded packets |
| A | 0 | 20643 | 3 |
| B | 0 | 17411 | 1 |
| C | 0 | 13837 | 1 |
| D | 0 | 44434 | 1 |
| Mode M9 | |||
|---|---|---|---|
| Quadrant | BADHDUFLAG | Total packets | Discarded packets |
| A | 0 | 7 | 0 |
| B | 0 | 7 | 0 |
| C | 0 | 7 | 0 |
| D | 0 | 7 | 0 |
| Quadrant | Total seconds | Saturated seconds | Saturation percentage |
|---|---|---|---|
| A | 6458 | 252 | 3.902137% |
| B | 6459 | 425 | 6.579966% |
| C | 6459 | 104 | 1.610156% |
| D | 6459 | 3957 | 61.263353% |
Noise dominated data is calculated using 1-second bins in cleaned event files. If a bin has >2000 counts, and if more than 50% of those come from <1% of pixels, then it is considered to be noise-dominated and hence unusable.
| Quadrant | # 1 sec bins | Bins with >0 counts | Bins with >2000 counts | High rate bins dominated by noise | Noise dominated (total time) | Noise dominated (detector-on time) | Marked lightcurve |
|---|---|---|---|---|---|---|---|
| A | 7183 | 6459 | 11 | 11 | 0.15% | 0.17% | 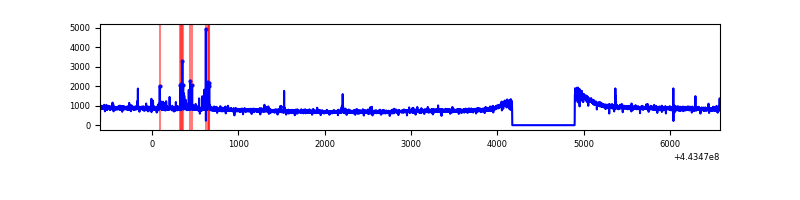 |
| B | 7184 | 6459 | 193 | 193 | 2.69% | 2.99% | 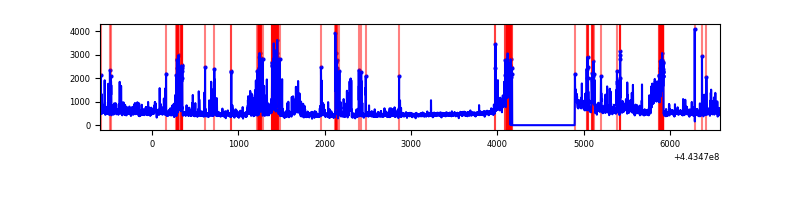 |
| C | 7184 | 6460 | 8 | 8 | 0.11% | 0.12% | 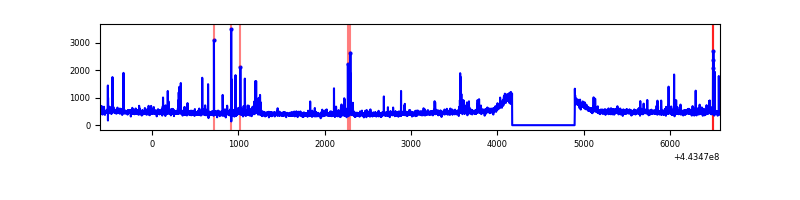 |
| D | 7184 | 6459 | 3527 | 3527 | 49.10% | 54.61% | 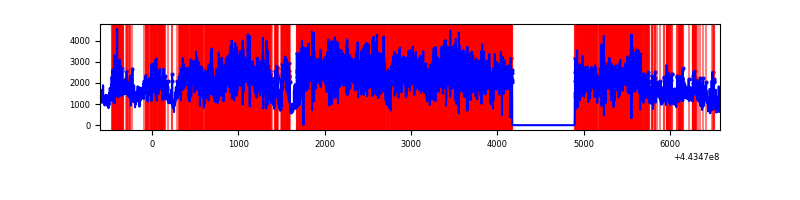 |
Top three noisy pixels from each quadrant. If the there are fewer than three noisy pixels in the level2.evt file, extra rows are filled as -1
| Pixel properties | Quadrant properties | ||||||
|---|---|---|---|---|---|---|---|
| Quadrant | DetID | PixID | Counts | Sigma | Mean | Median | Sigma |
| A | 10 | 83 | 2344756 | 14867.78 | 759 | 743 | 157.7 |
| A | 13 | 248 | 68167 | 427.66 | 759 | 743 | 157.7 |
| A | 0 | 243 | 24810 | 152.65 | 759 | 743 | 157.7 |
| B | 4 | 171 | 547642 | 3666.96 | 741 | 720 | 149.1 |
| B | 5 | 172 | 186382 | 1244.81 | 741 | 720 | 149.1 |
| B | 15 | 36 | 156840 | 1046.74 | 741 | 720 | 149.1 |
| C | 12 | 250 | 120871 | 672.01 | 757 | 763 | 178.7 |
| C | 3 | 233 | 30556 | 166.69 | 757 | 763 | 178.7 |
| C | 12 | 2 | 29870 | 162.85 | 757 | 763 | 178.7 |
| D | 12 | 33 | 9118832 | 62397.8 | 560 | 542 | 146.1 |
| D | 8 | 48 | 539452 | 3687.84 | 560 | 542 | 146.1 |
| D | 13 | 249 | 470117 | 3213.37 | 560 | 542 | 146.1 |
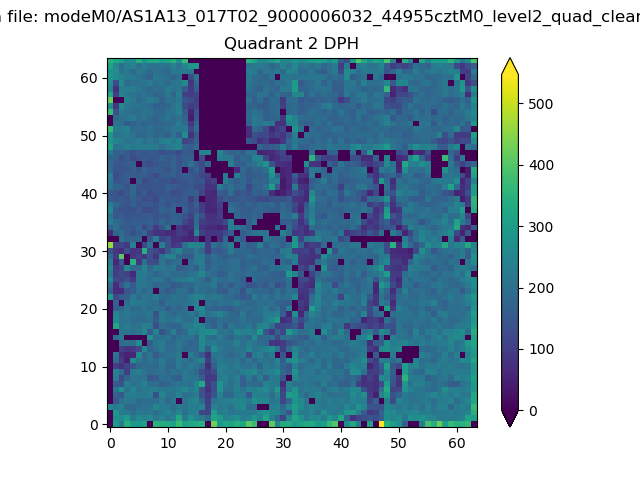
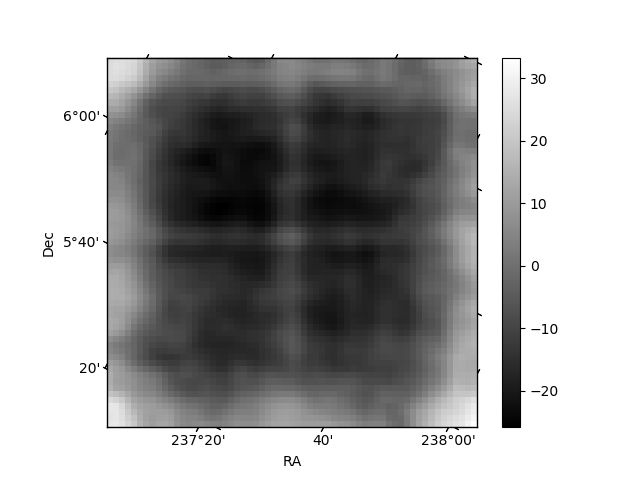
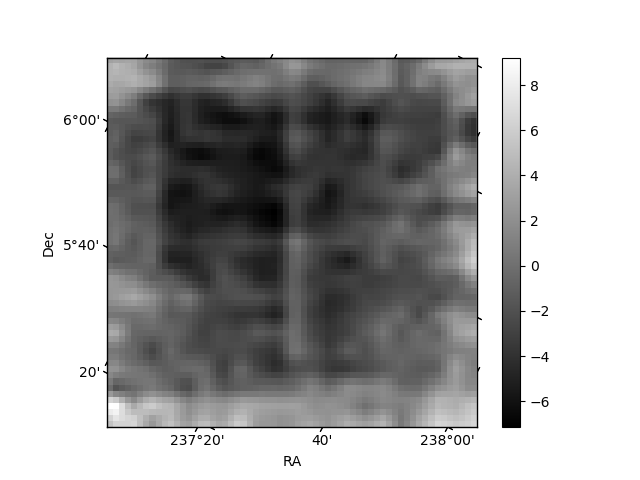
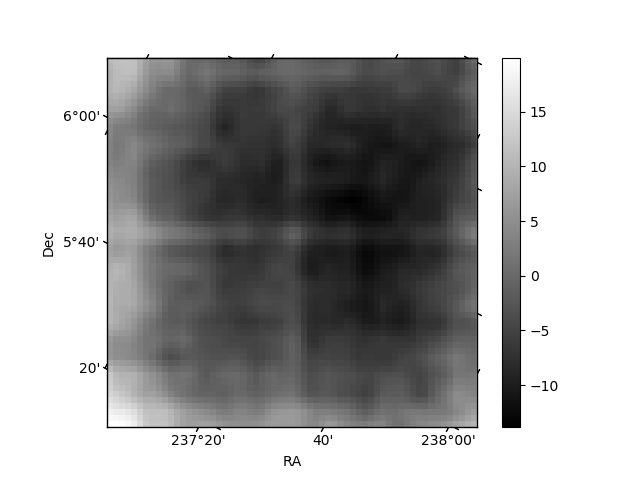
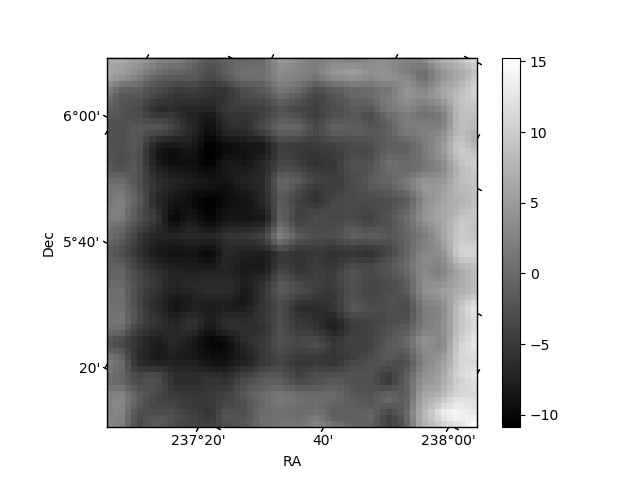
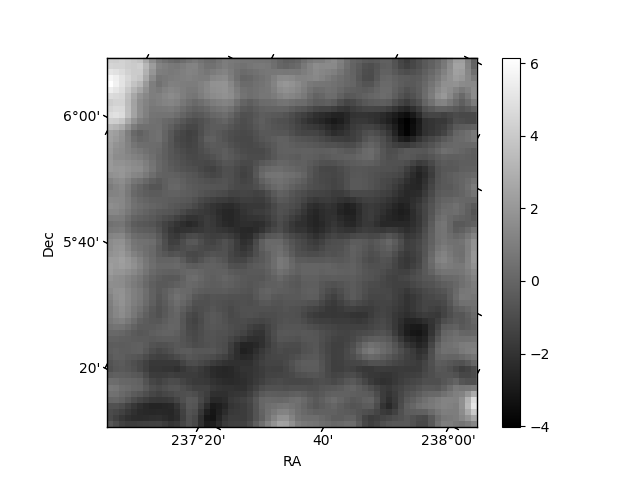
Histogram calculated using DETX and DETY for each event in the final _common_clean file
| Quadrant A | 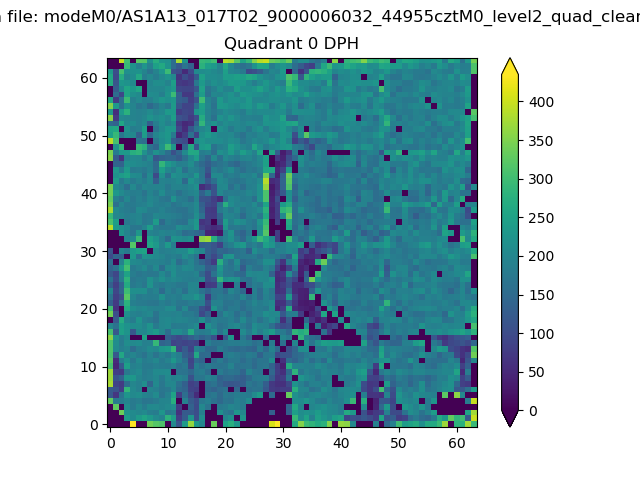 |
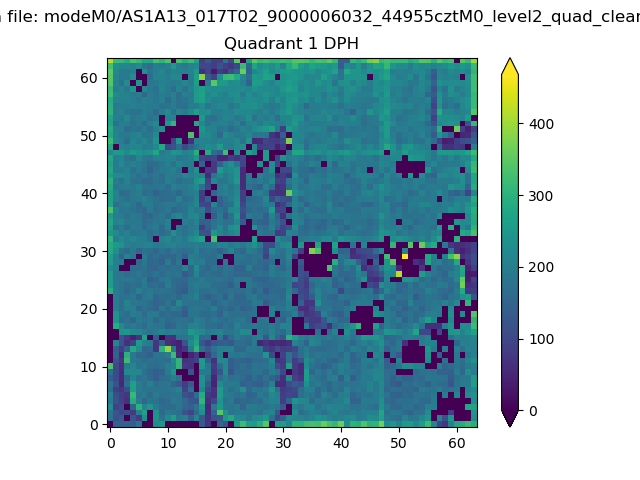 |
Quadrant B |
|---|---|---|---|
| Quadrant D | 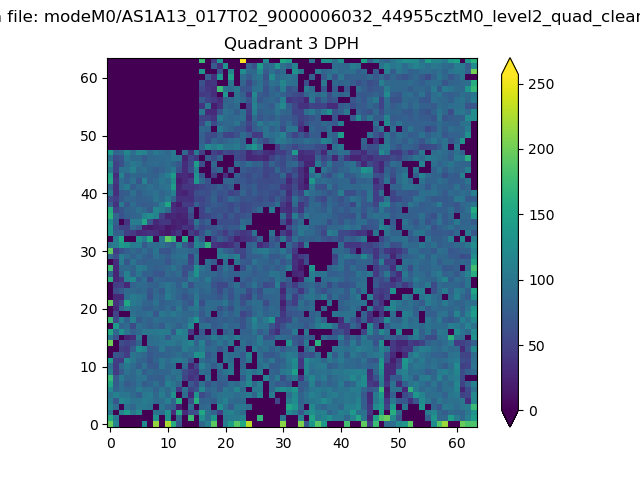 |
 |
Quadrant C |
| Plot type | Count rate plots | Images |
|---|---|---|
| Comparison with Poisson distribution Blue bars denote a histogram of data divided into 1 sec bins. Red curve is a Poisson curve with rate = median count rate of data. |
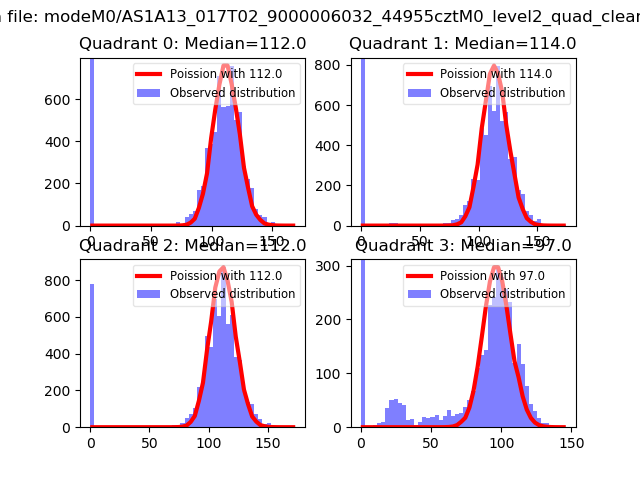 |
 |
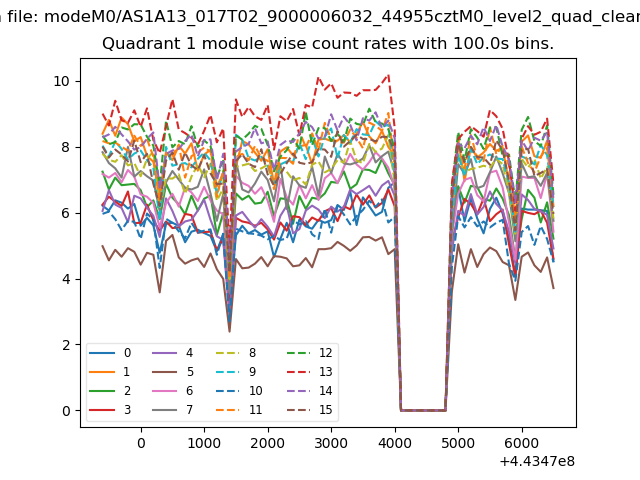
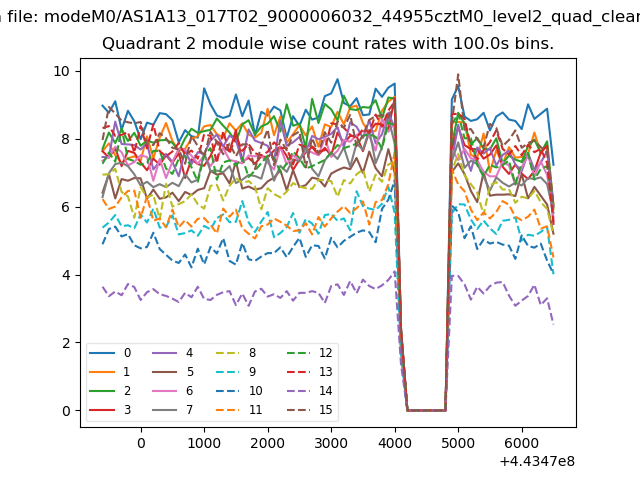
| Quadrant-wise count rates Data is divided into 100 sec bins |
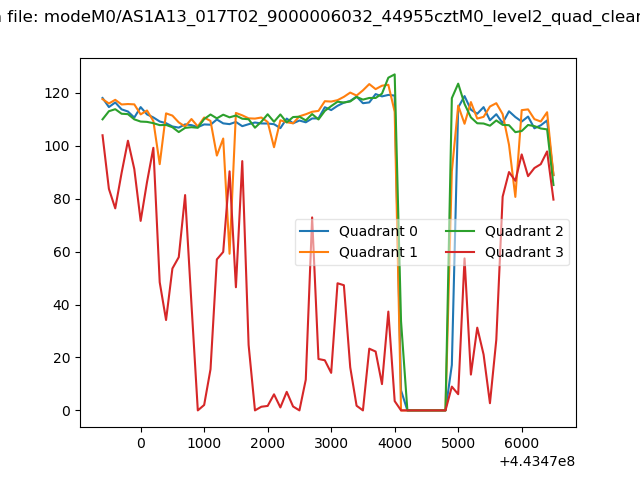 |
|
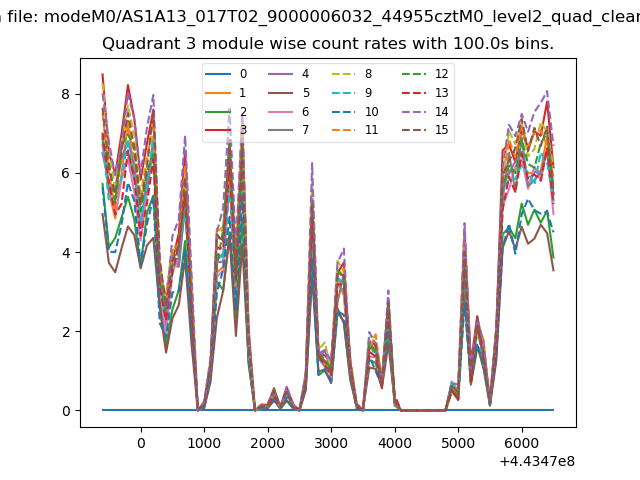
| Module-wise count rates for Quadrant A Data is divided into 100 sec bins |
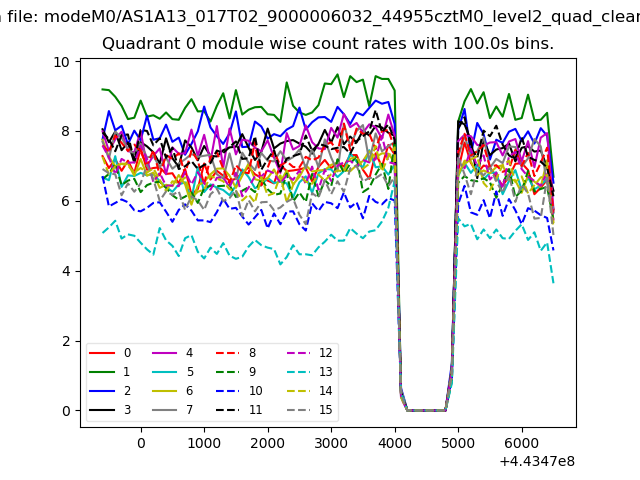 |
 |
| Module-wise count rates for Quadrant B Data is divided into 100 sec bins |
 |
 |
| Module-wise count rates for Quadrant C Data is divided into 100 sec bins |
 |
 |
| Module-wise count rates for Quadrant D Data is divided into 100 sec bins |
 |
 |
| Parameter | Plot |
|---|---|
| CZT HV Monitor | 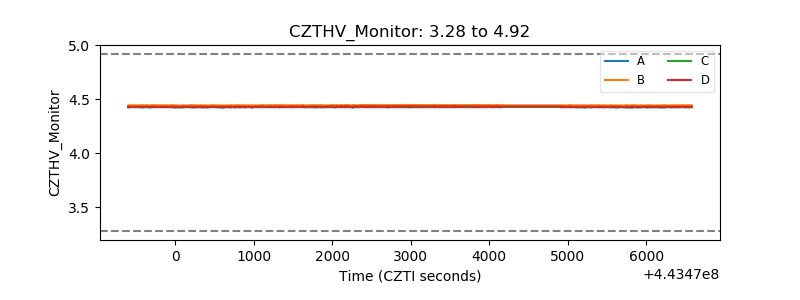 |
| D_VDD | 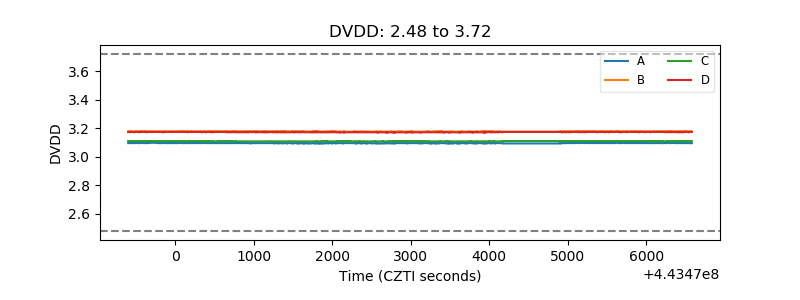 |
| Temperature 1 | 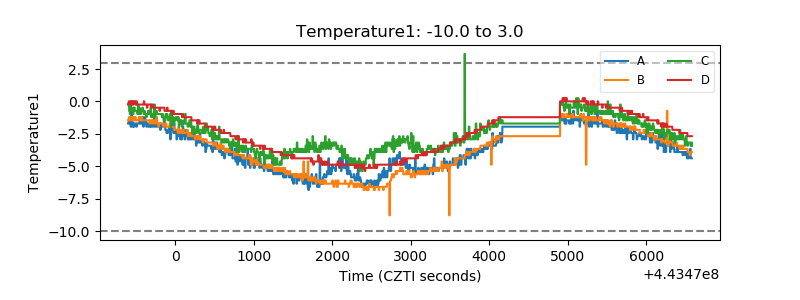 |
| Veto HV Monitor | 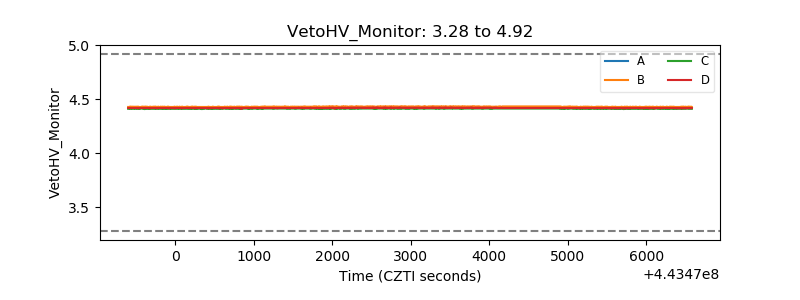 |
| Veto LLD | 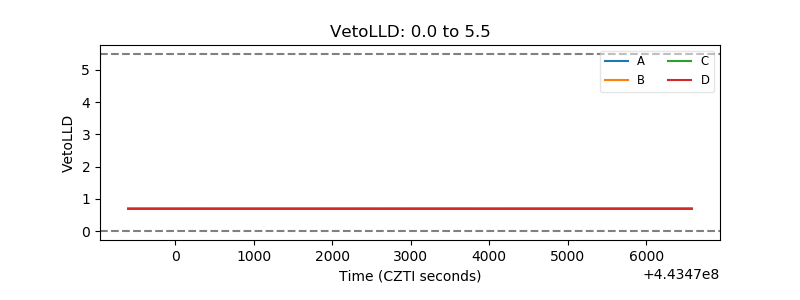 |
| Alpha Counter | 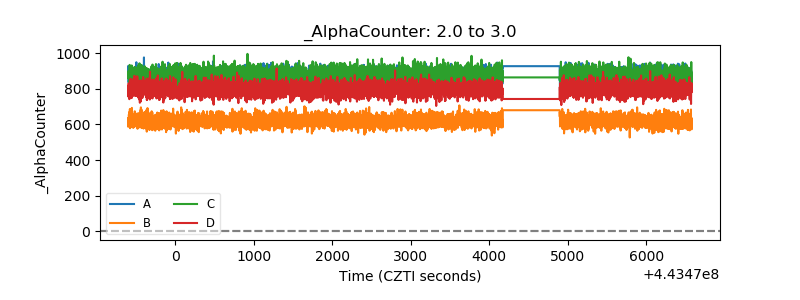 |
| _CPM_Rate | 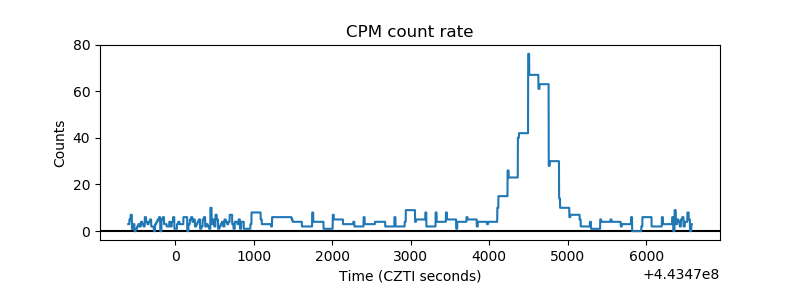 |
| CZT Counter | 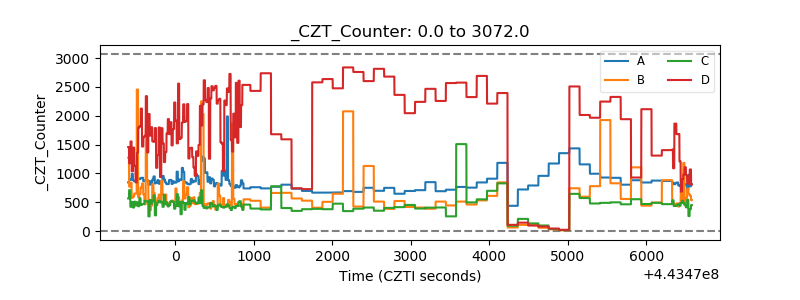 |
| +2.5 Volts monitor | 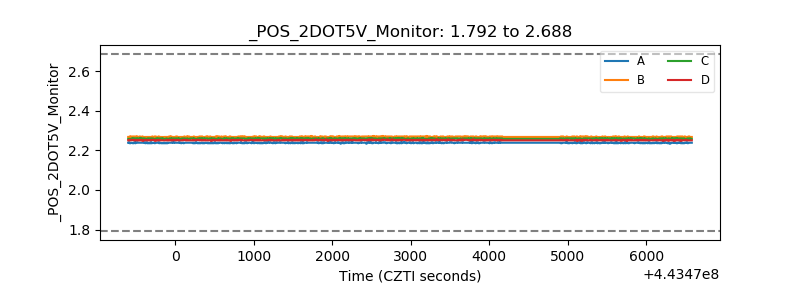 |
| +5 Volts monitor | 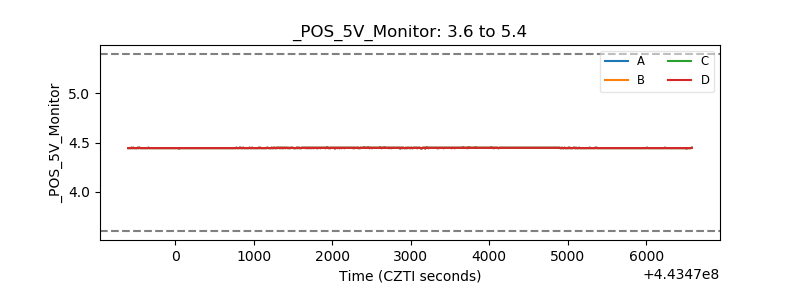 |
| _ROLL_ROT | 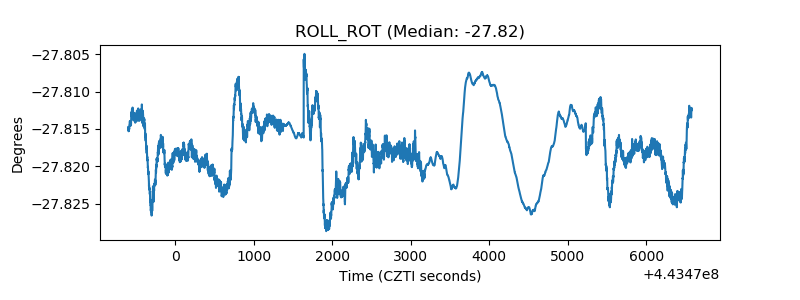 |
| _Roll_DEC | 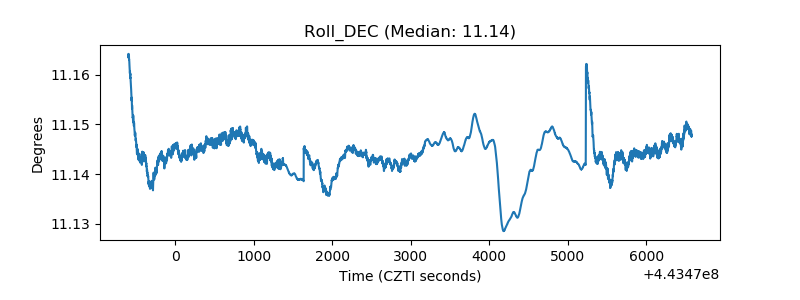 |
| _Roll_RA | 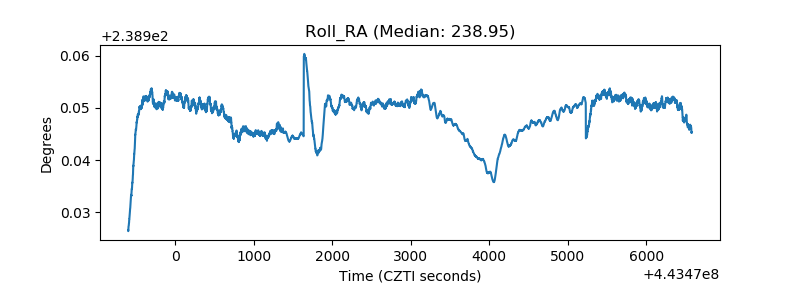 |
| Veto Counter | 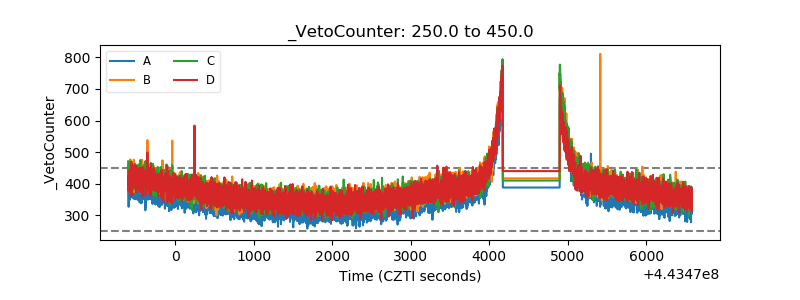 |