| Param | Original file | Final file |
|---|---|---|
| Filename | modeM0/AS1A13_017T02_9000006032_44962cztM0_level2.fits | modeM0/AS1A13_017T02_9000006032_44962cztM0_level2_quad_clean.evt |
| Size (bytes) | 460,123,200 | 107,487,360 |
| Size | 438.8 MB | 102.5 MB |
| Events in quadrant A | 5,214,320 | 712,020 |
| Events in quadrant B | 3,380,329 | 736,687 |
| Events in quadrant C | 3,027,035 | 720,398 |
| Events in quadrant D | 4,890,128 | 618,305 |
| Mode SS | |||
|---|---|---|---|
| Quadrant | BADHDUFLAG | Total packets | Discarded packets |
| A | 0 | 136 | 0 |
| B | 0 | 136 | 0 |
| C | 0 | 136 | 0 |
| D | 0 | 136 | 0 |
| Mode M0 | |||
|---|---|---|---|
| Quadrant | BADHDUFLAG | Total packets | Discarded packets |
| A | 0 | 20720 | 1 |
| B | 0 | 14645 | 1 |
| C | 0 | 13864 | 1 |
| D | 0 | 19168 | 1 |
| Mode M9 | |||
|---|---|---|---|
| Quadrant | BADHDUFLAG | Total packets | Discarded packets |
| A | 0 | 9 | 0 |
| B | 0 | 9 | 0 |
| C | 0 | 9 | 0 |
| D | 0 | 9 | 0 |
| Quadrant | Total seconds | Saturated seconds | Saturation percentage |
|---|---|---|---|
| A | 6700 | 130 | 1.940299% |
| B | 6701 | 103 | 1.537084% |
| C | 6701 | 37 | 0.552156% |
| D | 6701 | 438 | 6.536338% |
Noise dominated data is calculated using 1-second bins in cleaned event files. If a bin has >2000 counts, and if more than 50% of those come from <1% of pixels, then it is considered to be noise-dominated and hence unusable.
| Quadrant | # 1 sec bins | Bins with >0 counts | Bins with >2000 counts | High rate bins dominated by noise | Noise dominated (total time) | Noise dominated (detector-on time) | Marked lightcurve |
|---|---|---|---|---|---|---|---|
| A | 7580 | 6701 | 11 | 11 | 0.15% | 0.16% |  |
| B | 7581 | 6702 | 35 | 35 | 0.46% | 0.52% |  |
| C | 7581 | 6702 | 11 | 11 | 0.15% | 0.16% |  |
| D | 7581 | 6702 | 354 | 354 | 4.67% | 5.28% |  |
Top three noisy pixels from each quadrant. If the there are fewer than three noisy pixels in the level2.evt file, extra rows are filled as -1
| Pixel properties | Quadrant properties | ||||||
|---|---|---|---|---|---|---|---|
| Quadrant | DetID | PixID | Counts | Sigma | Mean | Median | Sigma |
| A | 10 | 83 | 2252119 | 14359.48 | 747 | 730 | 156.8 |
| A | 13 | 248 | 52761 | 331.86 | 747 | 730 | 156.8 |
| A | 7 | 3 | 11639 | 69.58 | 747 | 730 | 156.8 |
| B | 4 | 171 | 185785 | 1254.07 | 744 | 721 | 147.6 |
| B | 5 | 255 | 77768 | 522.1 | 744 | 721 | 147.6 |
| B | 0 | 219 | 69692 | 467.38 | 744 | 721 | 147.6 |
| C | 12 | 250 | 91784 | 524.08 | 737 | 742 | 173.7 |
| C | 14 | 254 | 36153 | 203.84 | 737 | 742 | 173.7 |
| C | 3 | 233 | 12020 | 64.92 | 737 | 742 | 173.7 |
| D | 13 | 249 | 973434 | 5365.84 | 715 | 694 | 181.3 |
| D | 5 | 235 | 222700 | 1224.63 | 715 | 694 | 181.3 |
| D | 13 | 187 | 196510 | 1080.16 | 715 | 694 | 181.3 |
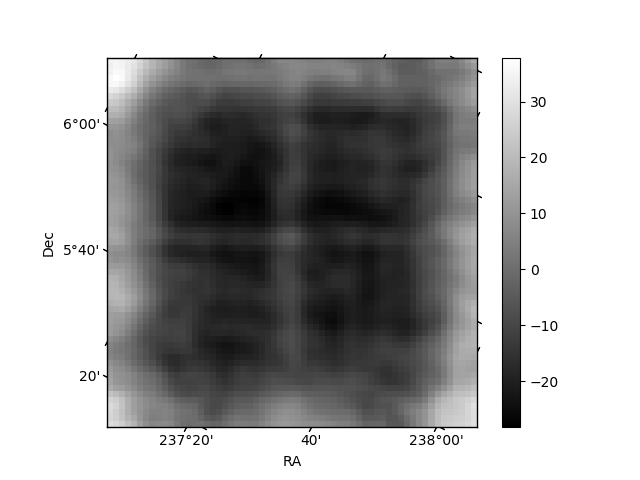
Histogram calculated using DETX and DETY for each event in the final _common_clean file
| Quadrant A | 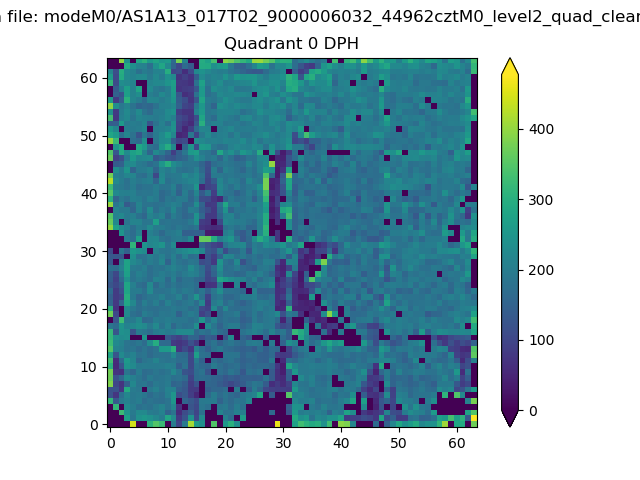 |
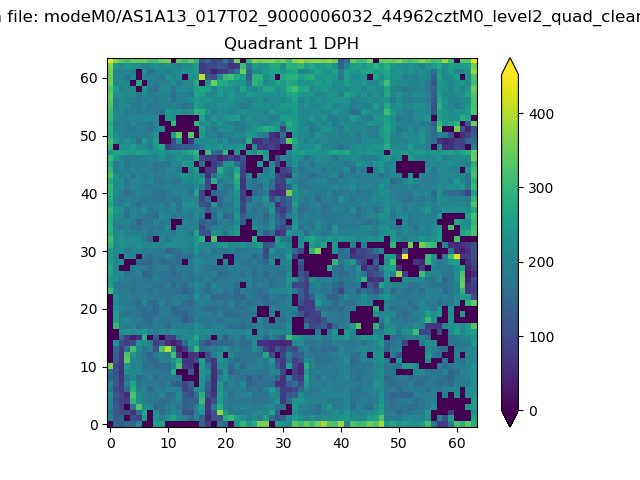 |
Quadrant B |
|---|---|---|---|
| Quadrant D | 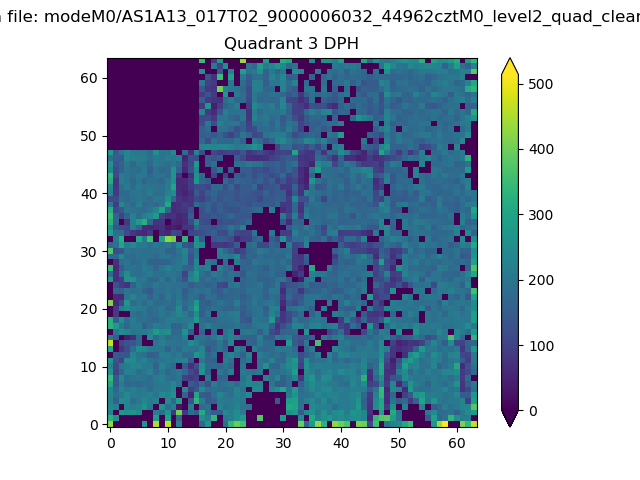 |
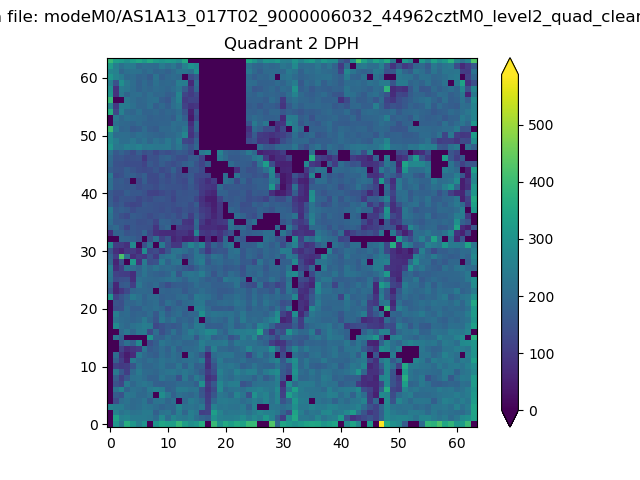 |
Quadrant C |
| Plot type | Count rate plots | Images |
|---|---|---|
| Comparison with Poisson distribution Blue bars denote a histogram of data divided into 1 sec bins. Red curve is a Poisson curve with rate = median count rate of data. |
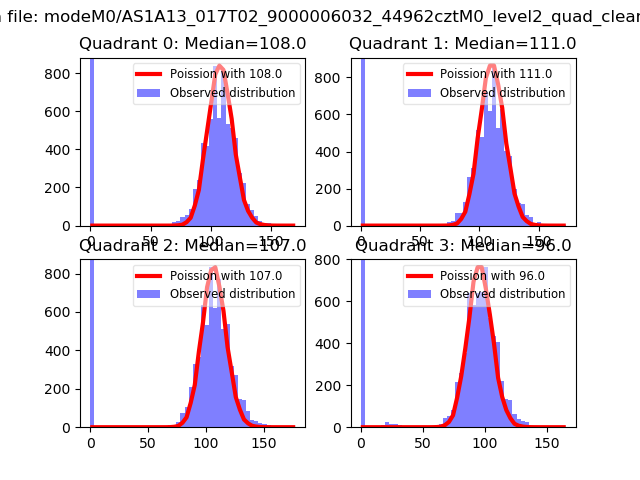 |
 |
| Quadrant-wise count rates Data is divided into 100 sec bins |
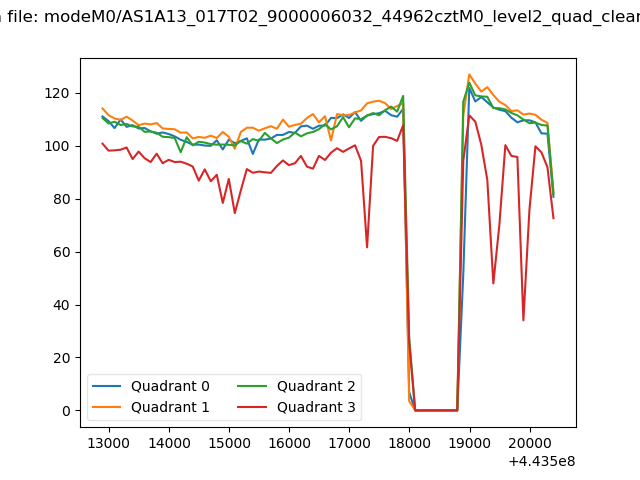 |
|
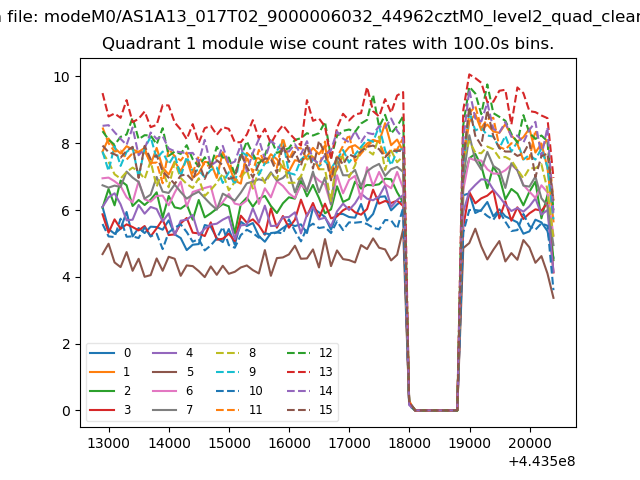
| Module-wise count rates for Quadrant A Data is divided into 100 sec bins |
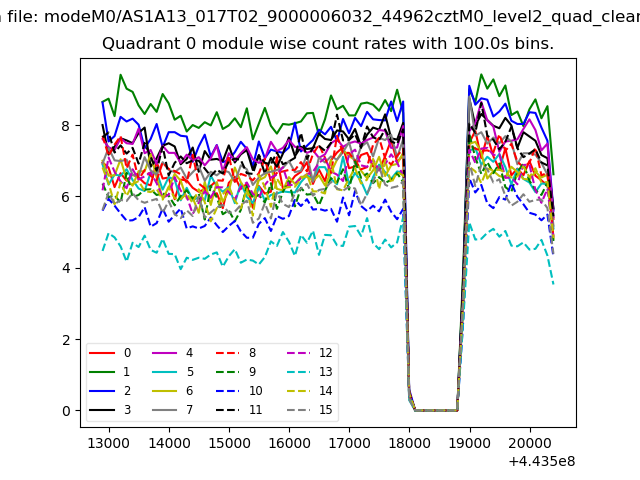 |
 |
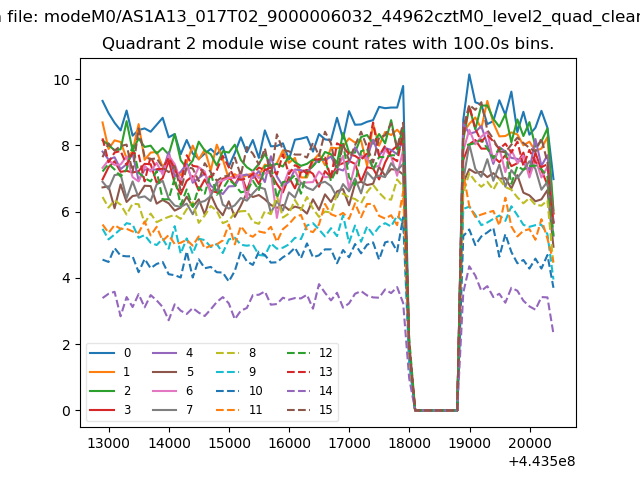
| Module-wise count rates for Quadrant B Data is divided into 100 sec bins |
 |
 |
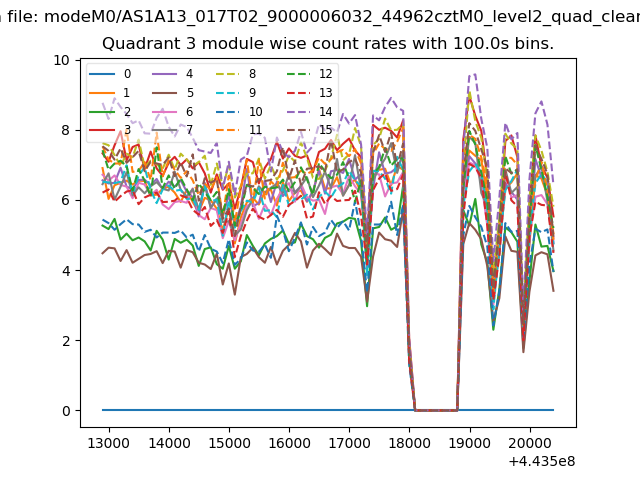
| Module-wise count rates for Quadrant C Data is divided into 100 sec bins |
 |
 |
| Module-wise count rates for Quadrant D Data is divided into 100 sec bins |
 |
 |
| Parameter | Plot |
|---|---|
| CZT HV Monitor | 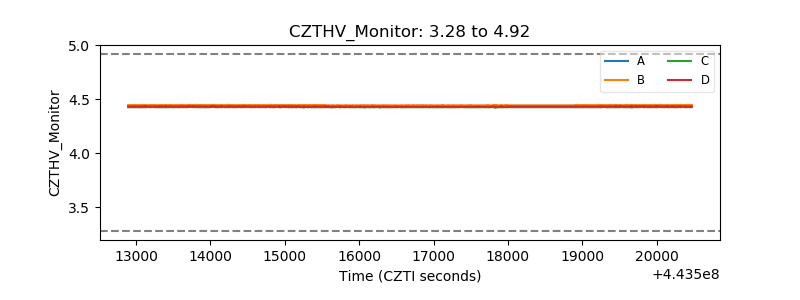 |
| D_VDD | 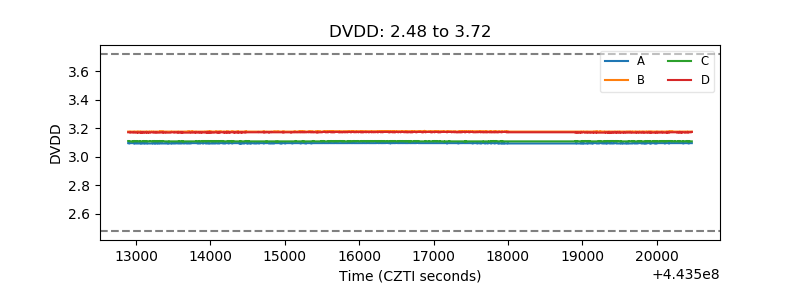 |
| Temperature 1 | 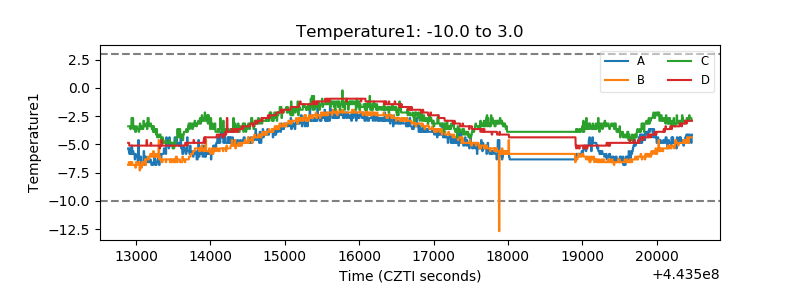 |
| Veto HV Monitor | 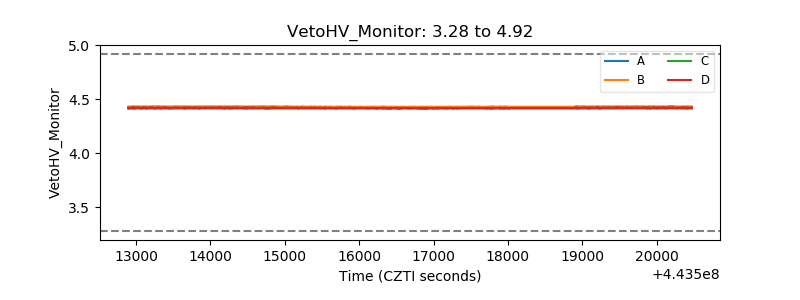 |
| Veto LLD | 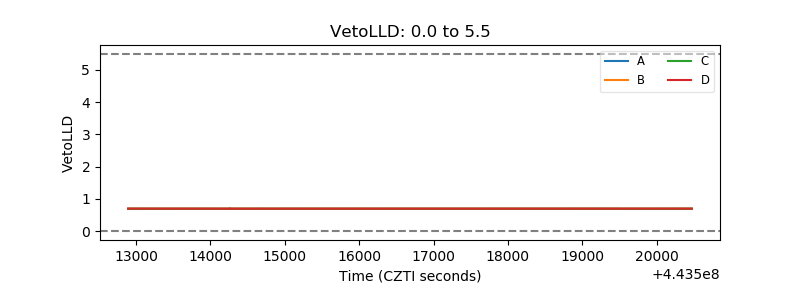 |
| Alpha Counter | 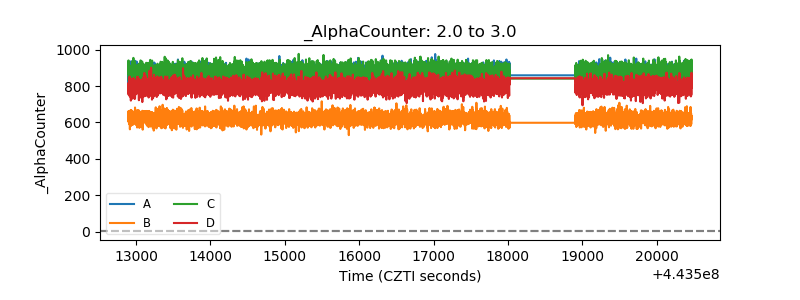 |
| _CPM_Rate | 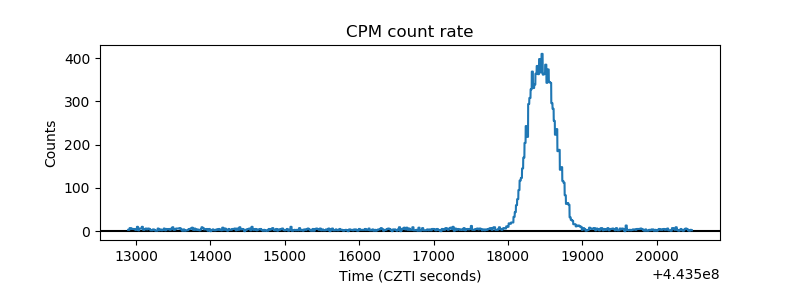 |
| CZT Counter | 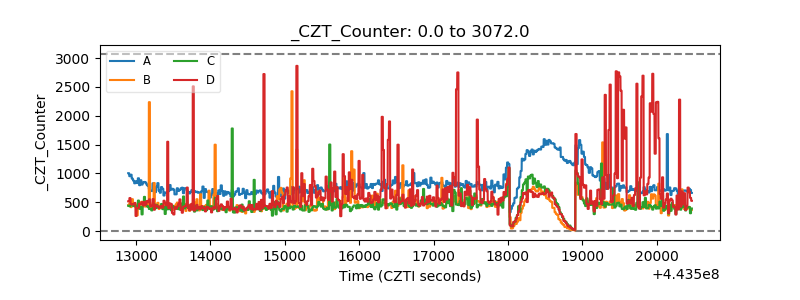 |
| +2.5 Volts monitor | 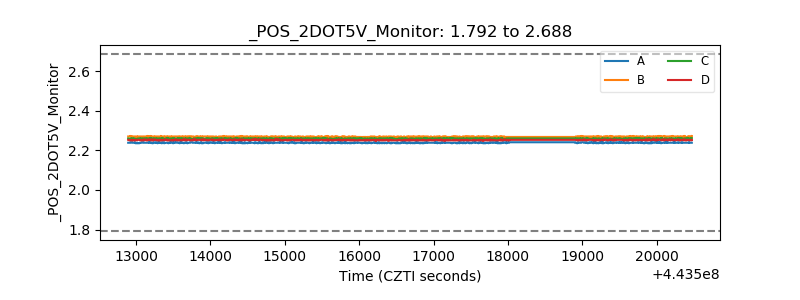 |
| +5 Volts monitor | 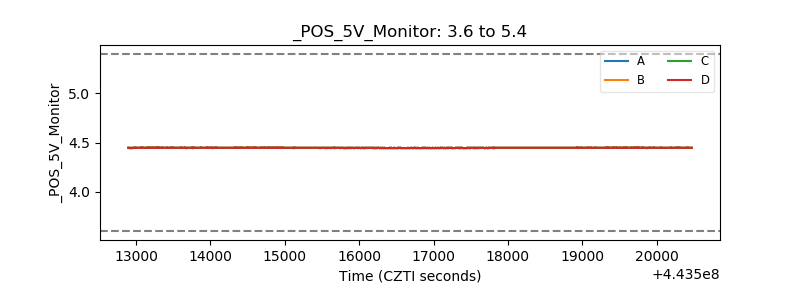 |
| _ROLL_ROT | 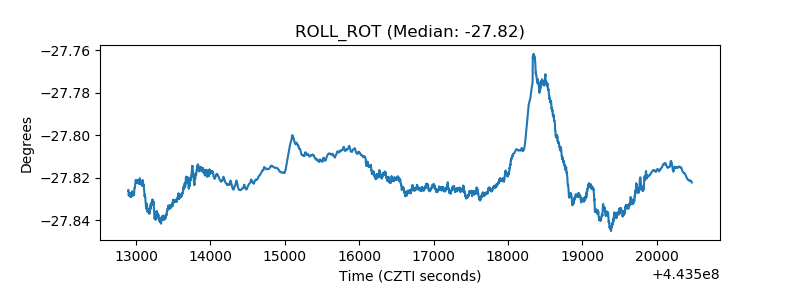 |
| _Roll_DEC | 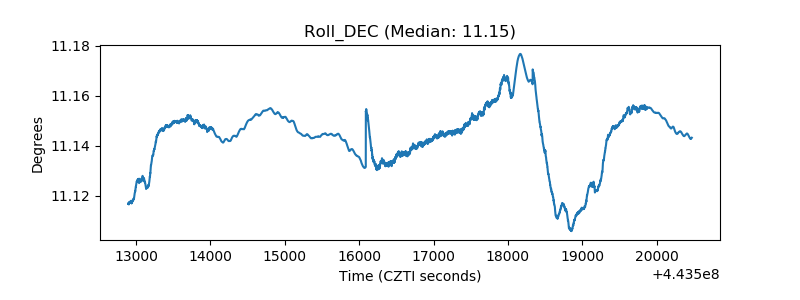 |
| _Roll_RA | 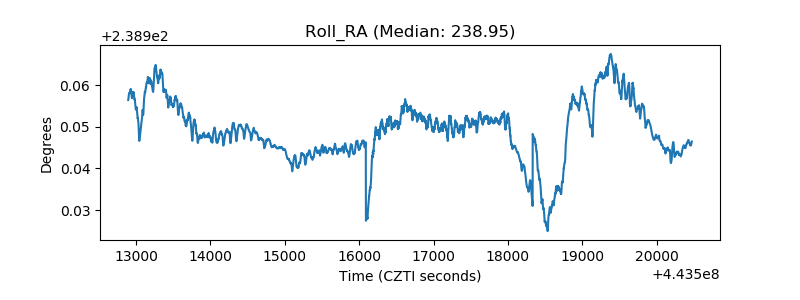 |
| Veto Counter | 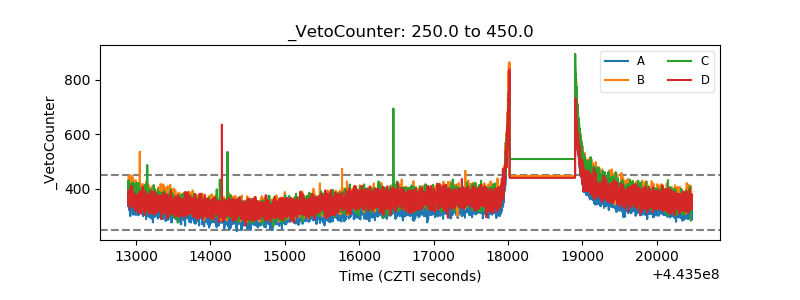 |