| Param | Original file | Final file |
|---|---|---|
| Filename | modeM0/AS1A13_017T02_9000006032_44964cztM0_level2.fits | modeM0/AS1A13_017T02_9000006032_44964cztM0_level2_quad_clean.evt |
| Size (bytes) | 455,526,720 | 99,524,160 |
| Size | 434.4 MB | 94.9 MB |
| Events in quadrant A | 4,851,155 | 668,423 |
| Events in quadrant B | 3,287,953 | 687,956 |
| Events in quadrant C | 2,816,274 | 674,350 |
| Events in quadrant D | 5,432,138 | 555,757 |
| Mode SS | |||
|---|---|---|---|
| Quadrant | BADHDUFLAG | Total packets | Discarded packets |
| A | 0 | 126 | 0 |
| B | 0 | 126 | 0 |
| C | 0 | 126 | 0 |
| D | 0 | 126 | 0 |
| Mode M0 | |||
|---|---|---|---|
| Quadrant | BADHDUFLAG | Total packets | Discarded packets |
| A | 0 | 18984 | 1 |
| B | 0 | 13820 | 1 |
| C | 0 | 12644 | 1 |
| D | 0 | 20333 | 1 |
| Mode M9 | |||
|---|---|---|---|
| Quadrant | BADHDUFLAG | Total packets | Discarded packets |
| A | 0 | 10 | 0 |
| B | 0 | 10 | 0 |
| C | 0 | 10 | 0 |
| D | 0 | 10 | 0 |
| Quadrant | Total seconds | Saturated seconds | Saturation percentage |
|---|---|---|---|
| A | 6107 | 123 | 2.014082% |
| B | 6108 | 145 | 2.373936% |
| C | 6108 | 54 | 0.884086% |
| D | 6108 | 736 | 12.049771% |
Noise dominated data is calculated using 1-second bins in cleaned event files. If a bin has >2000 counts, and if more than 50% of those come from <1% of pixels, then it is considered to be noise-dominated and hence unusable.
| Quadrant | # 1 sec bins | Bins with >0 counts | Bins with >2000 counts | High rate bins dominated by noise | Noise dominated (total time) | Noise dominated (detector-on time) | Marked lightcurve |
|---|---|---|---|---|---|---|---|
| A | 7121 | 6107 | 4 | 4 | 0.06% | 0.07% | 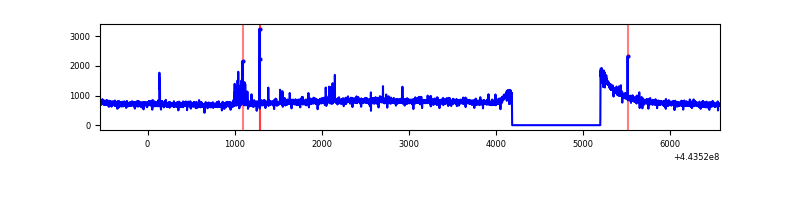 |
| B | 7123 | 6109 | 37 | 37 | 0.52% | 0.61% | 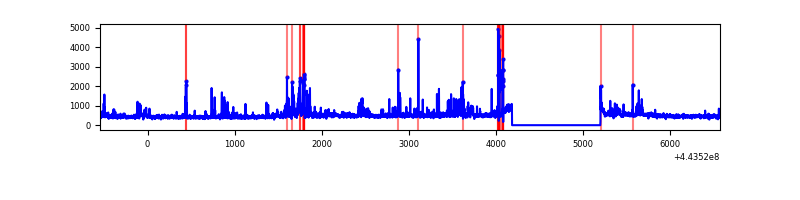 |
| C | 7123 | 6109 | 4 | 4 | 0.06% | 0.07% | 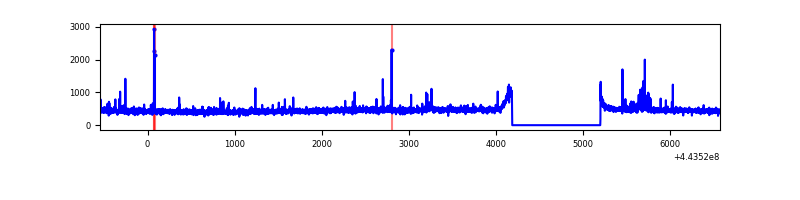 |
| D | 7123 | 6109 | 579 | 579 | 8.13% | 9.48% | 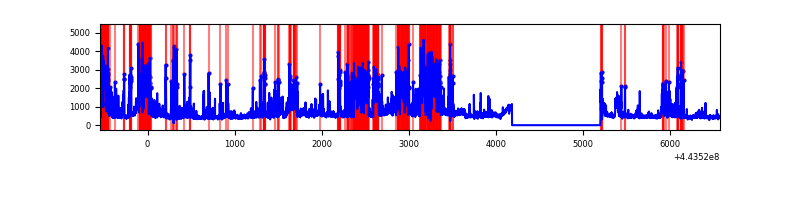 |
Top three noisy pixels from each quadrant. If the there are fewer than three noisy pixels in the level2.evt file, extra rows are filled as -1
| Pixel properties | Quadrant properties | ||||||
|---|---|---|---|---|---|---|---|
| Quadrant | DetID | PixID | Counts | Sigma | Mean | Median | Sigma |
| A | 10 | 83 | 2077216 | 14128.62 | 698 | 682 | 147.0 |
| A | 13 | 248 | 46300 | 310.38 | 698 | 682 | 147.0 |
| A | 0 | 243 | 12858 | 82.84 | 698 | 682 | 147.0 |
| B | 4 | 171 | 214951 | 1551.63 | 693 | 671 | 138.1 |
| B | 5 | 255 | 83597 | 600.48 | 693 | 671 | 138.1 |
| B | 5 | 172 | 70964 | 509.0 | 693 | 671 | 138.1 |
| C | 12 | 250 | 68458 | 415.0 | 691 | 697 | 163.3 |
| C | 14 | 254 | 24571 | 146.22 | 691 | 697 | 163.3 |
| C | 3 | 233 | 16565 | 97.18 | 691 | 697 | 163.3 |
| D | 13 | 187 | 794745 | 4724.18 | 662 | 642 | 168.1 |
| D | 13 | 249 | 686005 | 4077.28 | 662 | 642 | 168.1 |
| D | 5 | 222 | 679387 | 4037.91 | 662 | 642 | 168.1 |
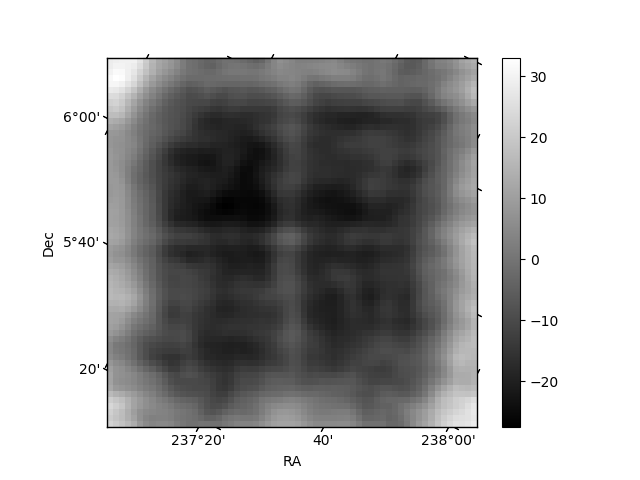
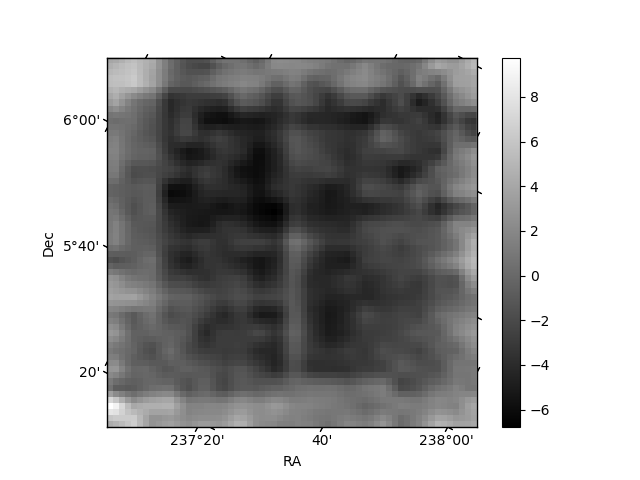
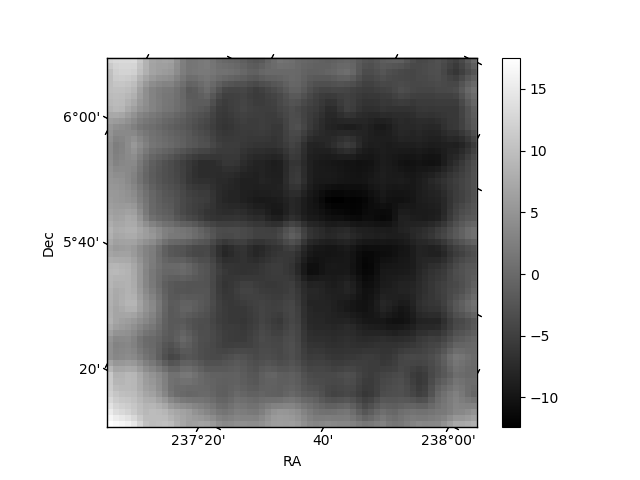
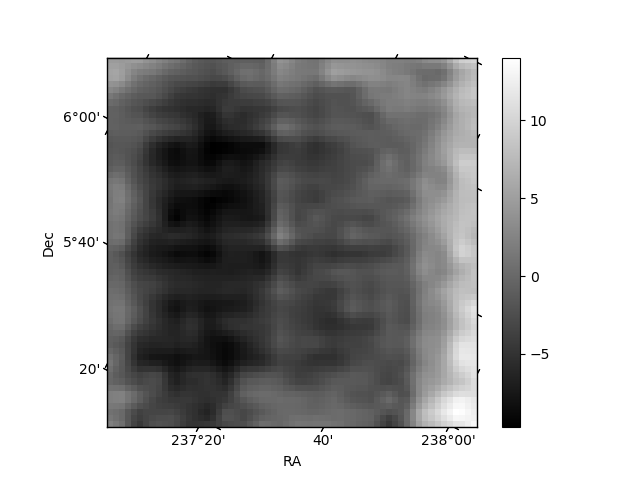
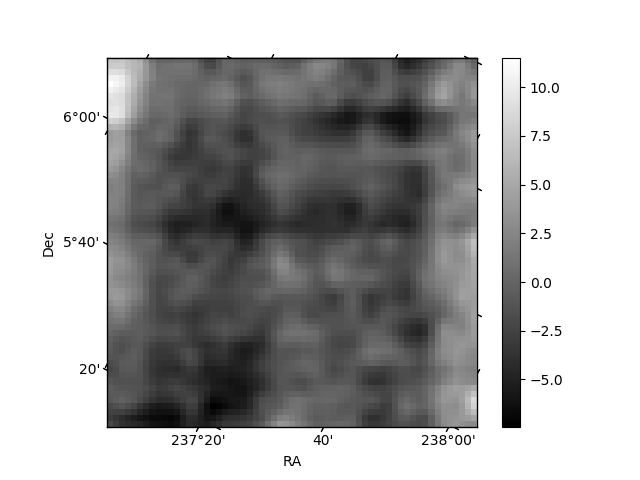
Histogram calculated using DETX and DETY for each event in the final _common_clean file
| Quadrant A | 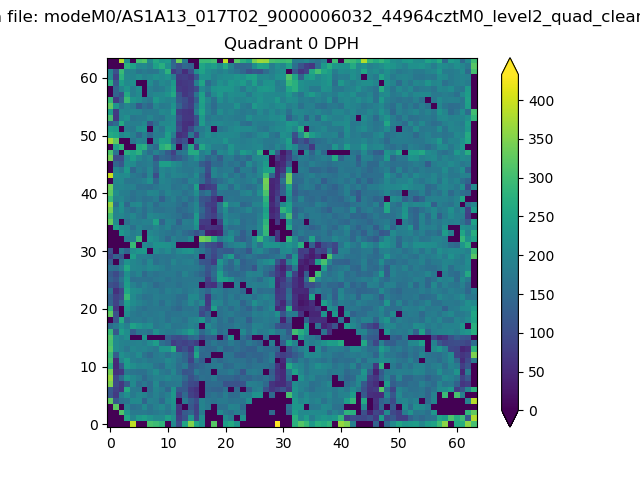 |
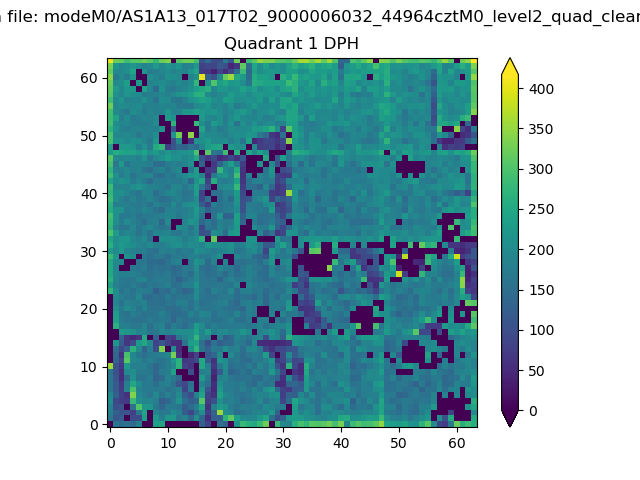 |
Quadrant B |
|---|---|---|---|
| Quadrant D | 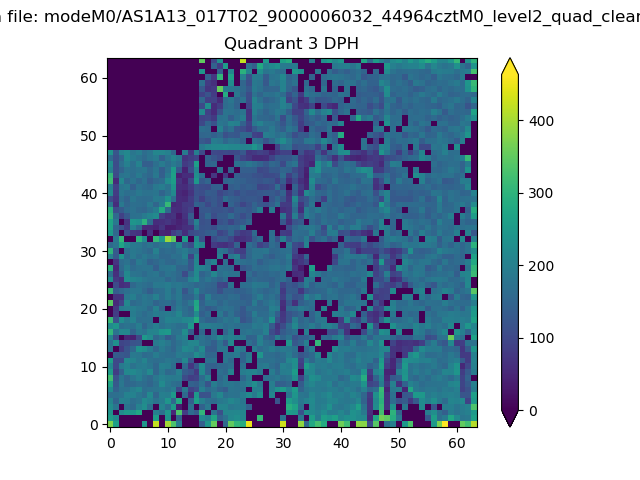 |
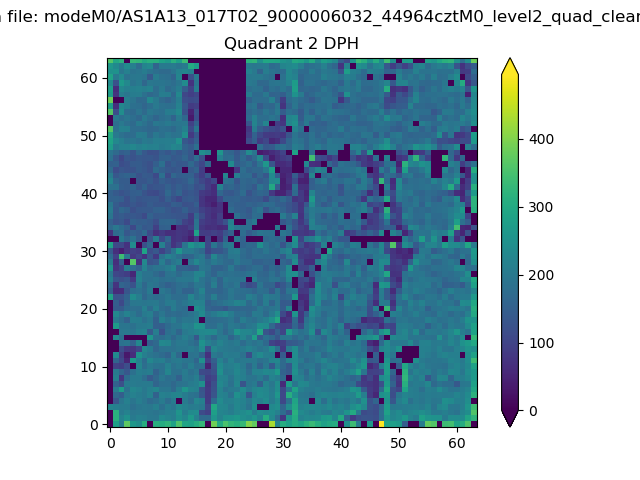 |
Quadrant C |
| Plot type | Count rate plots | Images |
|---|---|---|
| Comparison with Poisson distribution Blue bars denote a histogram of data divided into 1 sec bins. Red curve is a Poisson curve with rate = median count rate of data. |
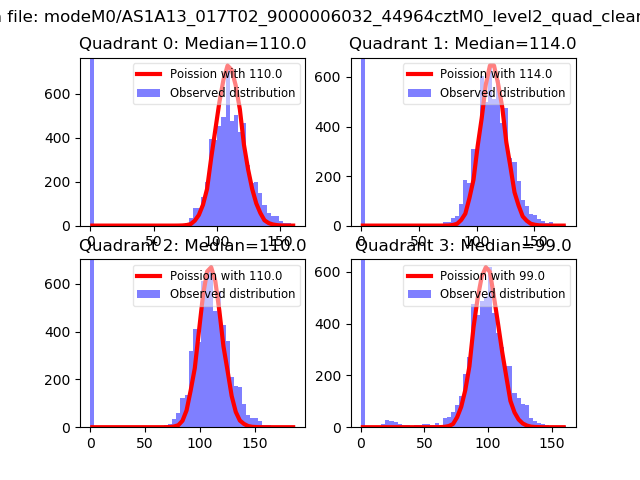 |
 |
| Quadrant-wise count rates Data is divided into 100 sec bins |
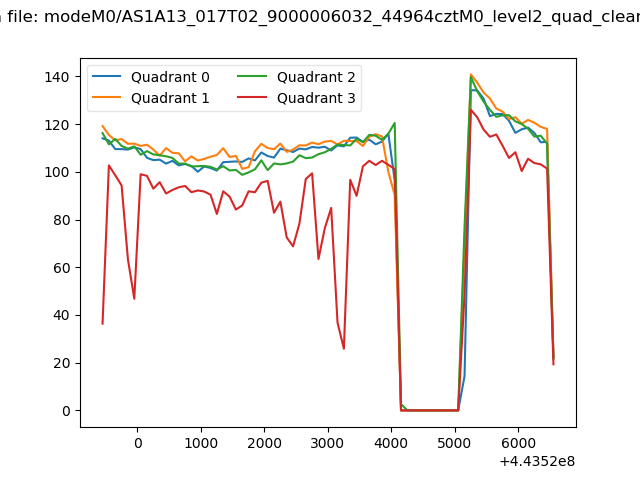 |
|
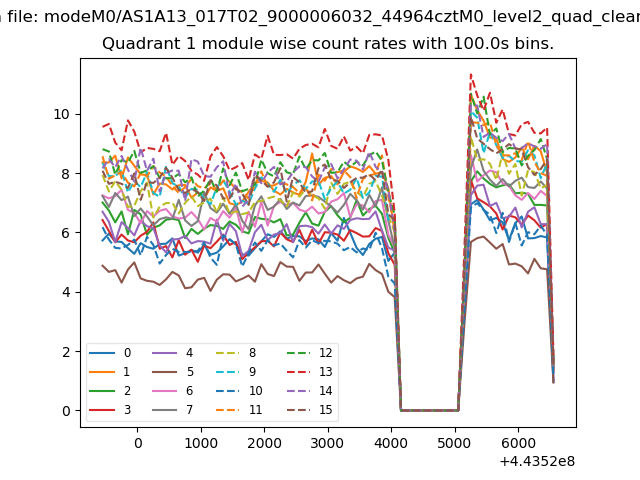
| Module-wise count rates for Quadrant A Data is divided into 100 sec bins |
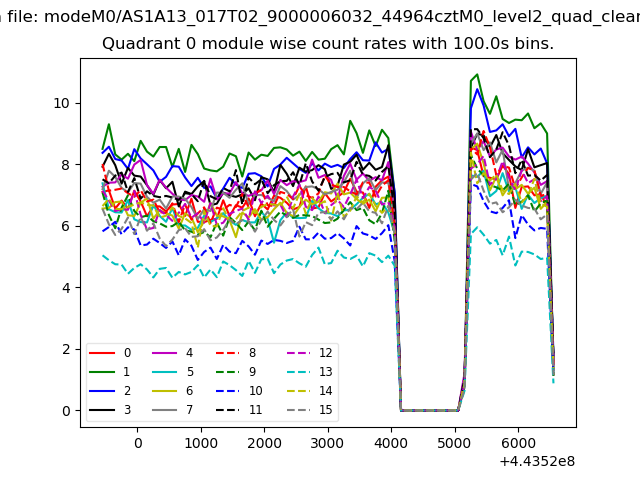 |
 |
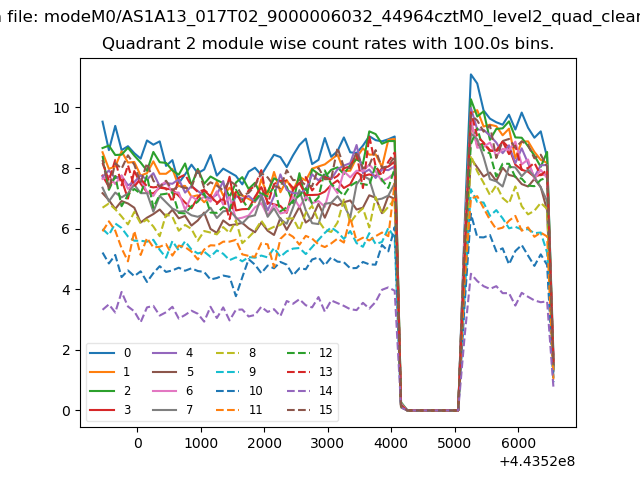
| Module-wise count rates for Quadrant B Data is divided into 100 sec bins |
 |
 |
| Module-wise count rates for Quadrant C Data is divided into 100 sec bins |
 |
 |
| Module-wise count rates for Quadrant D Data is divided into 100 sec bins |
 |
 |
| Parameter | Plot |
|---|---|
| CZT HV Monitor | 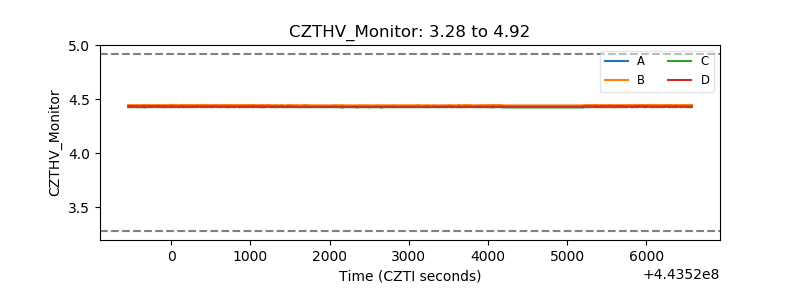 |
| D_VDD |  |
| Temperature 1 | 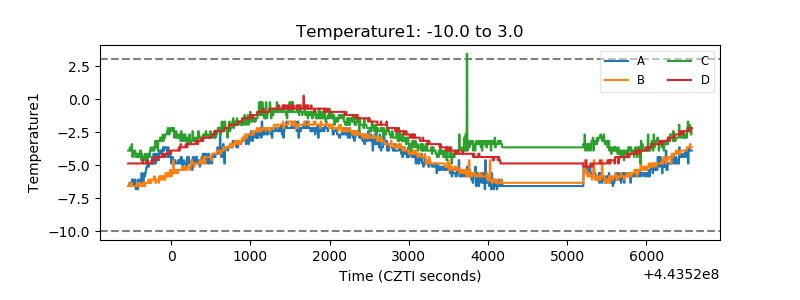 |
| Veto HV Monitor | 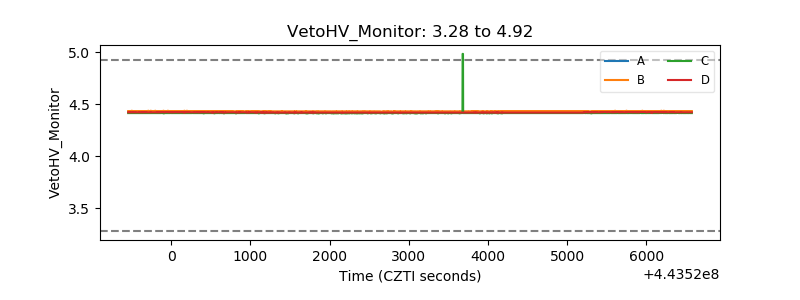 |
| Veto LLD | 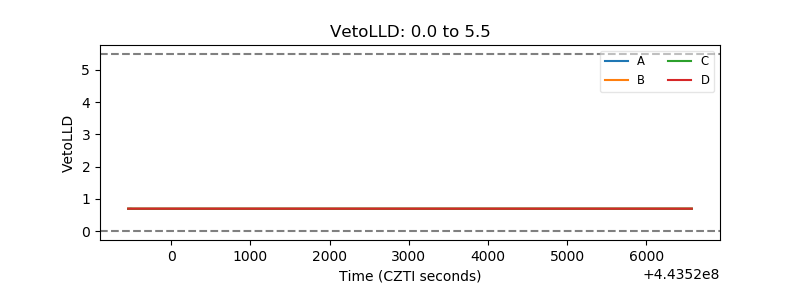 |
| Alpha Counter | 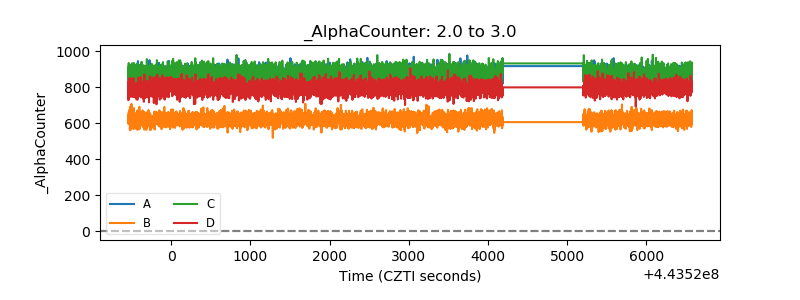 |
| _CPM_Rate | 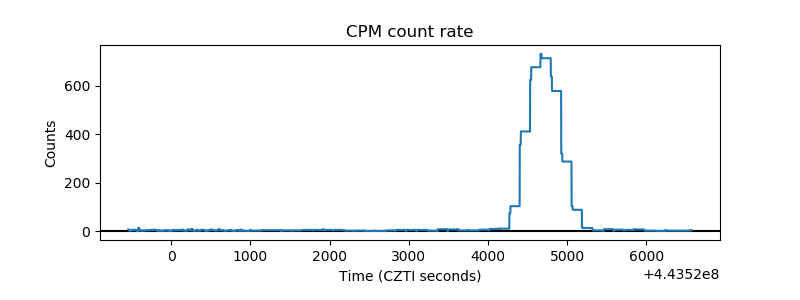 |
| CZT Counter | 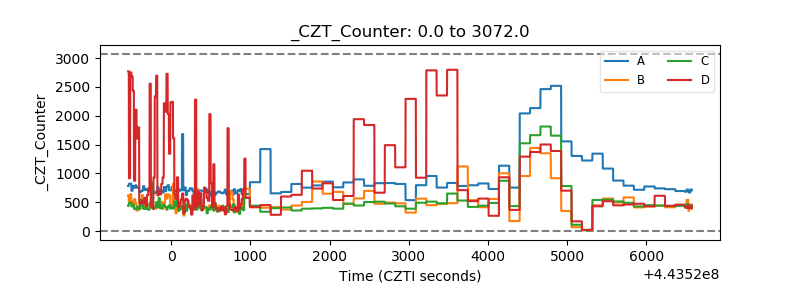 |
| +2.5 Volts monitor | 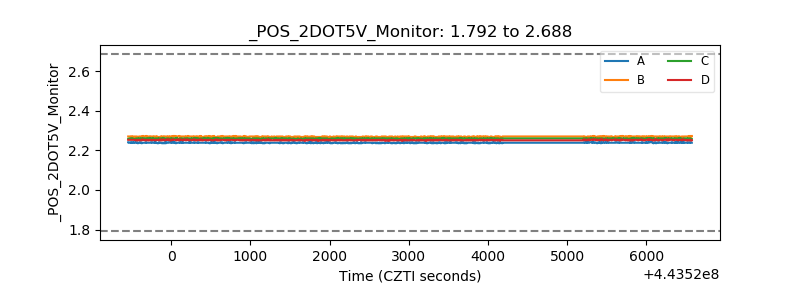 |
| +5 Volts monitor | 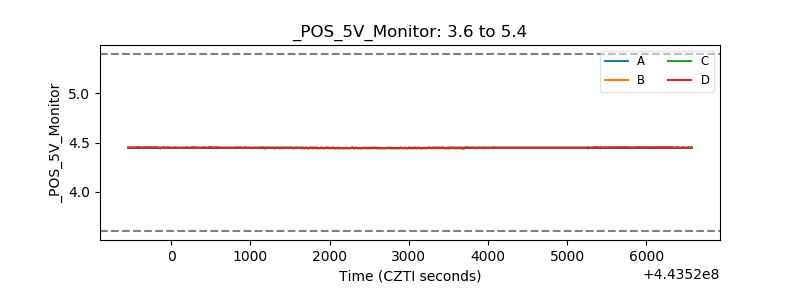 |
| _ROLL_ROT |  |
| _Roll_DEC | 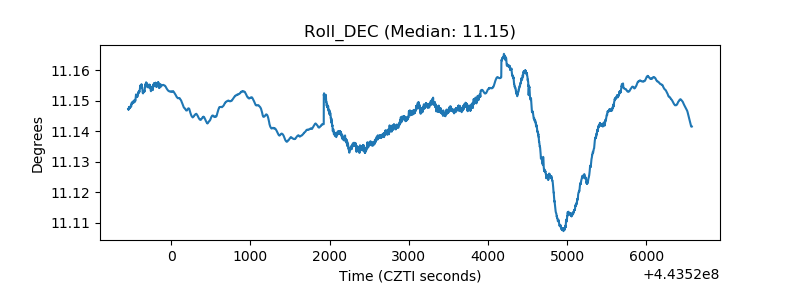 |
| _Roll_RA | 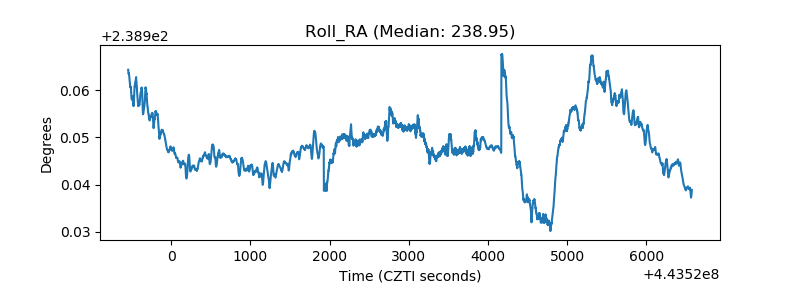 |
| Veto Counter | 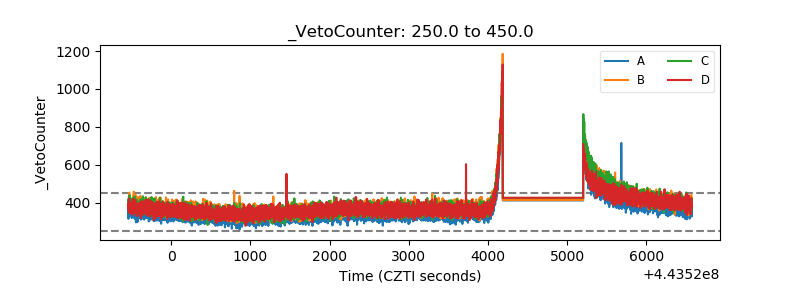 |