| Param | Original file | Final file |
|---|---|---|
| Filename | modeM0/AS1A13_017T02_9000006032_44965cztM0_level2.fits | modeM0/AS1A13_017T02_9000006032_44965cztM0_level2_quad_clean.evt |
| Size (bytes) | 467,591,040 | 111,625,920 |
| Size | 445.9 MB | 106.5 MB |
| Events in quadrant A | 5,274,697 | 741,419 |
| Events in quadrant B | 3,571,539 | 772,466 |
| Events in quadrant C | 3,180,489 | 754,760 |
| Events in quadrant D | 4,783,758 | 663,297 |
| Mode SS | |||
|---|---|---|---|
| Quadrant | BADHDUFLAG | Total packets | Discarded packets |
| A | 0 | 132 | 0 |
| B | 0 | 132 | 0 |
| C | 0 | 132 | 0 |
| D | 0 | 132 | 0 |
| Mode M0 | |||
|---|---|---|---|
| Quadrant | BADHDUFLAG | Total packets | Discarded packets |
| A | 0 | 20342 | 2 |
| B | 0 | 14625 | 2 |
| C | 0 | 13702 | 2 |
| D | 0 | 18492 | 2 |
| Mode M9 | |||
|---|---|---|---|
| Quadrant | BADHDUFLAG | Total packets | Discarded packets |
| A | 0 | 11 | 0 |
| B | 0 | 12 | 0 |
| C | 0 | 12 | 0 |
| D | 0 | 12 | 0 |
| Quadrant | Total seconds | Saturated seconds | Saturation percentage |
|---|---|---|---|
| A | 6417 | 167 | 2.602462% |
| B | 6417 | 136 | 2.119370% |
| C | 6417 | 33 | 0.514259% |
| D | 6417 | 299 | 4.659498% |
Noise dominated data is calculated using 1-second bins in cleaned event files. If a bin has >2000 counts, and if more than 50% of those come from <1% of pixels, then it is considered to be noise-dominated and hence unusable.
| Quadrant | # 1 sec bins | Bins with >0 counts | Bins with >2000 counts | High rate bins dominated by noise | Noise dominated (total time) | Noise dominated (detector-on time) | Marked lightcurve |
|---|---|---|---|---|---|---|---|
| A | 7562 | 6418 | 3 | 3 | 0.04% | 0.05% | 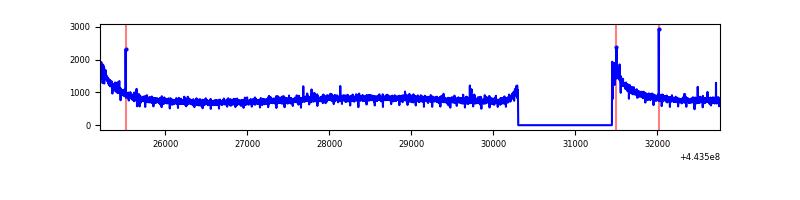 |
| B | 7562 | 6418 | 53 | 53 | 0.70% | 0.83% | 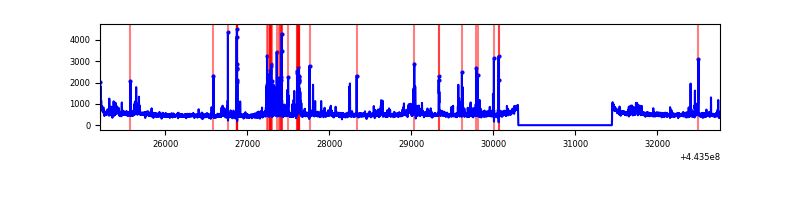 |
| C | 7562 | 6418 | 8 | 8 | 0.11% | 0.12% | 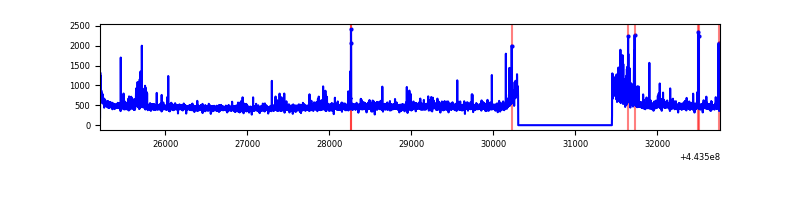 |
| D | 7562 | 6418 | 228 | 228 | 3.02% | 3.55% | 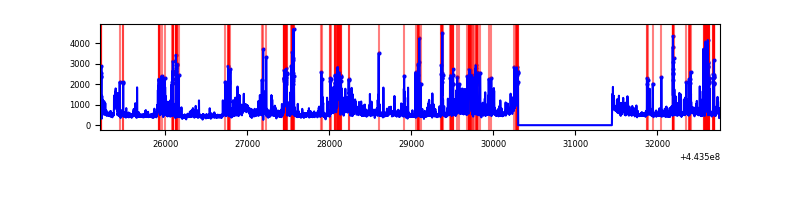 |
Top three noisy pixels from each quadrant. If the there are fewer than three noisy pixels in the level2.evt file, extra rows are filled as -1
| Pixel properties | Quadrant properties | ||||||
|---|---|---|---|---|---|---|---|
| Quadrant | DetID | PixID | Counts | Sigma | Mean | Median | Sigma |
| A | 10 | 83 | 2293954 | 14387.45 | 763 | 748 | 159.4 |
| A | 7 | 3 | 12425 | 73.26 | 763 | 748 | 159.4 |
| A | 13 | 248 | 11685 | 68.62 | 763 | 748 | 159.4 |
| B | 4 | 171 | 119555 | 790.01 | 760 | 737 | 150.4 |
| B | 0 | 219 | 83150 | 547.96 | 760 | 737 | 150.4 |
| B | 5 | 255 | 81358 | 536.04 | 760 | 737 | 150.4 |
| C | 12 | 250 | 102767 | 572.67 | 756 | 761 | 178.1 |
| C | 1 | 3 | 71579 | 397.58 | 756 | 761 | 178.1 |
| C | 14 | 254 | 41548 | 228.98 | 756 | 761 | 178.1 |
| D | 1 | 52 | 387041 | 2069.45 | 743 | 722 | 186.7 |
| D | 13 | 249 | 318333 | 1701.39 | 743 | 722 | 186.7 |
| D | 13 | 187 | 280282 | 1497.56 | 743 | 722 | 186.7 |
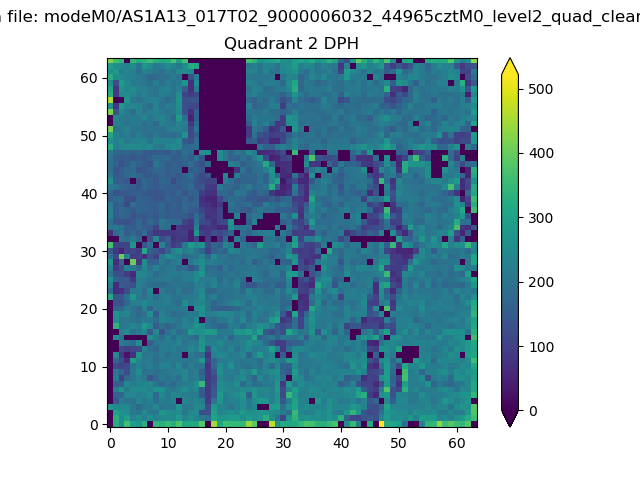
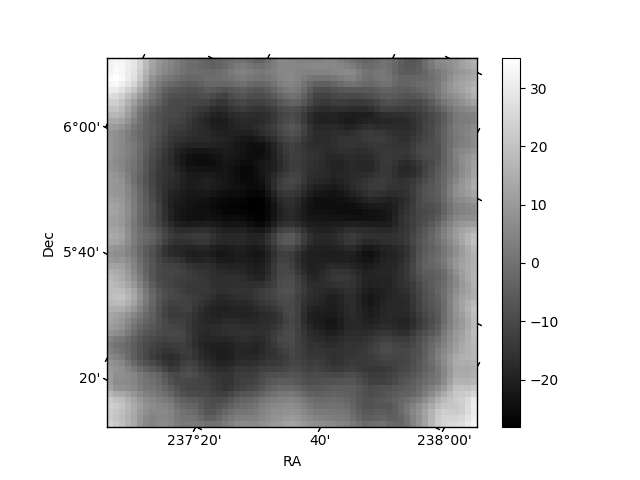
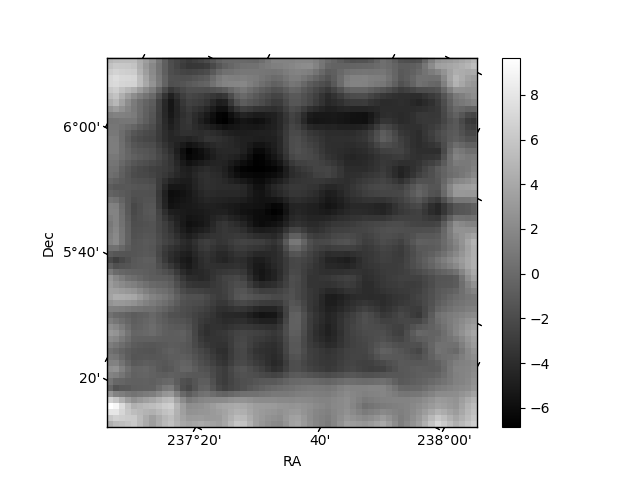
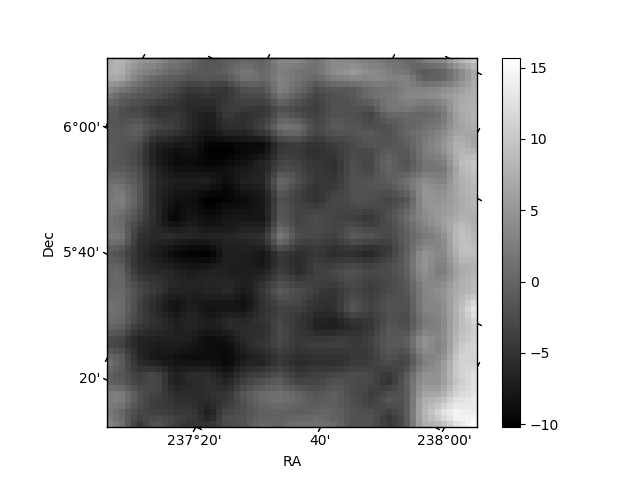
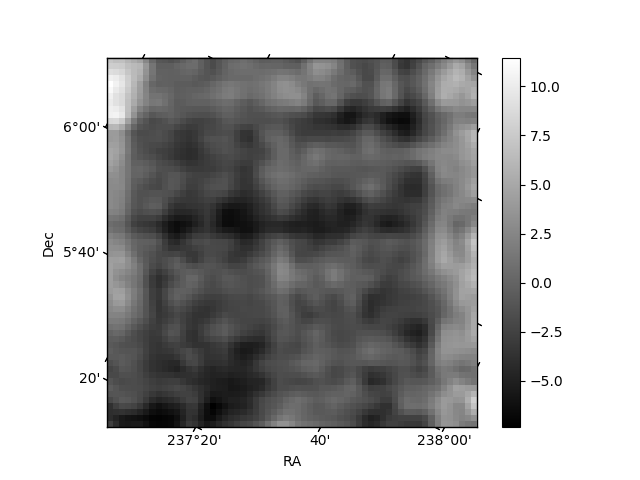
Histogram calculated using DETX and DETY for each event in the final _common_clean file
| Quadrant A | 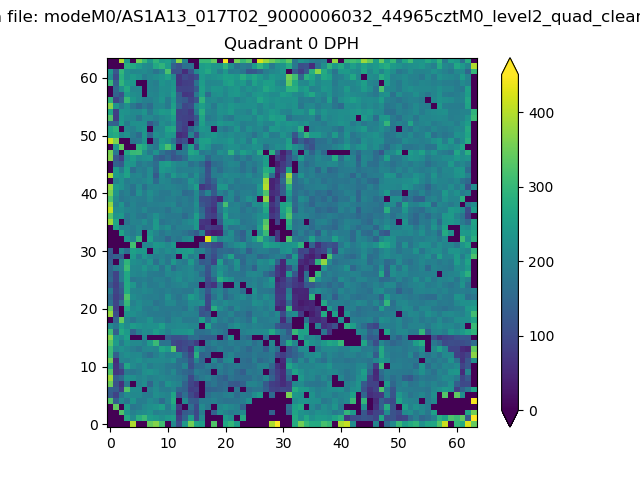 |
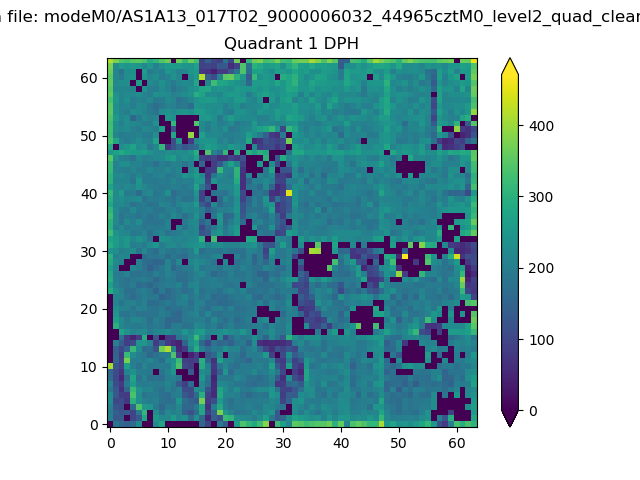 |
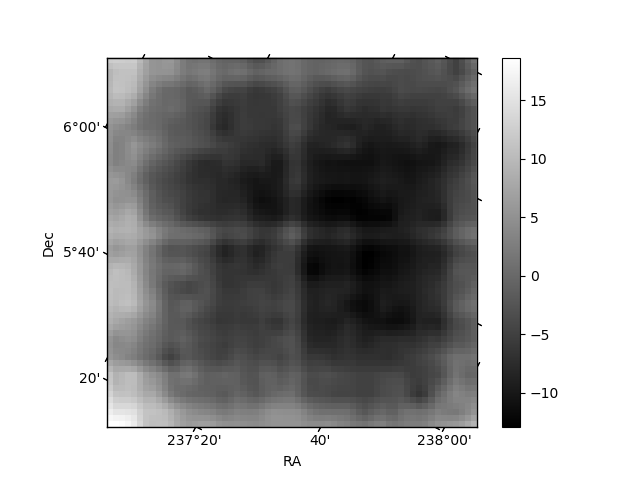
Quadrant B |
|---|---|---|---|
| Quadrant D | 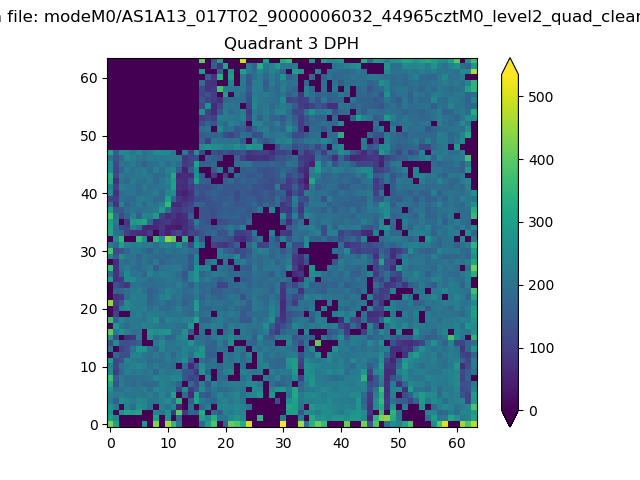 |
 |
Quadrant C |
| Plot type | Count rate plots | Images |
|---|---|---|
| Comparison with Poisson distribution Blue bars denote a histogram of data divided into 1 sec bins. Red curve is a Poisson curve with rate = median count rate of data. |
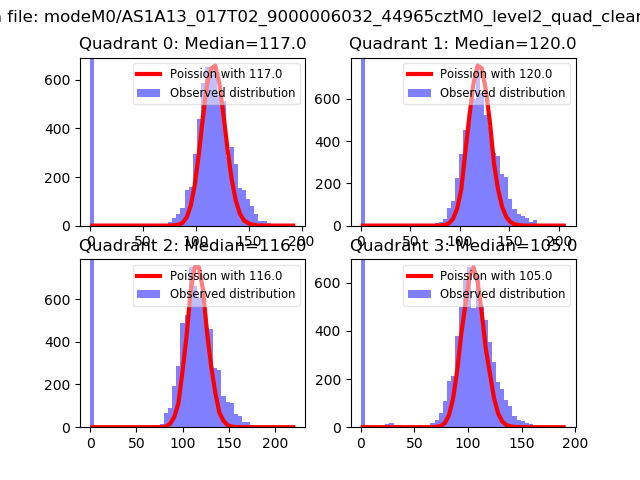 |
 |
| Quadrant-wise count rates Data is divided into 100 sec bins |
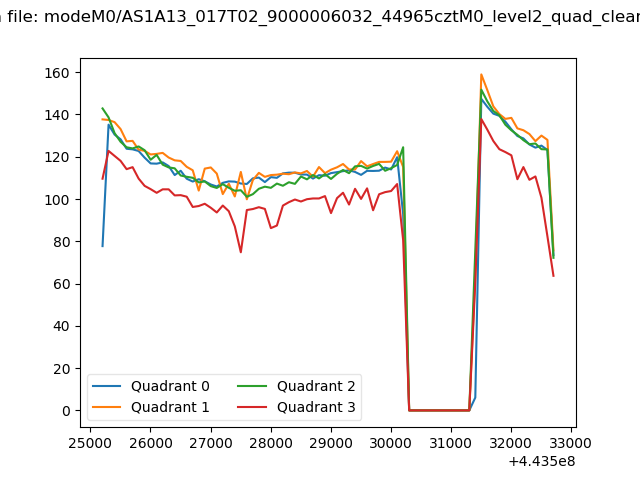 |
|
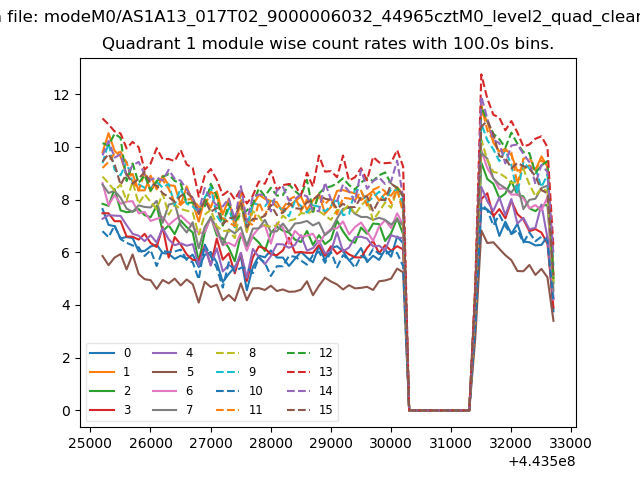
| Module-wise count rates for Quadrant A Data is divided into 100 sec bins |
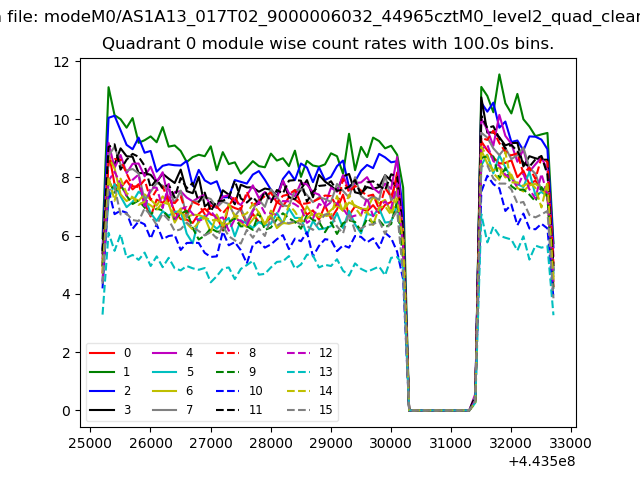 |
 |
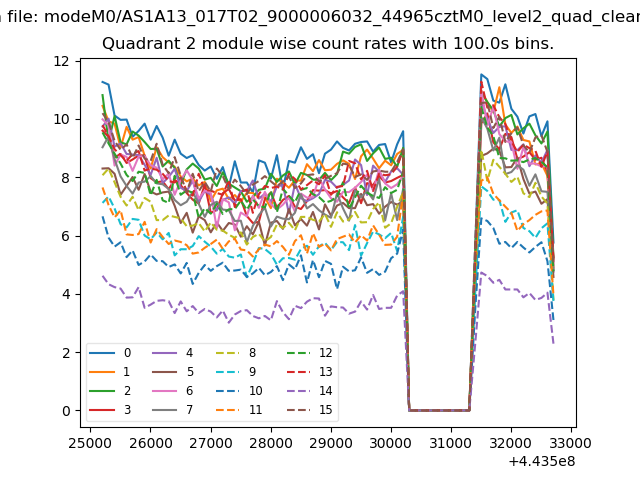
| Module-wise count rates for Quadrant B Data is divided into 100 sec bins |
 |
 |
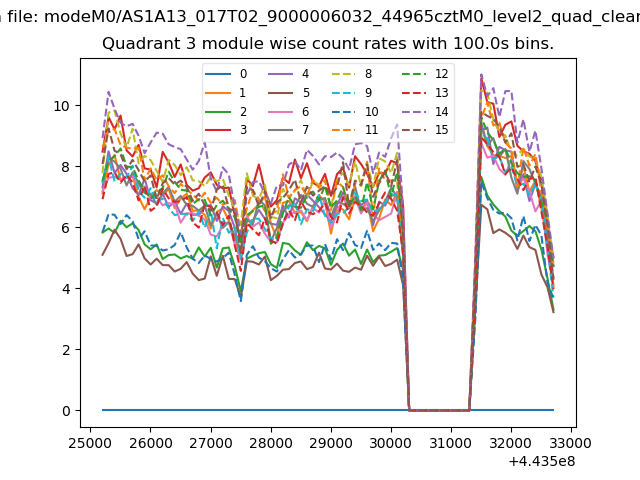
| Module-wise count rates for Quadrant C Data is divided into 100 sec bins |
 |
 |
| Module-wise count rates for Quadrant D Data is divided into 100 sec bins |
 |
 |
| Parameter | Plot |
|---|---|
| CZT HV Monitor | 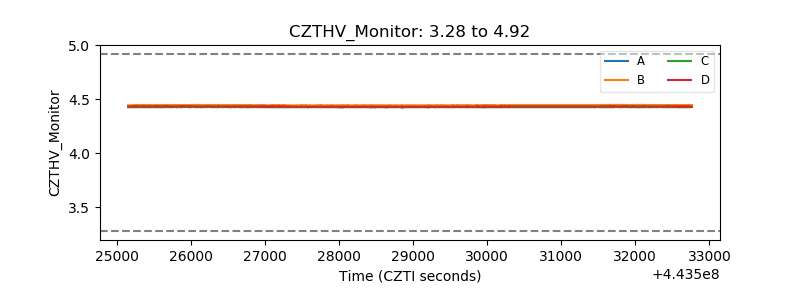 |
| D_VDD | 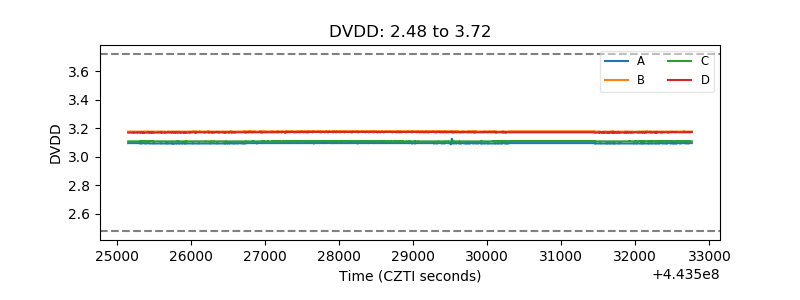 |
| Temperature 1 | 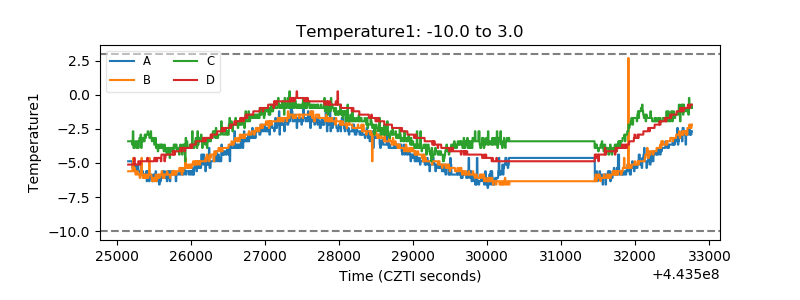 |
| Veto HV Monitor | 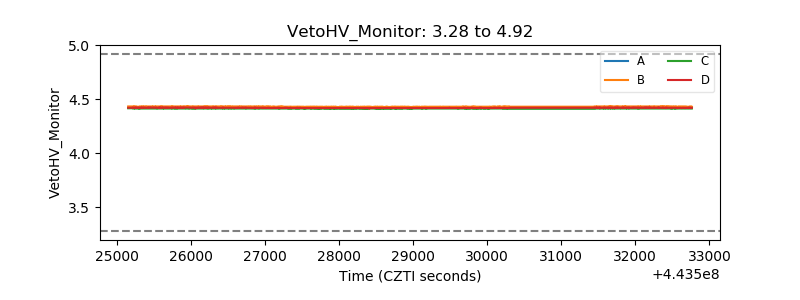 |
| Veto LLD | 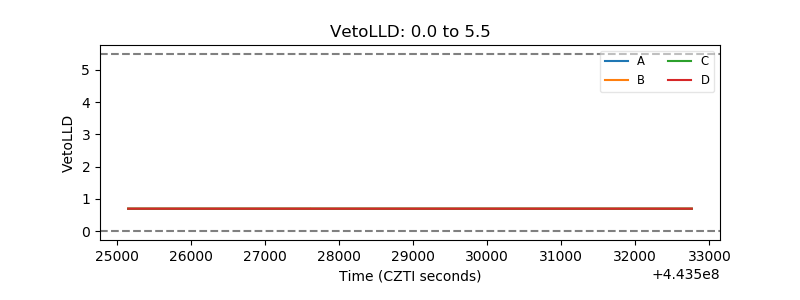 |
| Alpha Counter | 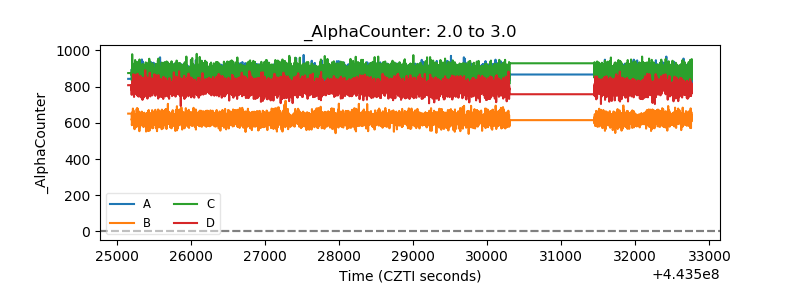 |
| _CPM_Rate | 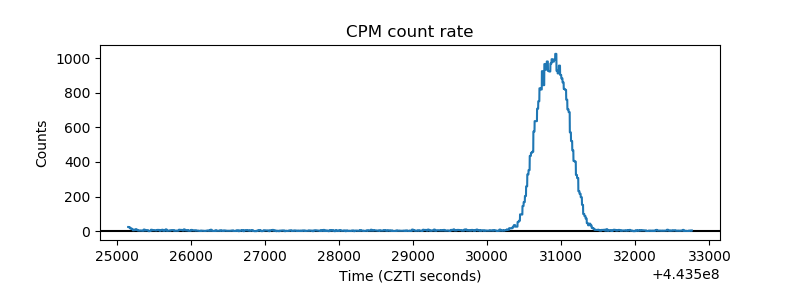 |
| CZT Counter | 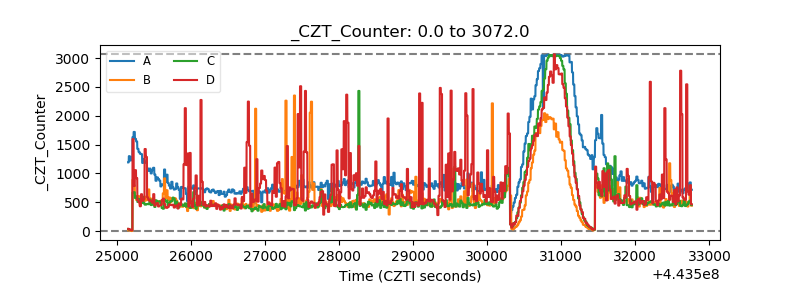 |
| +2.5 Volts monitor | 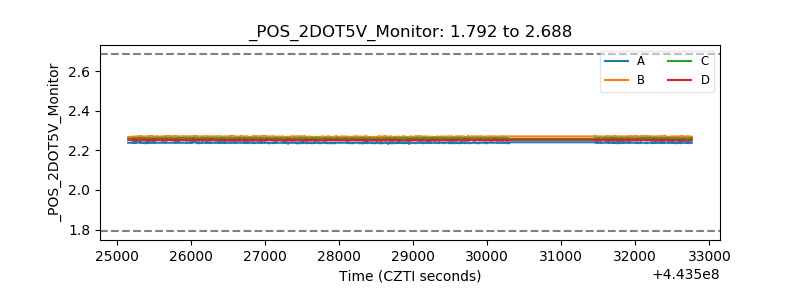 |
| +5 Volts monitor | 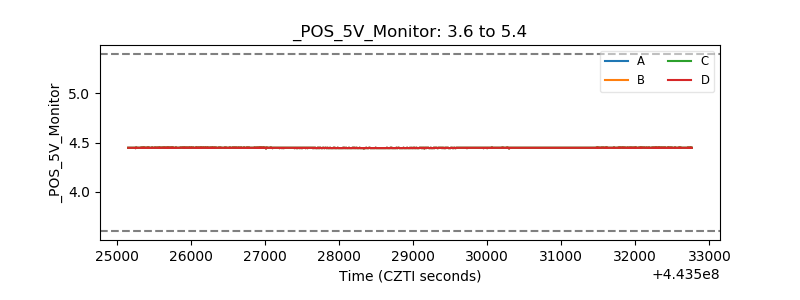 |
| _ROLL_ROT |  |
| _Roll_DEC | 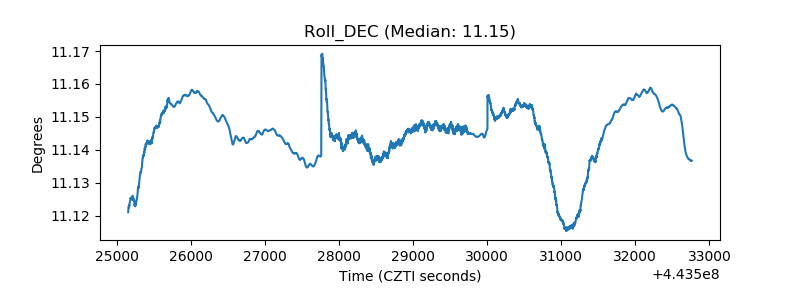 |
| _Roll_RA | 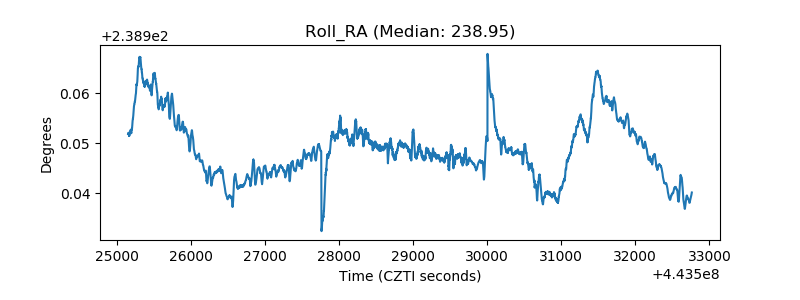 |
| Veto Counter |  |