| Param | Original file | Final file |
|---|---|---|
| Filename | modeM0/AS1A13_017T02_9000006032_44966cztM0_level2.fits | modeM0/AS1A13_017T02_9000006032_44966cztM0_level2_quad_clean.evt |
| Size (bytes) | 295,338,240 | 65,911,680 |
| Size | 281.7 MB | 62.9 MB |
| Events in quadrant A | 3,021,304 | 449,329 |
| Events in quadrant B | 2,253,467 | 456,102 |
| Events in quadrant C | 1,915,836 | 439,496 |
| Events in quadrant D | 3,448,683 | 384,831 |
| Mode SS | |||
|---|---|---|---|
| Quadrant | BADHDUFLAG | Total packets | Discarded packets |
| A | 0 | 76 | 0 |
| B | 0 | 76 | 0 |
| C | 0 | 76 | 0 |
| D | 0 | 76 | 0 |
| Mode M0 | |||
|---|---|---|---|
| Quadrant | BADHDUFLAG | Total packets | Discarded packets |
| A | 0 | 11420 | 0 |
| B | 0 | 9035 | 0 |
| C | 0 | 8066 | 0 |
| D | 0 | 12857 | 0 |
| Quadrant | Total seconds | Saturated seconds | Saturation percentage |
|---|---|---|---|
| A | 3764 | 4 | 0.106270% |
| B | 3764 | 50 | 1.328374% |
| C | 3764 | 13 | 0.345377% |
| D | 3765 | 226 | 6.002656% |
Noise dominated data is calculated using 1-second bins in cleaned event files. If a bin has >2000 counts, and if more than 50% of those come from <1% of pixels, then it is considered to be noise-dominated and hence unusable.
| Quadrant | # 1 sec bins | Bins with >0 counts | Bins with >2000 counts | High rate bins dominated by noise | Noise dominated (total time) | Noise dominated (detector-on time) | Marked lightcurve |
|---|---|---|---|---|---|---|---|
| A | 3764 | 3764 | 1 | 1 | 0.03% | 0.03% | 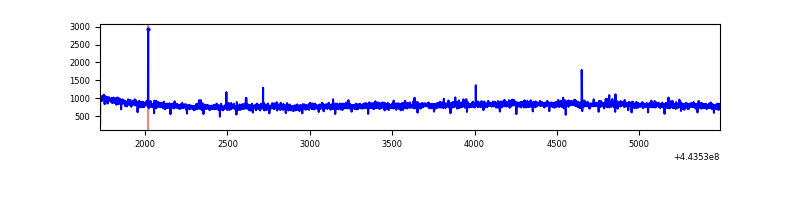 |
| B | 3764 | 3764 | 30 | 30 | 0.80% | 0.80% | 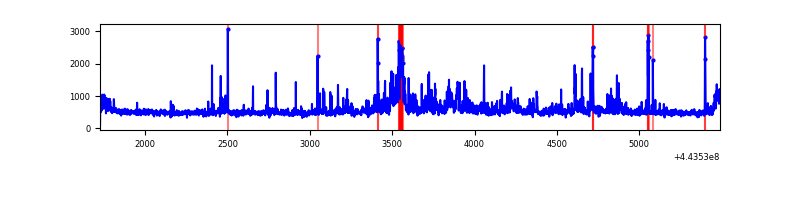 |
| C | 3764 | 3764 | 15 | 15 | 0.40% | 0.40% | 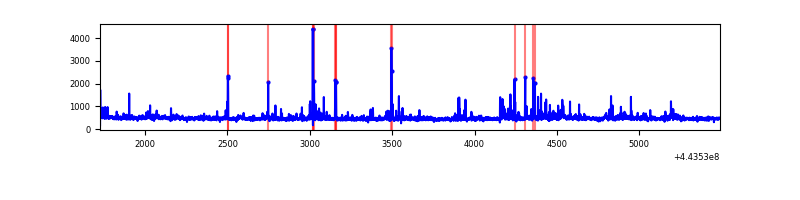 |
| D | 3765 | 3765 | 192 | 192 | 5.10% | 5.10% | 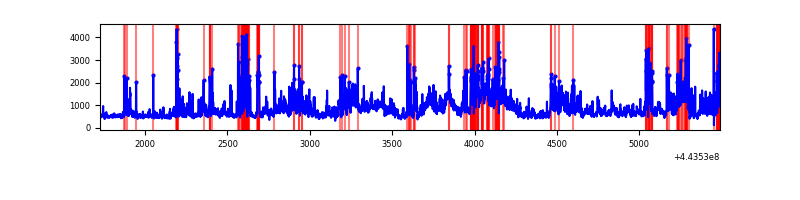 |
Top three noisy pixels from each quadrant. If the there are fewer than three noisy pixels in the level2.evt file, extra rows are filled as -1
| Pixel properties | Quadrant properties | ||||||
|---|---|---|---|---|---|---|---|
| Quadrant | DetID | PixID | Counts | Sigma | Mean | Median | Sigma |
| A | 10 | 83 | 1282415 | 13814.94 | 445 | 436 | 92.8 |
| A | 0 | 243 | 6726 | 67.78 | 445 | 436 | 92.8 |
| A | 3 | 137 | 4672 | 45.65 | 445 | 436 | 92.8 |
| B | 0 | 168 | 110647 | 1292.03 | 438 | 425 | 85.3 |
| B | 4 | 171 | 99322 | 1159.28 | 438 | 425 | 85.3 |
| B | 3 | 112 | 81036 | 944.93 | 438 | 425 | 85.3 |
| C | 12 | 250 | 75097 | 722.22 | 436 | 441 | 103.4 |
| C | 14 | 254 | 64110 | 615.93 | 436 | 441 | 103.4 |
| C | 12 | 2 | 27771 | 264.39 | 436 | 441 | 103.4 |
| D | 12 | 33 | 321068 | 2957.6 | 429 | 417 | 108.4 |
| D | 13 | 174 | 300888 | 2771.47 | 429 | 417 | 108.4 |
| D | 12 | 233 | 224626 | 2068.05 | 429 | 417 | 108.4 |
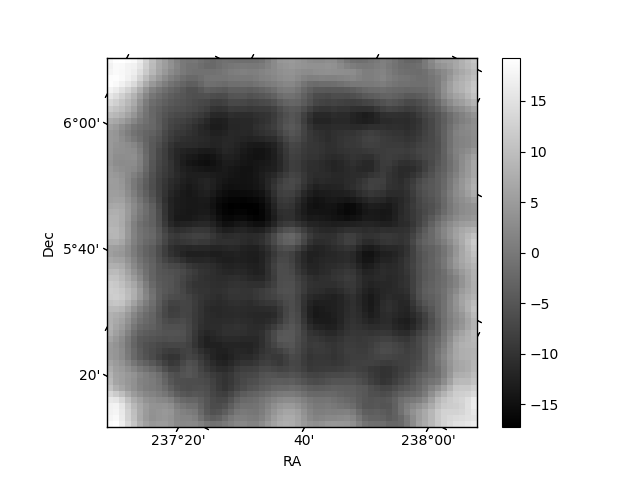
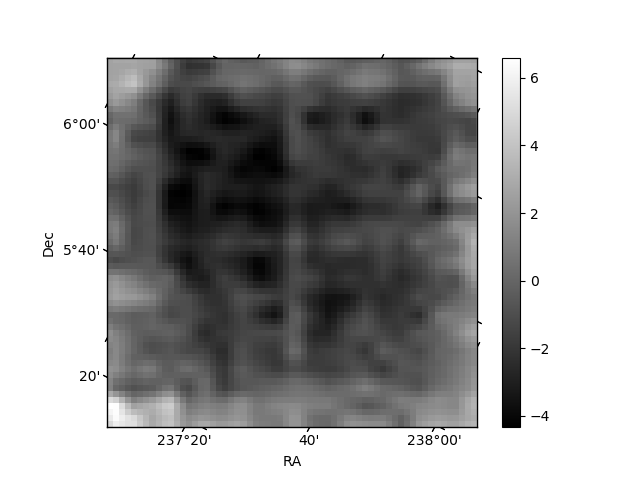
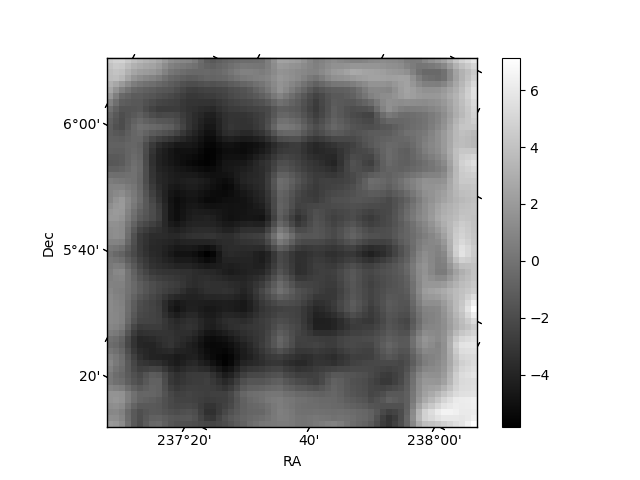
Histogram calculated using DETX and DETY for each event in the final _common_clean file
| Quadrant A | 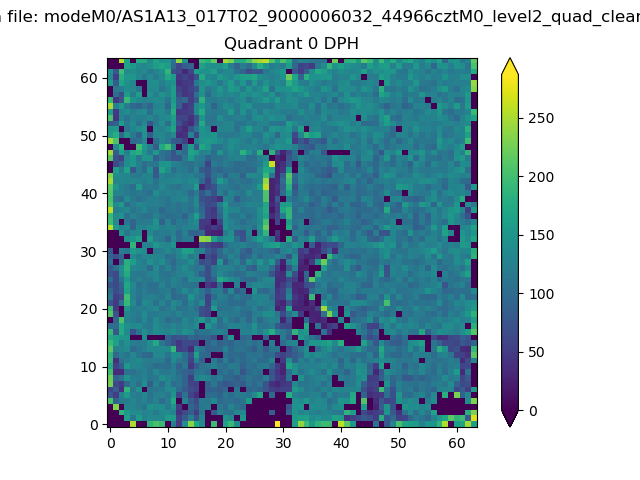 |
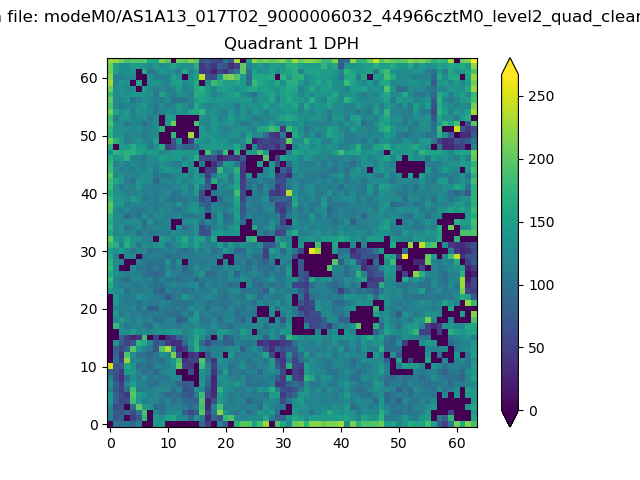 |
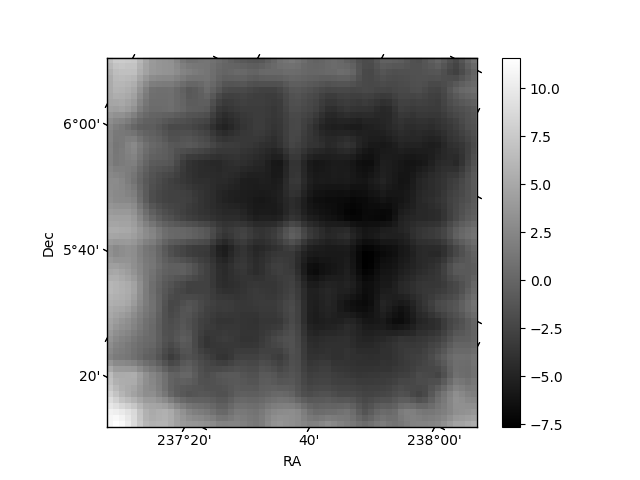
Quadrant B |
|---|---|---|---|
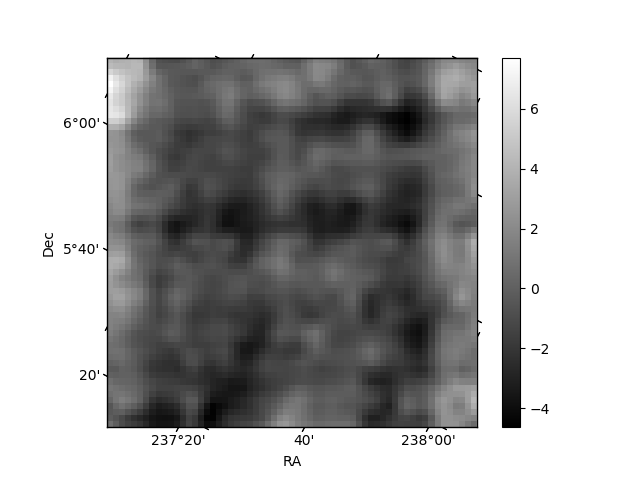
| Quadrant D | 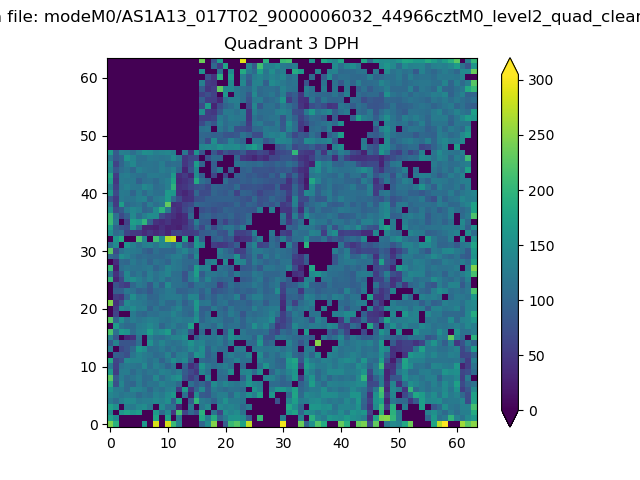 |
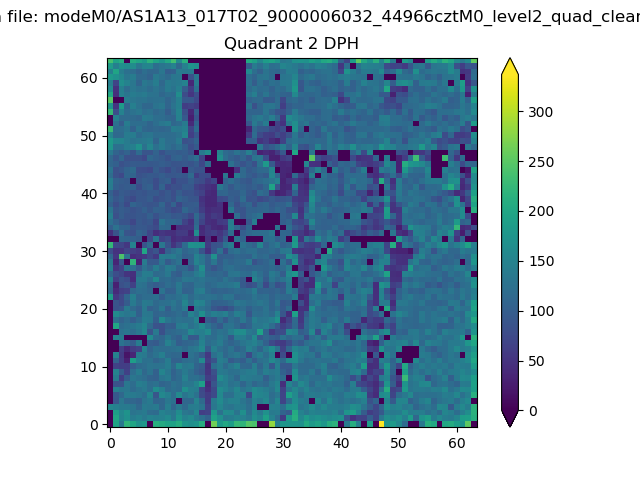 |
Quadrant C |
| Plot type | Count rate plots | Images |
|---|---|---|
| Comparison with Poisson distribution Blue bars denote a histogram of data divided into 1 sec bins. Red curve is a Poisson curve with rate = median count rate of data. |
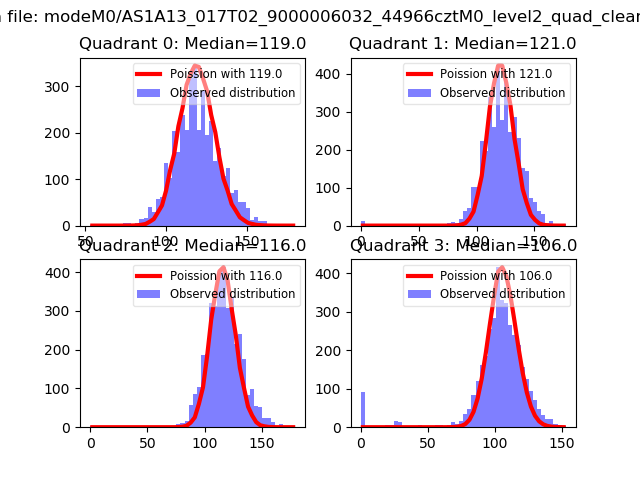 |
 |
| Quadrant-wise count rates Data is divided into 100 sec bins |
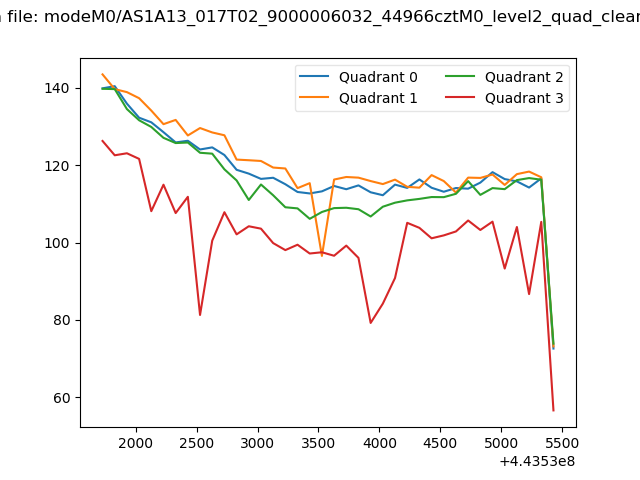 |
|
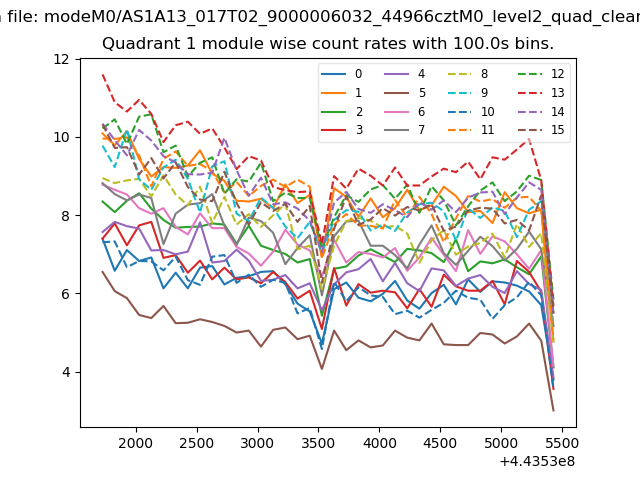
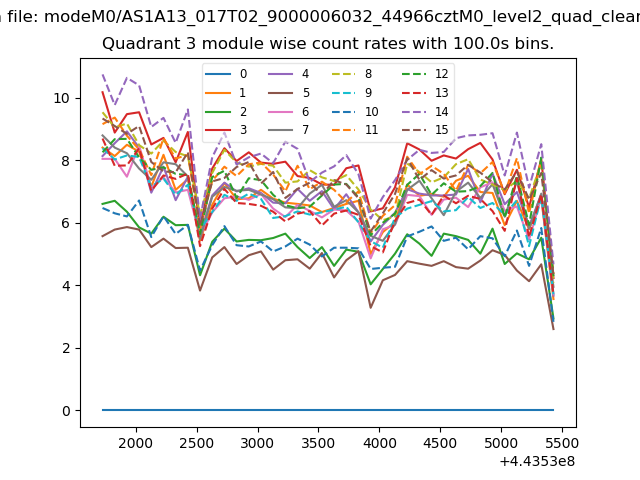
| Module-wise count rates for Quadrant A Data is divided into 100 sec bins |
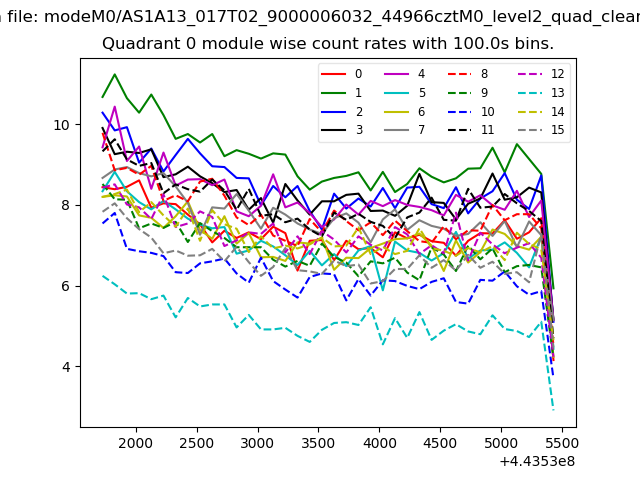 |
 |
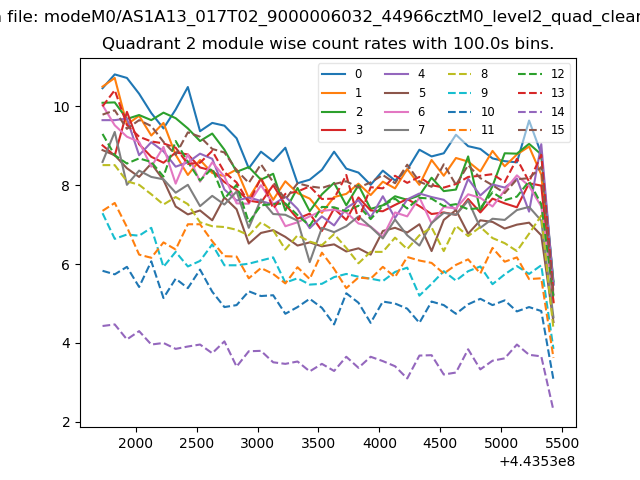
| Module-wise count rates for Quadrant B Data is divided into 100 sec bins |
 |
 |
| Module-wise count rates for Quadrant C Data is divided into 100 sec bins |
 |
 |
| Module-wise count rates for Quadrant D Data is divided into 100 sec bins |
 |
 |
| Parameter | Plot |
|---|---|
| CZT HV Monitor | 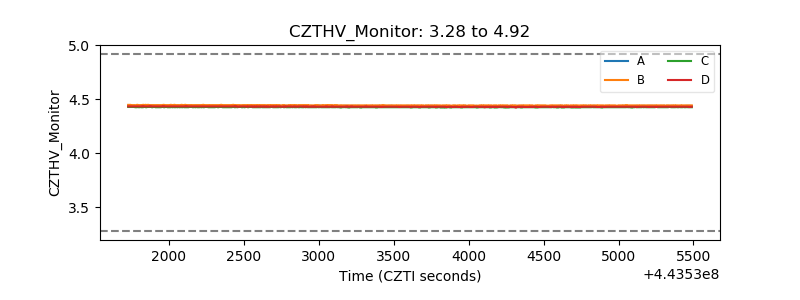 |
| D_VDD | 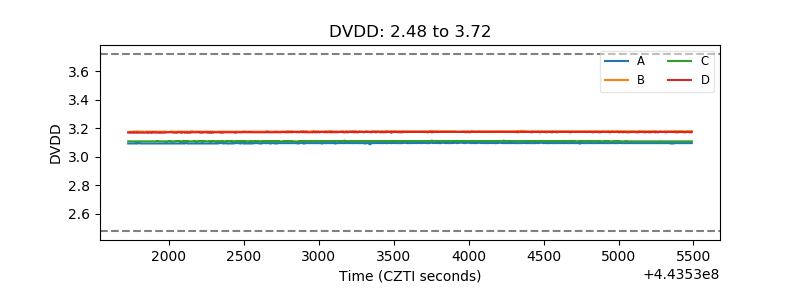 |
| Temperature 1 | 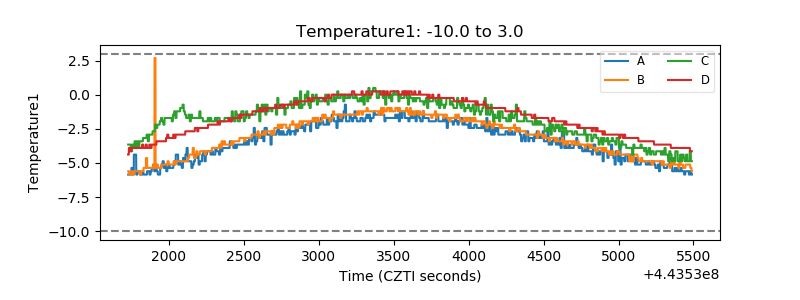 |
| Veto HV Monitor | 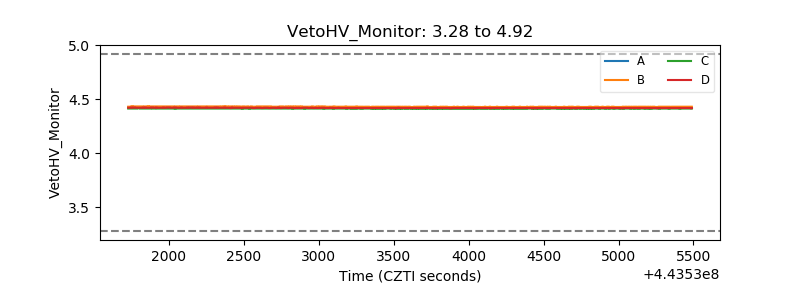 |
| Veto LLD | 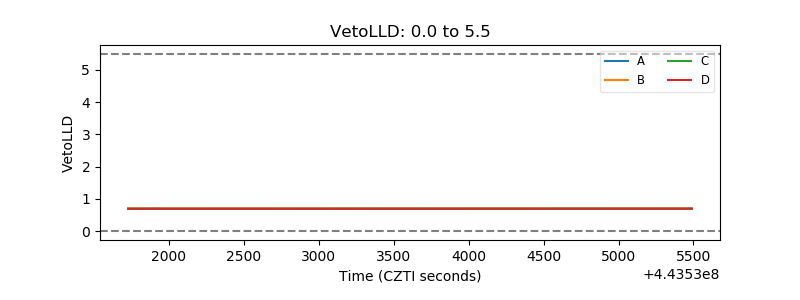 |
| Alpha Counter | 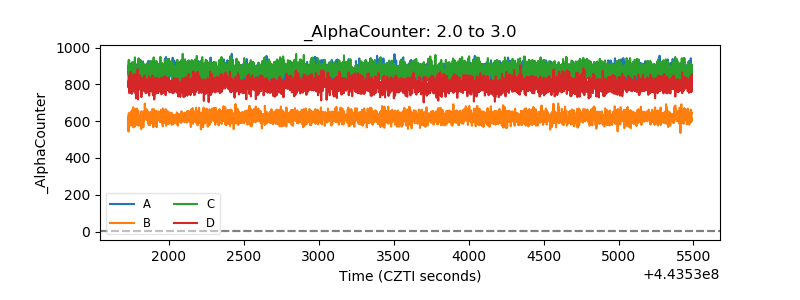 |
| _CPM_Rate | 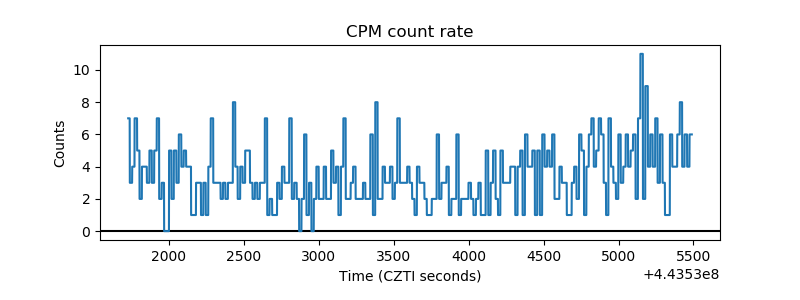 |
| CZT Counter | 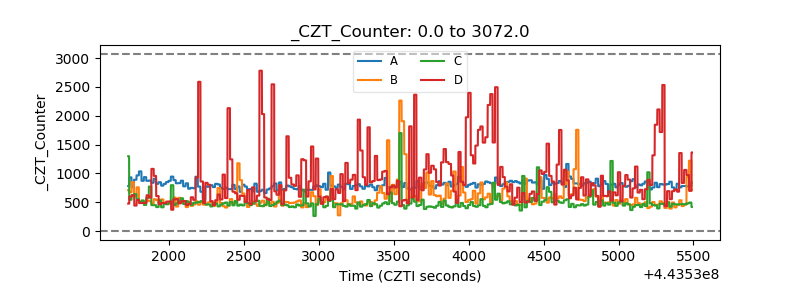 |
| +2.5 Volts monitor | 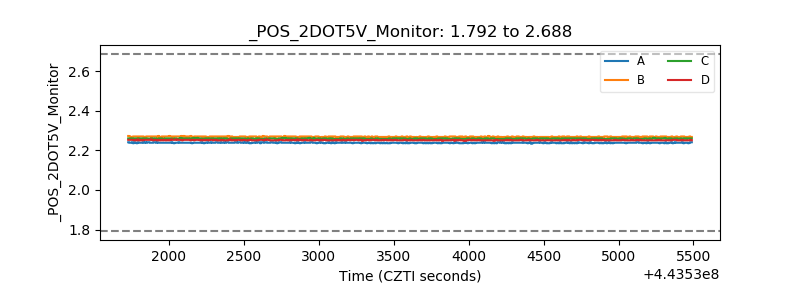 |
| +5 Volts monitor | 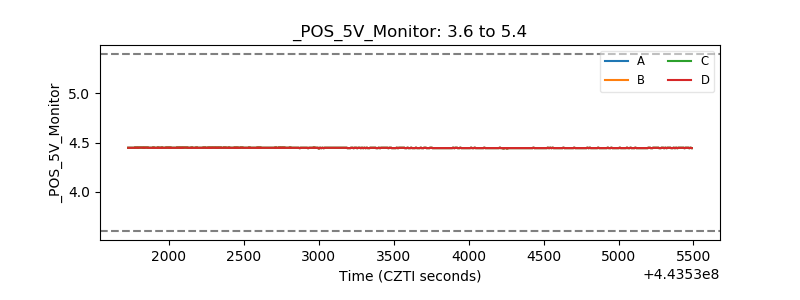 |
| _ROLL_ROT |  |
| _Roll_DEC | 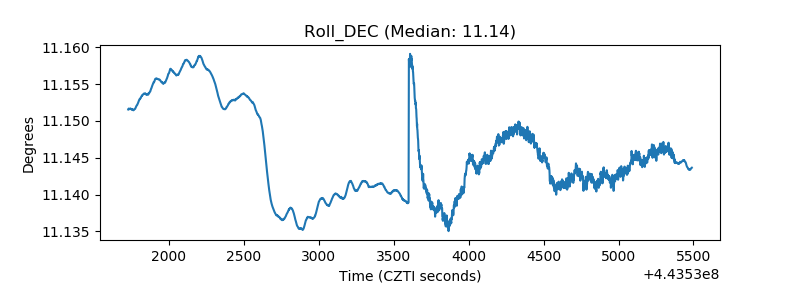 |
| _Roll_RA | 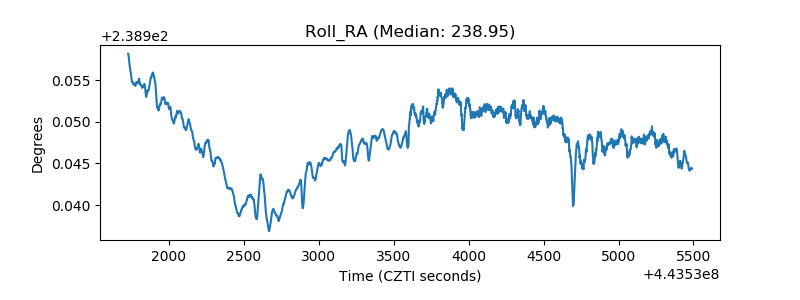 |
| Veto Counter |  |