| Param | Original file | Final file |
|---|---|---|
| Filename | modeM0/AS1A13_017T02_9000006032_47478cztM0_level2.fits | modeM0/AS1A13_017T02_9000006032_47478cztM0_level2_quad_clean.evt |
| Size (bytes) | 555,039,360 | 112,668,480 |
| Size | 529.3 MB | 107.4 MB |
| Events in quadrant A | 7,273,984 | 727,290 |
| Events in quadrant B | 3,600,503 | 772,839 |
| Events in quadrant C | 4,387,395 | 737,149 |
| Events in quadrant D | 4,736,725 | 681,689 |
| Mode SS | |||
|---|---|---|---|
| Quadrant | BADHDUFLAG | Total packets | Discarded packets |
| A | 0 | 144 | 0 |
| B | 0 | 144 | 0 |
| C | 0 | 144 | 0 |
| D | 0 | 144 | 0 |
| Mode M0 | |||
|---|---|---|---|
| Quadrant | BADHDUFLAG | Total packets | Discarded packets |
| A | 0 | 26358 | 2 |
| B | 0 | 15597 | 2 |
| C | 0 | 18009 | 2 |
| D | 0 | 19015 | 2 |
| Mode M9 | |||
|---|---|---|---|
| Quadrant | BADHDUFLAG | Total packets | Discarded packets |
| A | 0 | 10 | 0 |
| B | 0 | 11 | 0 |
| C | 0 | 11 | 0 |
| D | 0 | 11 | 0 |
| Quadrant | Total seconds | Saturated seconds | Saturation percentage |
|---|---|---|---|
| A | 7066 | 340 | 4.811775% |
| B | 7066 | 159 | 2.250212% |
| C | 7066 | 142 | 2.009624% |
| D | 7066 | 82 | 1.160487% |
Noise dominated data is calculated using 1-second bins in cleaned event files. If a bin has >2000 counts, and if more than 50% of those come from <1% of pixels, then it is considered to be noise-dominated and hence unusable.
| Quadrant | # 1 sec bins | Bins with >0 counts | Bins with >2000 counts | High rate bins dominated by noise | Noise dominated (total time) | Noise dominated (detector-on time) | Marked lightcurve |
|---|---|---|---|---|---|---|---|
| A | 7656 | 7068 | 78 | 78 | 1.02% | 1.10% | 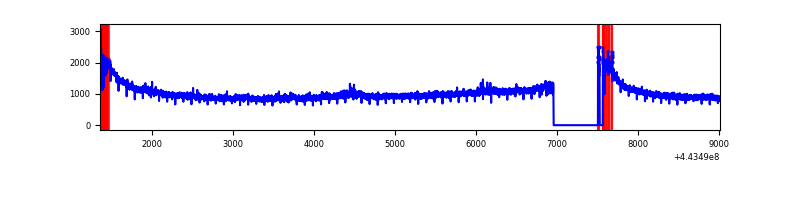 |
| B | 7656 | 7068 | 44 | 44 | 0.57% | 0.62% | 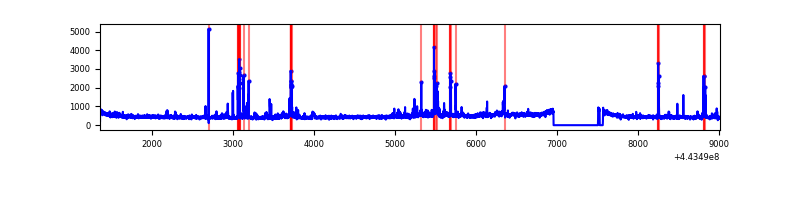 |
| C | 7656 | 7068 | 37 | 37 | 0.48% | 0.52% | 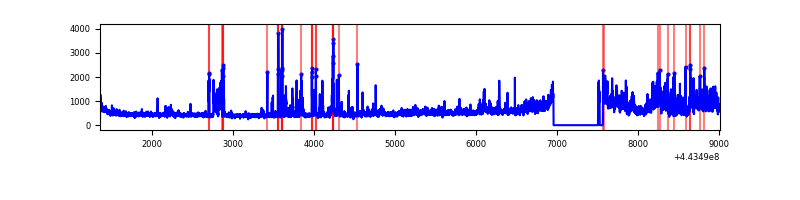 |
| D | 7656 | 7068 | 23 | 23 | 0.30% | 0.33% | 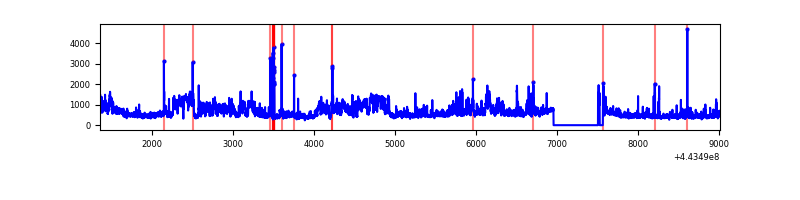 |
Top three noisy pixels from each quadrant. If the there are fewer than three noisy pixels in the level2.evt file, extra rows are filled as -1
| Pixel properties | Quadrant properties | ||||||
|---|---|---|---|---|---|---|---|
| Quadrant | DetID | PixID | Counts | Sigma | Mean | Median | Sigma |
| A | 10 | 83 | 4125917 | 25374.46 | 779 | 761 | 162.6 |
| A | 9 | 191 | 132960 | 813.18 | 779 | 761 | 162.6 |
| A | 3 | 137 | 9461 | 53.52 | 779 | 761 | 162.6 |
| B | 5 | 32 | 288436 | 1831.75 | 793 | 767 | 157.0 |
| B | 0 | 198 | 86099 | 543.36 | 793 | 767 | 157.0 |
| B | 0 | 190 | 28601 | 177.23 | 793 | 767 | 157.0 |
| C | 3 | 233 | 1301377 | 7025.9 | 779 | 779 | 185.1 |
| C | 0 | 207 | 17526 | 90.47 | 779 | 779 | 185.1 |
| C | 12 | 250 | 13168 | 66.93 | 779 | 779 | 185.1 |
| D | 11 | 192 | 1403012 | 7033.73 | 776 | 749 | 199.4 |
| D | 2 | 249 | 95021 | 472.87 | 776 | 749 | 199.4 |
| D | 2 | 165 | 93027 | 462.86 | 776 | 749 | 199.4 |
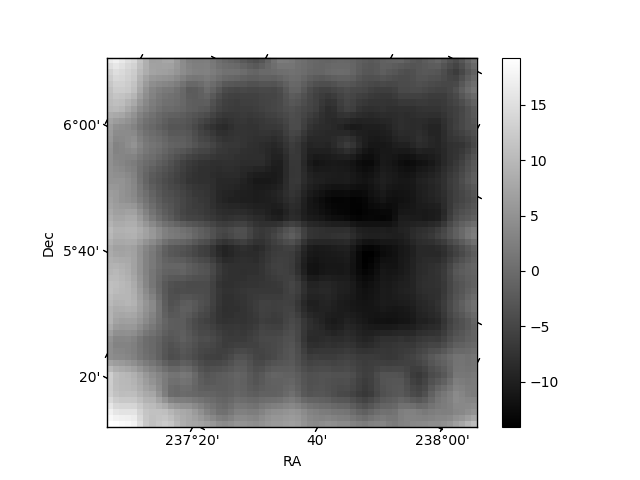
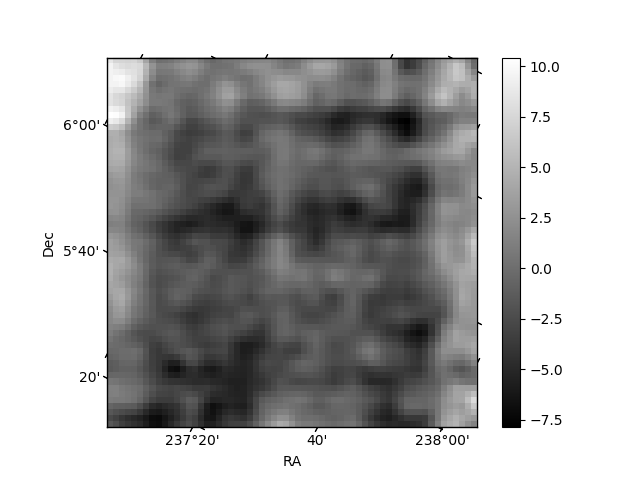
Histogram calculated using DETX and DETY for each event in the final _common_clean file
| Quadrant A | 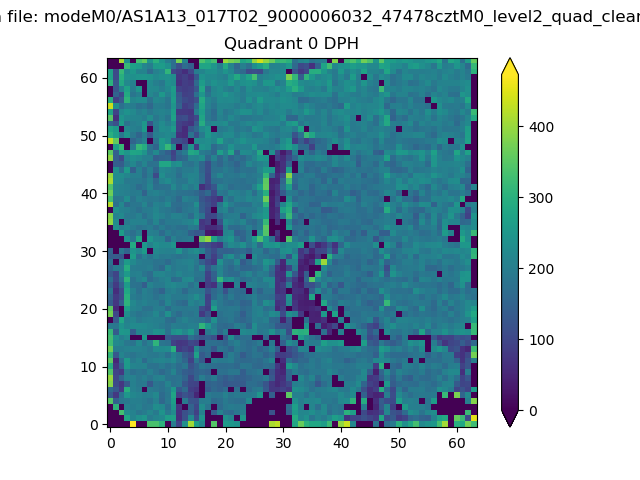 |
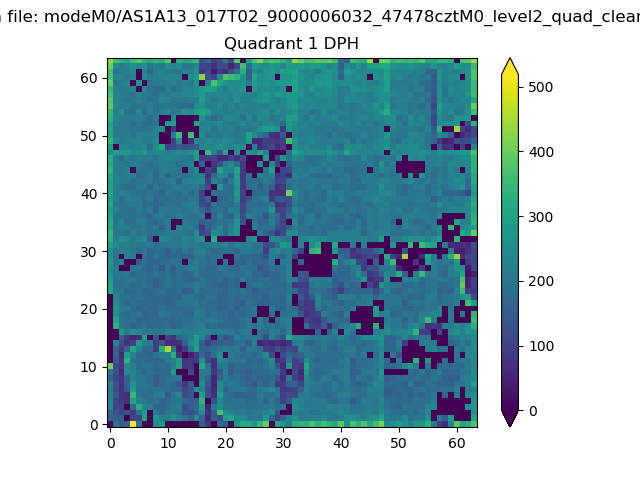 |
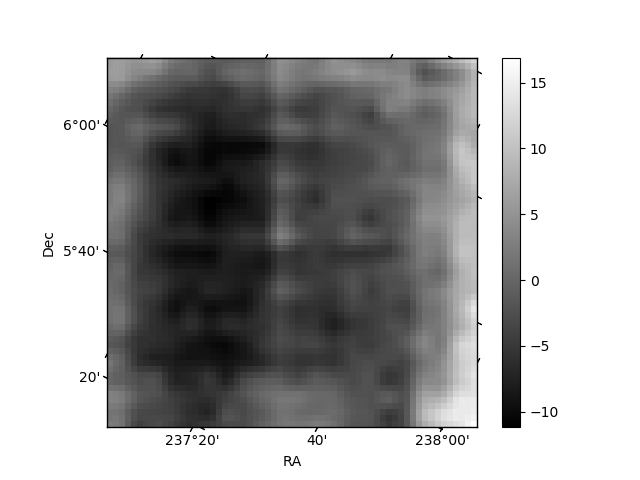
Quadrant B |
|---|---|---|---|
| Quadrant D | 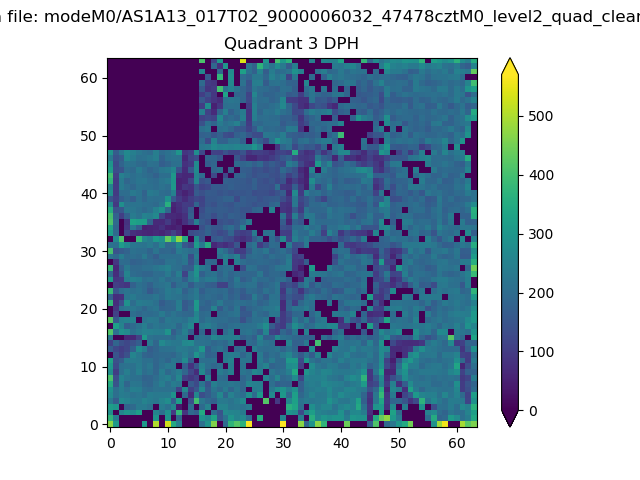 |
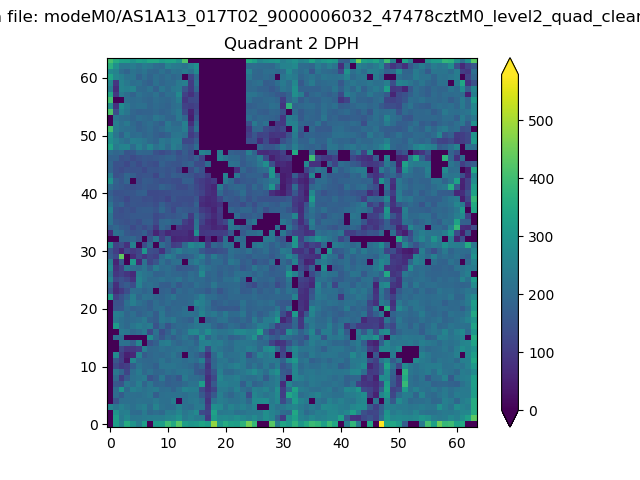 |
Quadrant C |
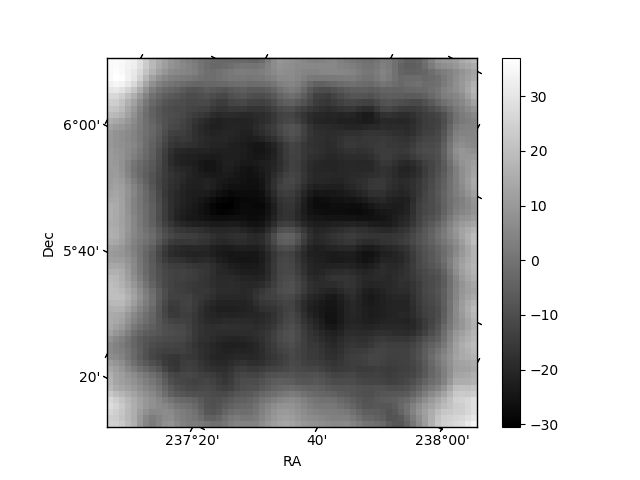
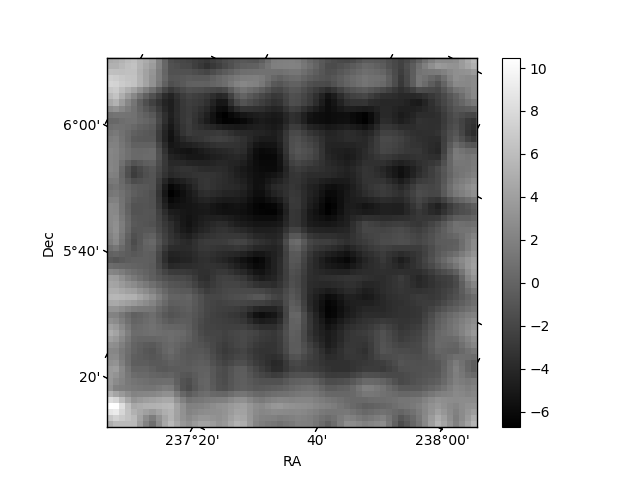
| Plot type | Count rate plots | Images |
|---|---|---|
| Comparison with Poisson distribution Blue bars denote a histogram of data divided into 1 sec bins. Red curve is a Poisson curve with rate = median count rate of data. |
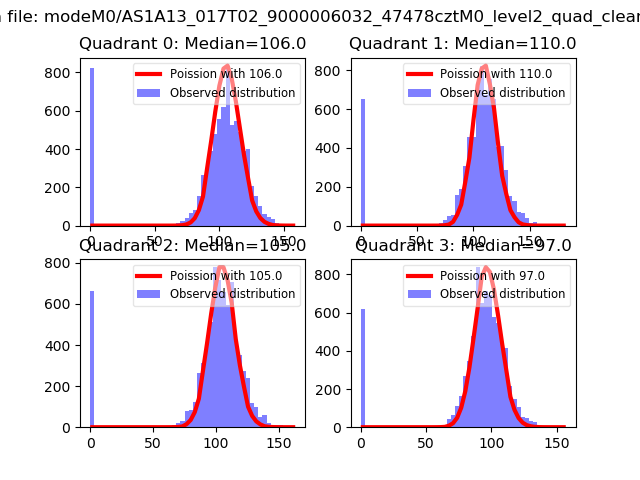 |
 |
| Quadrant-wise count rates Data is divided into 100 sec bins |
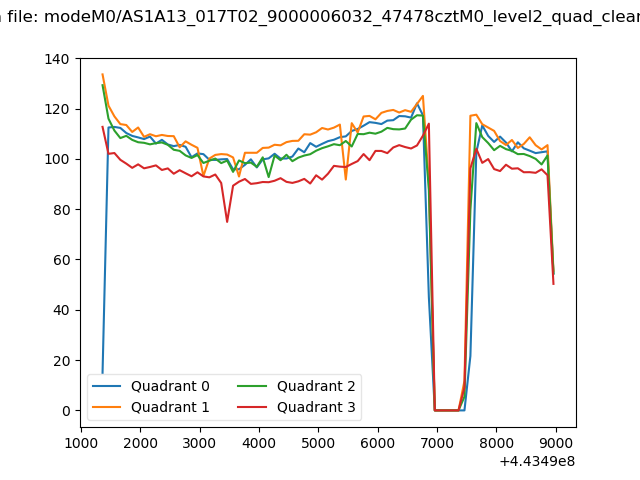 |
|
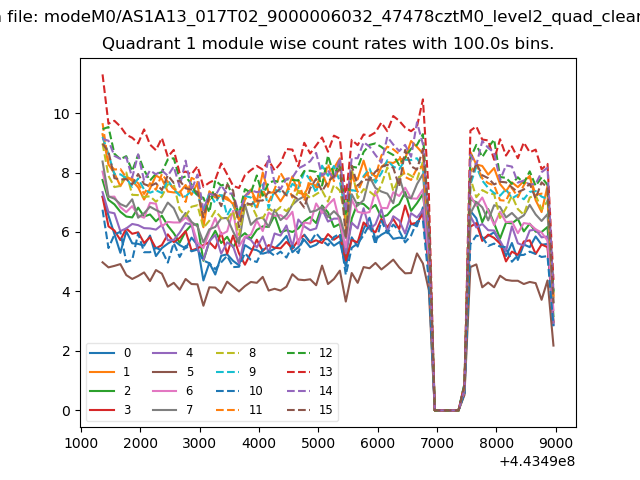
| Module-wise count rates for Quadrant A Data is divided into 100 sec bins |
 |
 |
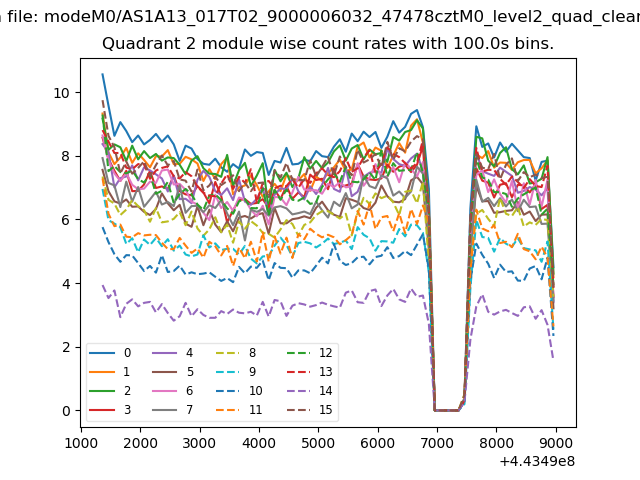
| Module-wise count rates for Quadrant B Data is divided into 100 sec bins |
 |
 |
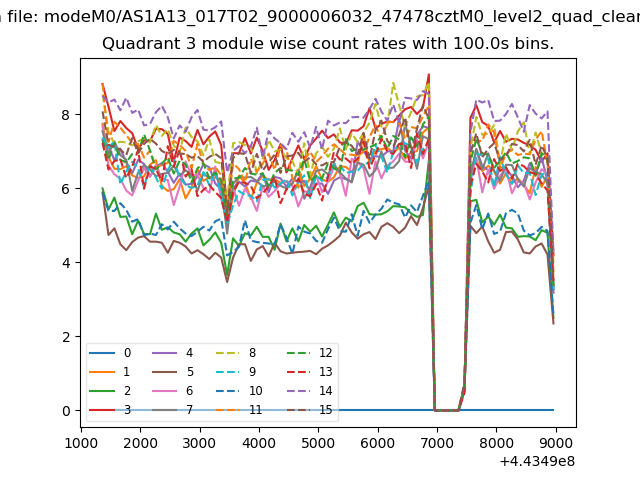
| Module-wise count rates for Quadrant C Data is divided into 100 sec bins |
 |
 |
| Module-wise count rates for Quadrant D Data is divided into 100 sec bins |
 |
 |
| Parameter | Plot |
|---|---|
| CZT HV Monitor |  |
| D_VDD | 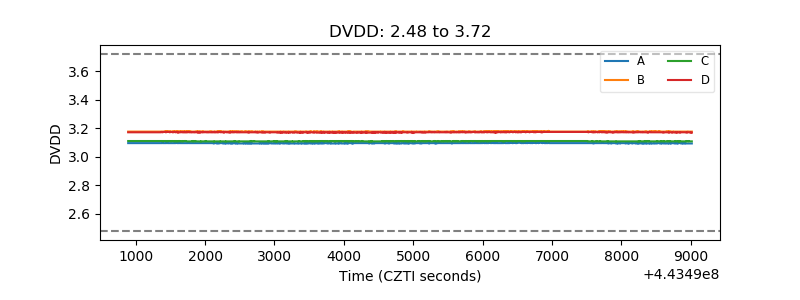 |
| Temperature 1 | 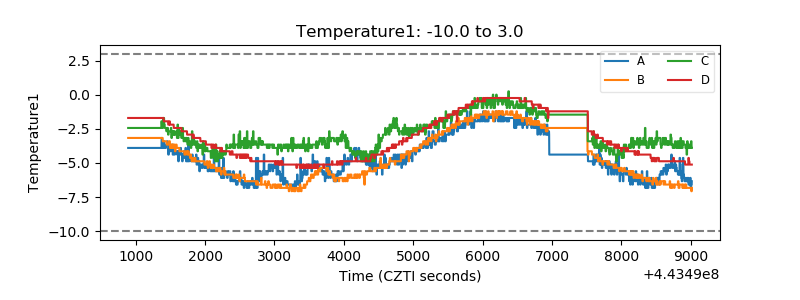 |
| Veto HV Monitor | 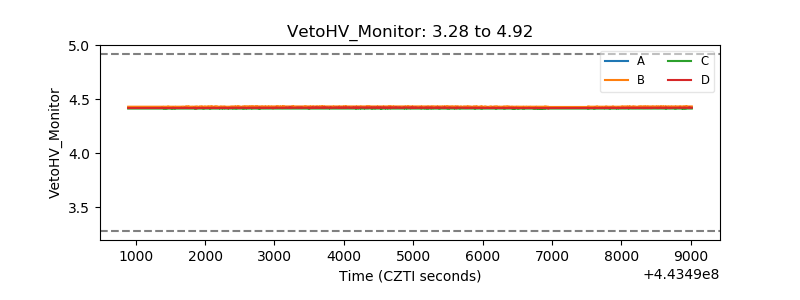 |
| Veto LLD | 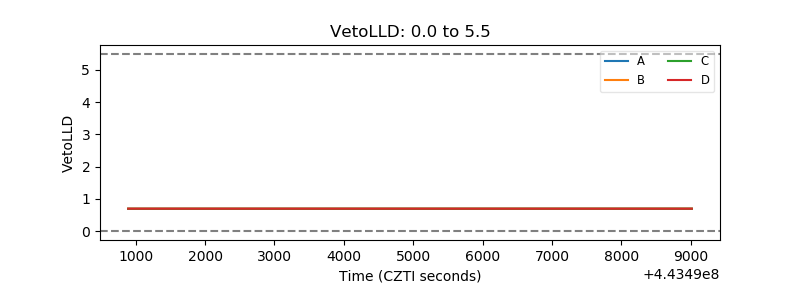 |
| Alpha Counter | 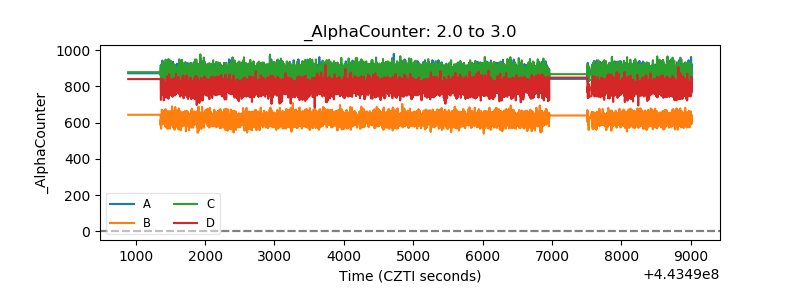 |
| _CPM_Rate | 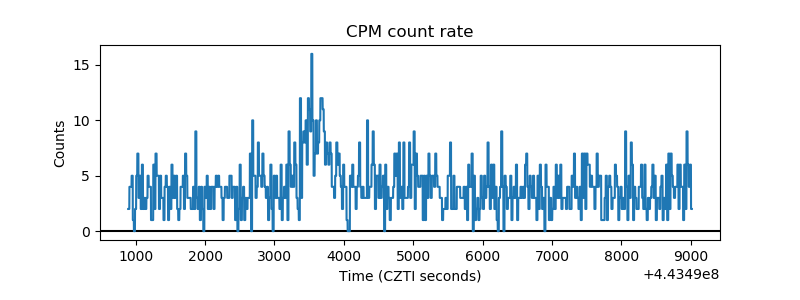 |
| CZT Counter |  |
| +2.5 Volts monitor | 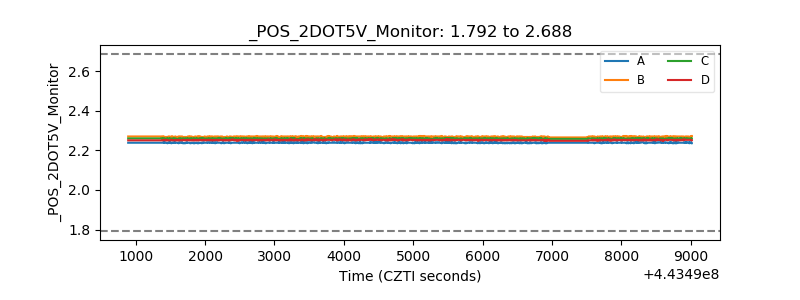 |
| +5 Volts monitor | 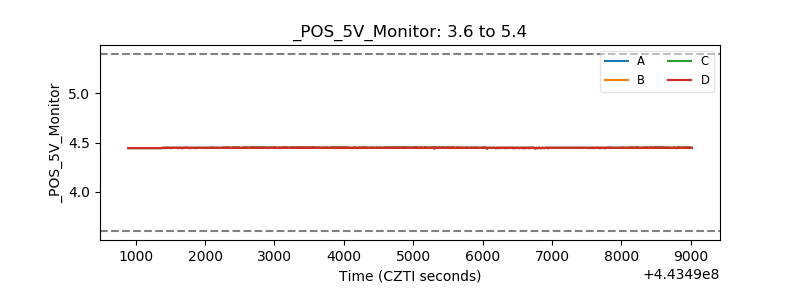 |
| _ROLL_ROT | 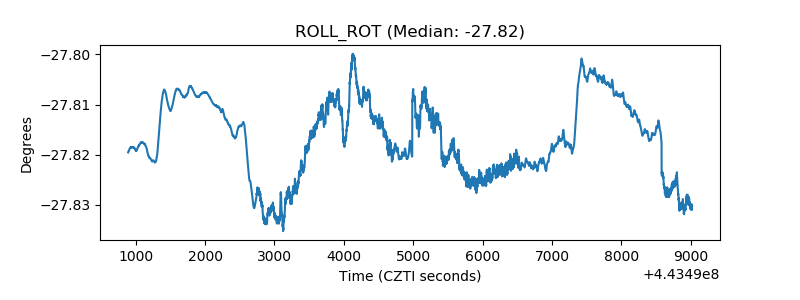 |
| _Roll_DEC | 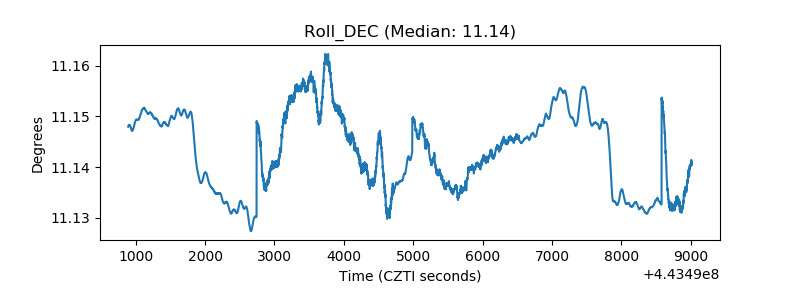 |
| _Roll_RA | 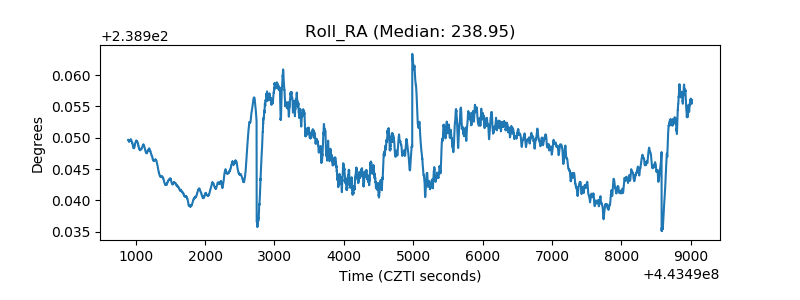 |
| Veto Counter | 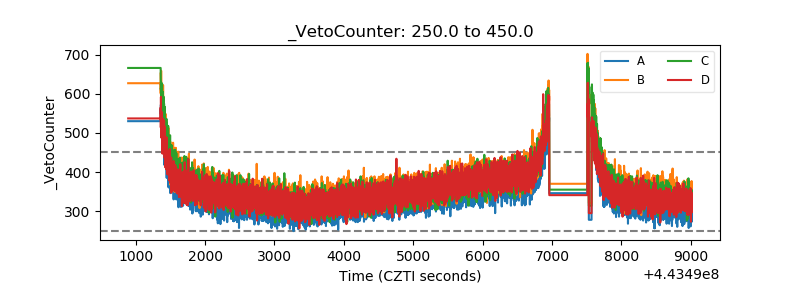 |