| Param | Original file | Final file |
|---|---|---|
| Filename | modeM0/AS1A13_042T03_9000006030_44875cztM0_level2.fits | modeM0/AS1A13_042T03_9000006030_44875cztM0_level2_quad_clean.evt |
| Size (bytes) | 444,715,200 | 107,271,360 |
| Size | 424.1 MB | 102.3 MB |
| Events in quadrant A | 5,205,077 | 712,408 |
| Events in quadrant B | 3,669,050 | 724,015 |
| Events in quadrant C | 3,051,050 | 707,156 |
| Events in quadrant D | 4,019,573 | 640,087 |
| Mode M9 | |||
|---|---|---|---|
| Quadrant | BADHDUFLAG | Total packets | Discarded packets |
| A | 0 | 9 | 0 |
| B | 0 | 9 | 0 |
| C | 0 | 9 | 0 |
| D | 0 | 9 | 0 |
| Mode SS | |||
|---|---|---|---|
| Quadrant | BADHDUFLAG | Total packets | Discarded packets |
| A | 0 | 136 | 0 |
| B | 0 | 136 | 0 |
| C | 0 | 136 | 0 |
| D | 0 | 136 | 0 |
| Mode M0 | |||
|---|---|---|---|
| Quadrant | BADHDUFLAG | Total packets | Discarded packets |
| A | 0 | 20893 | 2 |
| B | 0 | 15314 | 2 |
| C | 0 | 13777 | 2 |
| D | 0 | 16468 | 2 |
| Quadrant | Total seconds | Saturated seconds | Saturation percentage |
|---|---|---|---|
| A | 6656 | 155 | 2.328726% |
| B | 6656 | 220 | 3.305288% |
| C | 6656 | 49 | 0.736178% |
| D | 6657 | 180 | 2.703921% |
Noise dominated data is calculated using 1-second bins in cleaned event files. If a bin has >2000 counts, and if more than 50% of those come from <1% of pixels, then it is considered to be noise-dominated and hence unusable.
| Quadrant | # 1 sec bins | Bins with >0 counts | Bins with >2000 counts | High rate bins dominated by noise | Noise dominated (total time) | Noise dominated (detector-on time) | Marked lightcurve |
|---|---|---|---|---|---|---|---|
| A | 7586 | 6657 | 19 | 19 | 0.25% | 0.29% | 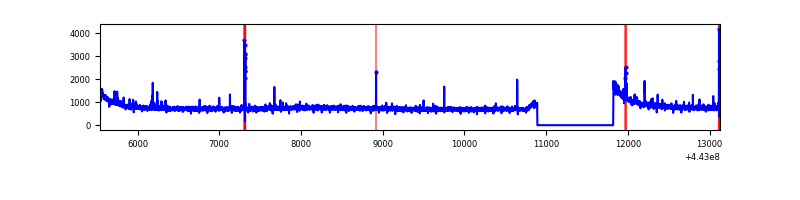 |
| B | 7586 | 6657 | 114 | 114 | 1.50% | 1.71% | 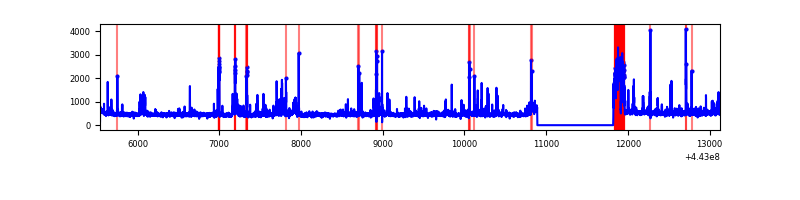 |
| C | 7586 | 6657 | 6 | 6 | 0.08% | 0.09% | 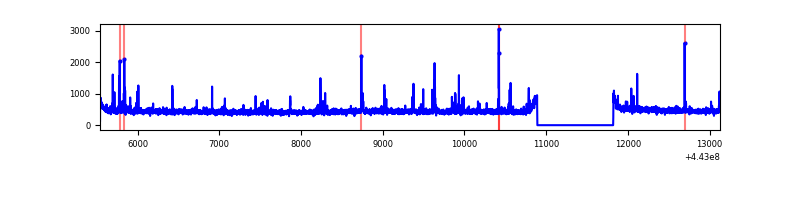 |
| D | 7587 | 6658 | 94 | 94 | 1.24% | 1.41% | 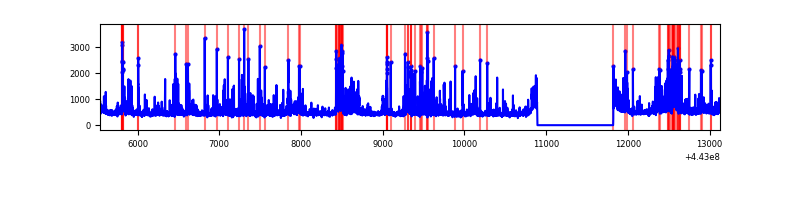 |
Top three noisy pixels from each quadrant. If the there are fewer than three noisy pixels in the level2.evt file, extra rows are filled as -1
| Pixel properties | Quadrant properties | ||||||
|---|---|---|---|---|---|---|---|
| Quadrant | DetID | PixID | Counts | Sigma | Mean | Median | Sigma |
| A | 10 | 83 | 2154476 | 13625.83 | 757 | 739 | 158.1 |
| A | 7 | 3 | 53338 | 332.77 | 757 | 739 | 158.1 |
| A | 13 | 248 | 51564 | 321.55 | 757 | 739 | 158.1 |
| B | 3 | 112 | 239439 | 1597.41 | 745 | 720 | 149.4 |
| B | 5 | 255 | 157614 | 1049.87 | 745 | 720 | 149.4 |
| B | 0 | 190 | 106846 | 710.15 | 745 | 720 | 149.4 |
| C | 2 | 14 | 46389 | 258.75 | 744 | 747 | 176.4 |
| C | 1 | 3 | 38430 | 213.63 | 744 | 747 | 176.4 |
| C | 12 | 250 | 28287 | 156.13 | 744 | 747 | 176.4 |
| D | 2 | 249 | 308818 | 1639.19 | 742 | 720 | 188.0 |
| D | 1 | 52 | 282055 | 1496.8 | 742 | 720 | 188.0 |
| D | 13 | 249 | 253180 | 1343.17 | 742 | 720 | 188.0 |
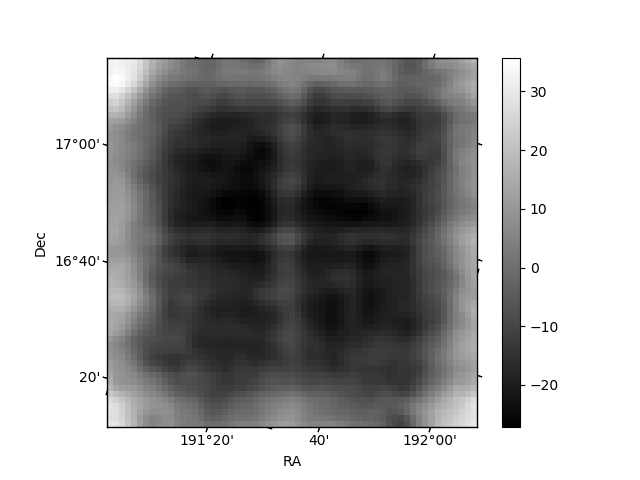
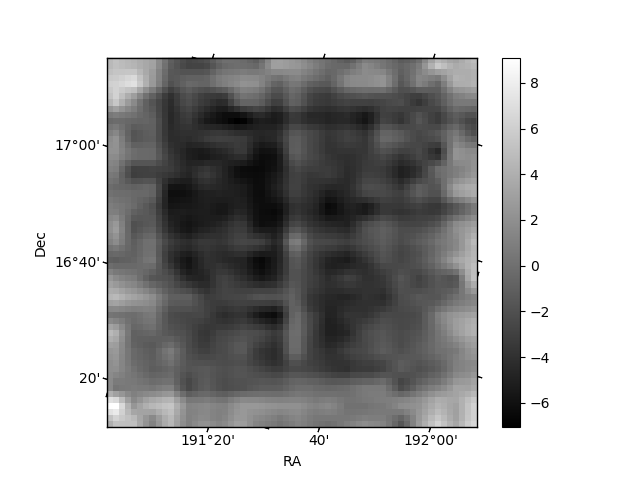
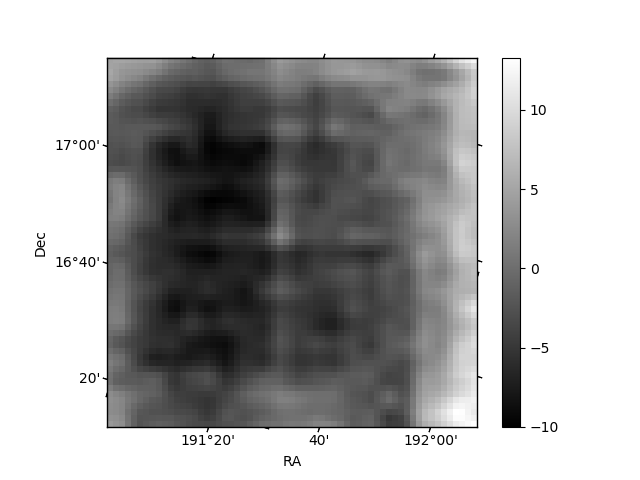
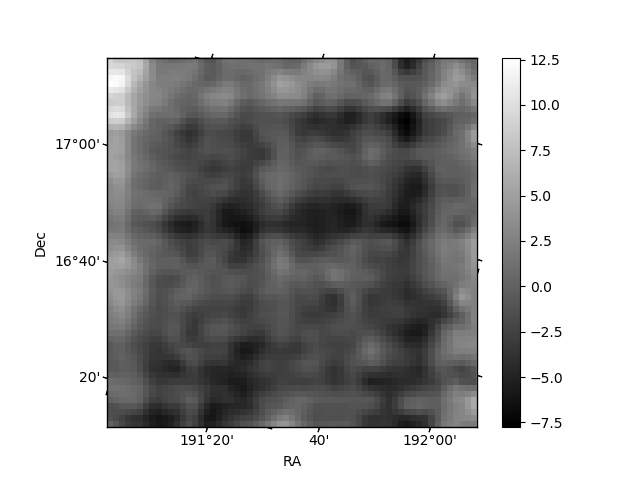
Histogram calculated using DETX and DETY for each event in the final _common_clean file
| Quadrant A | 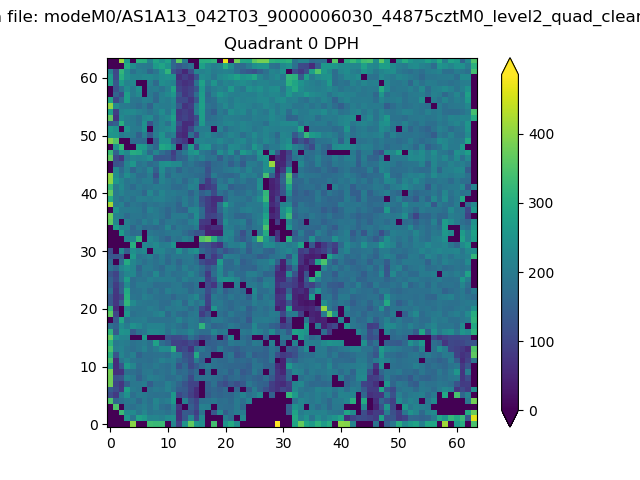 |
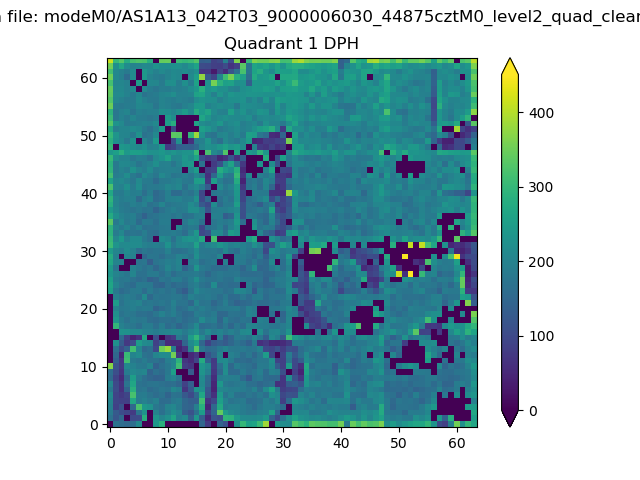 |
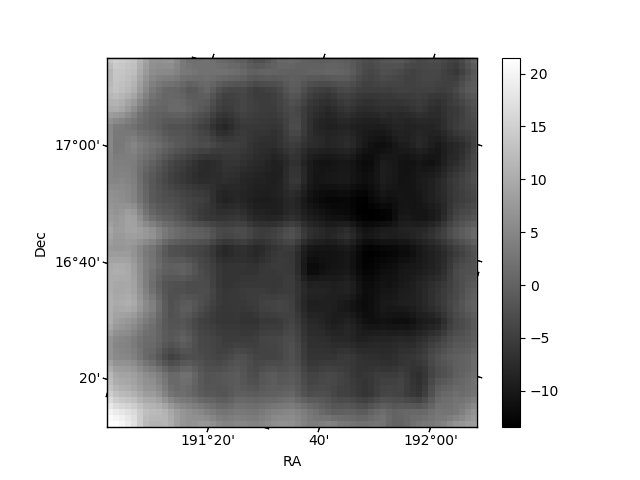
Quadrant B |
|---|---|---|---|
| Quadrant D | 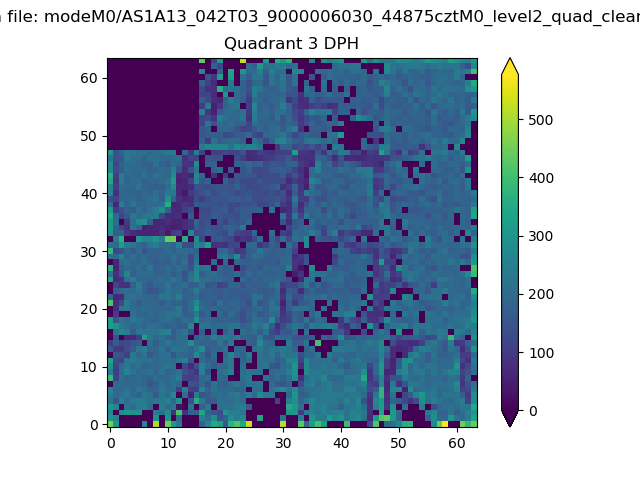 |
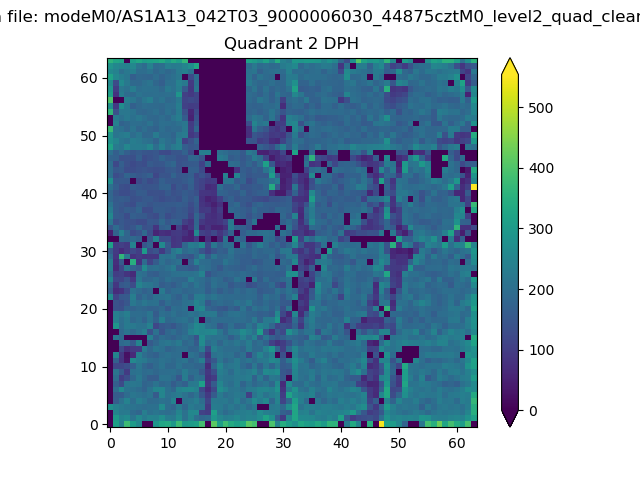 |
Quadrant C |
| Plot type | Count rate plots | Images |
|---|---|---|
| Comparison with Poisson distribution Blue bars denote a histogram of data divided into 1 sec bins. Red curve is a Poisson curve with rate = median count rate of data. |
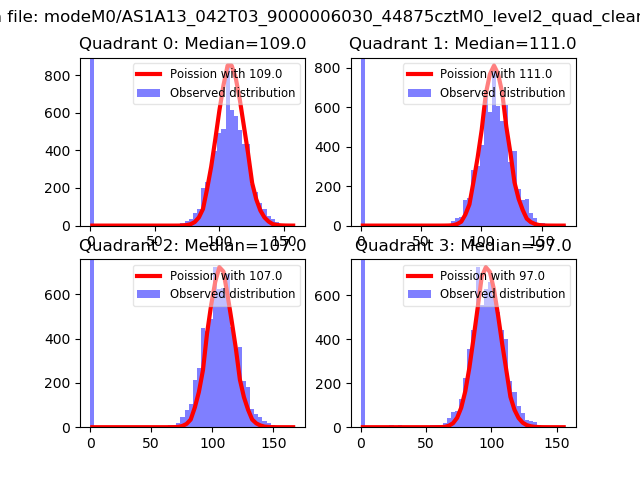 |
 |
| Quadrant-wise count rates Data is divided into 100 sec bins |
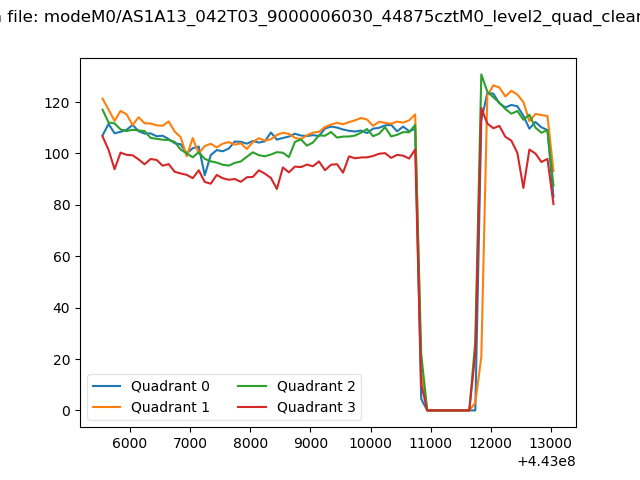 |
|
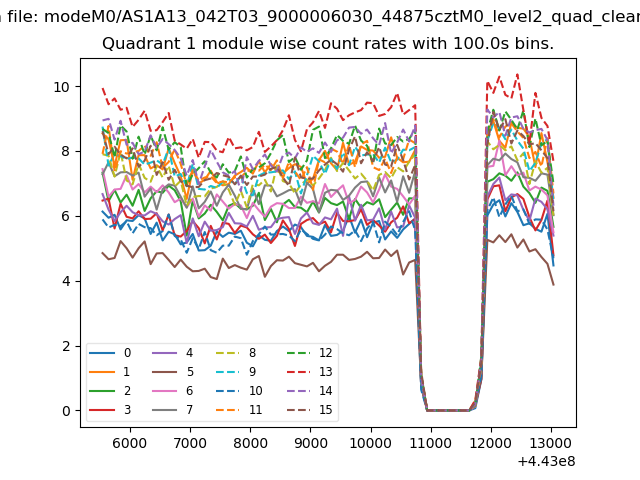
| Module-wise count rates for Quadrant A Data is divided into 100 sec bins |
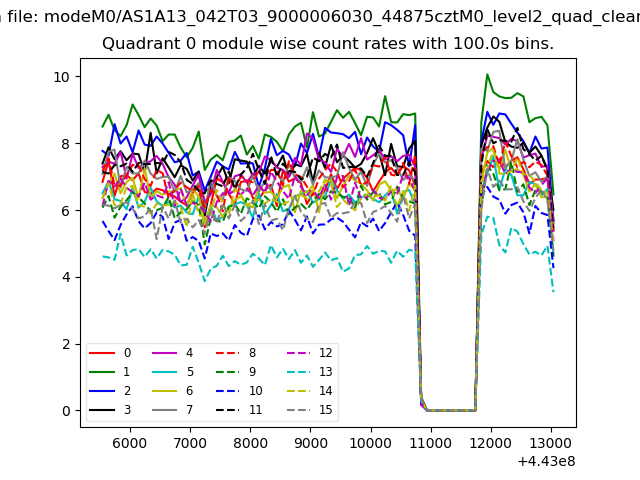 |
 |
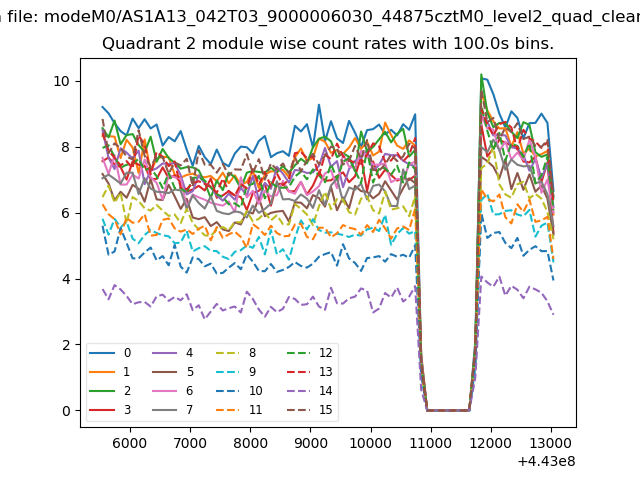
| Module-wise count rates for Quadrant B Data is divided into 100 sec bins |
 |
 |
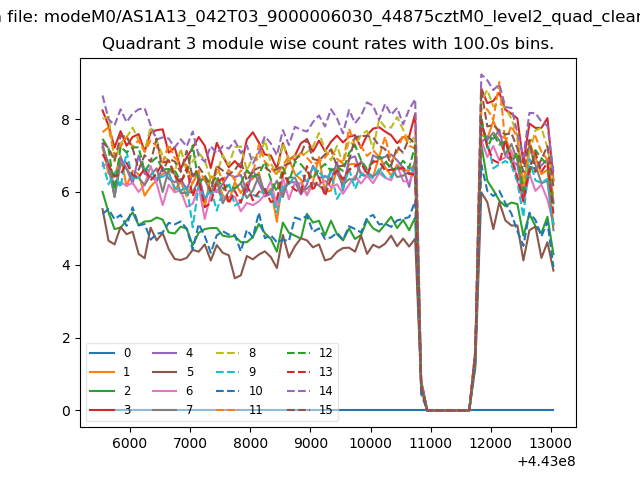
| Module-wise count rates for Quadrant C Data is divided into 100 sec bins |
 |
 |
| Module-wise count rates for Quadrant D Data is divided into 100 sec bins |
 |
 |
| Parameter | Plot |
|---|---|
| CZT HV Monitor | 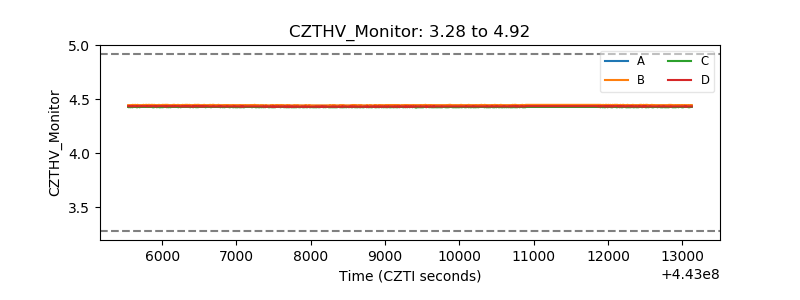 |
| D_VDD | 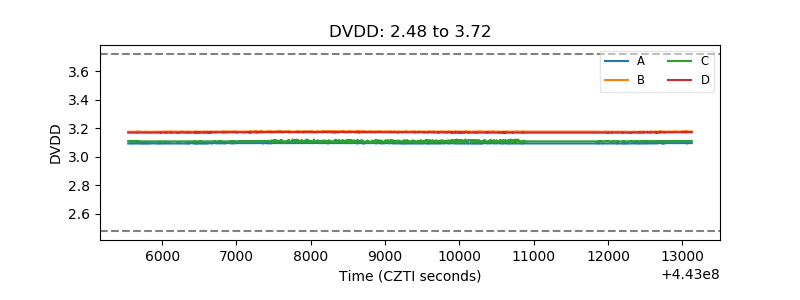 |
| Temperature 1 | 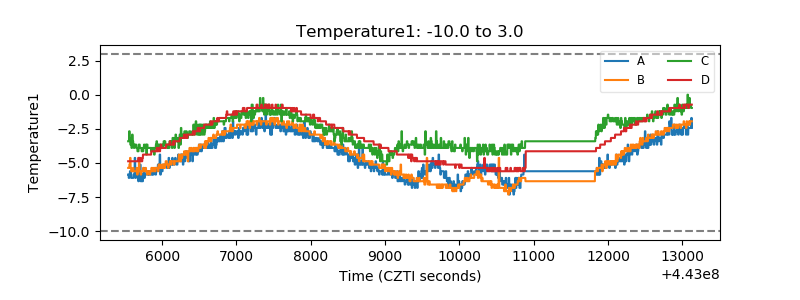 |
| Veto HV Monitor | 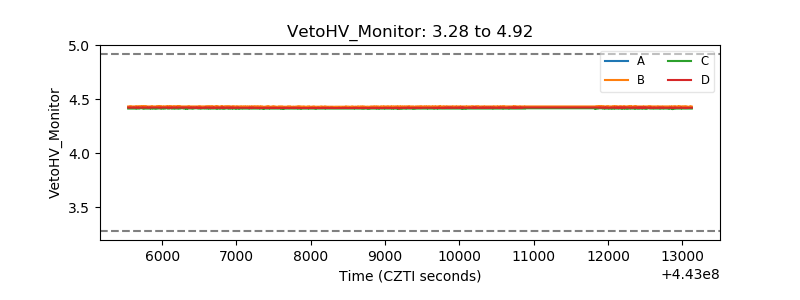 |
| Veto LLD | 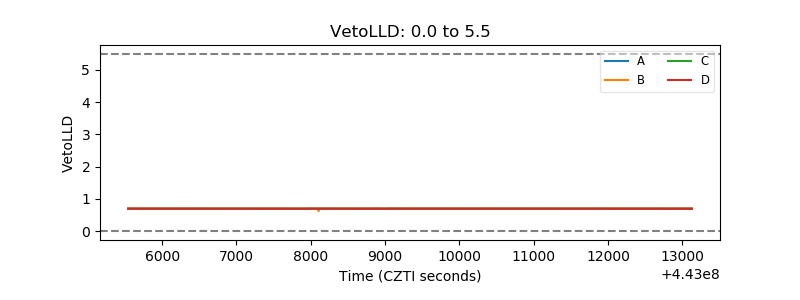 |
| Alpha Counter | 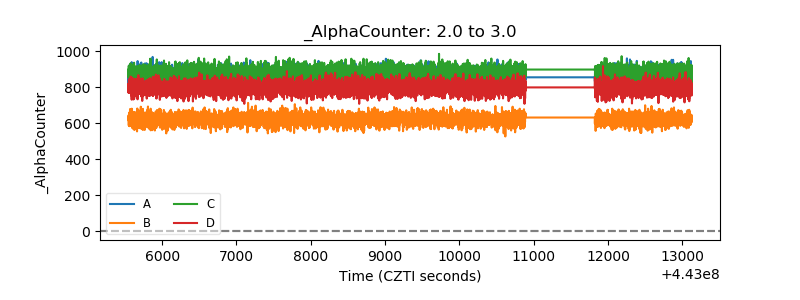 |
| _CPM_Rate | 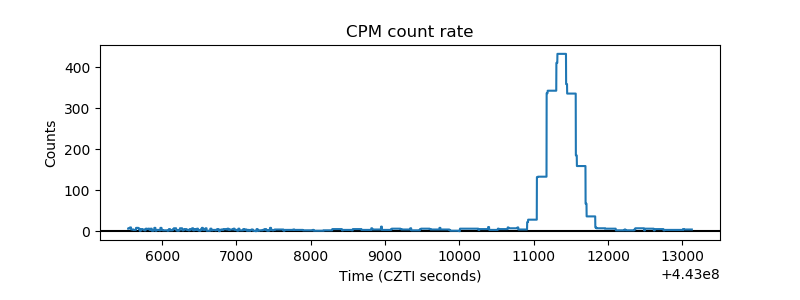 |
| CZT Counter | 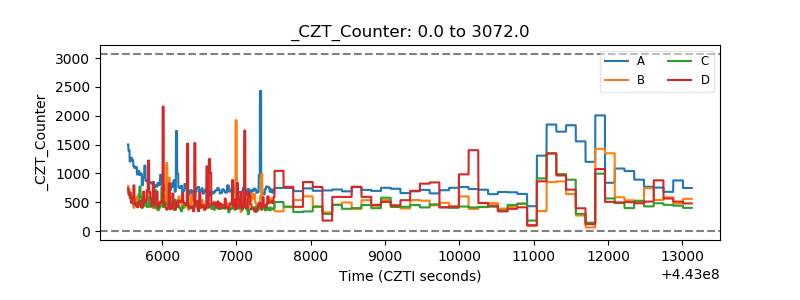 |
| +2.5 Volts monitor | 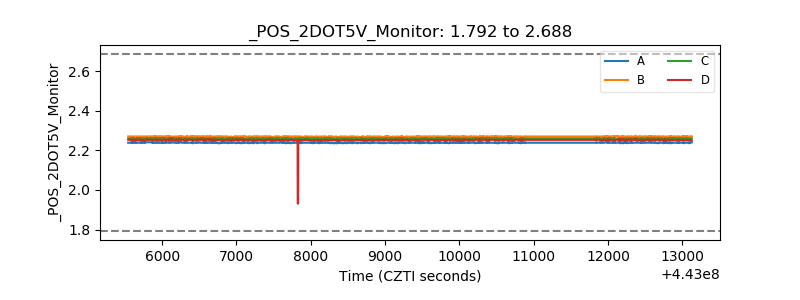 |
| +5 Volts monitor | 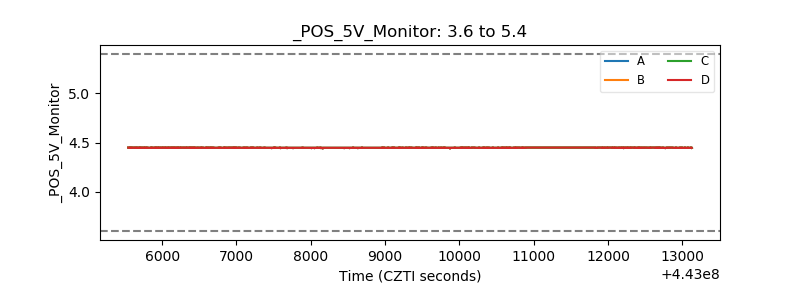 |
| _ROLL_ROT | 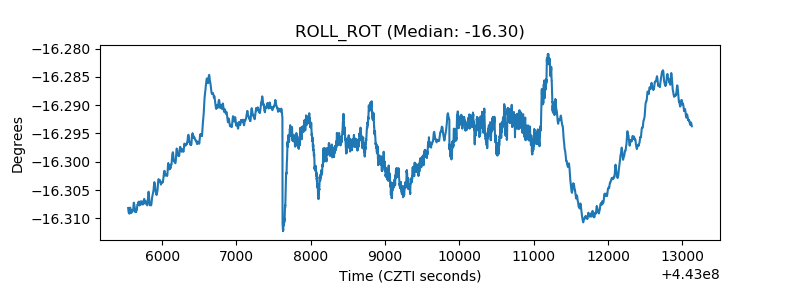 |
| _Roll_DEC | 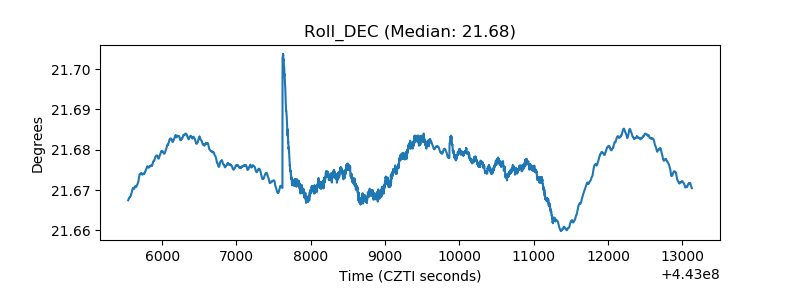 |
| _Roll_RA | 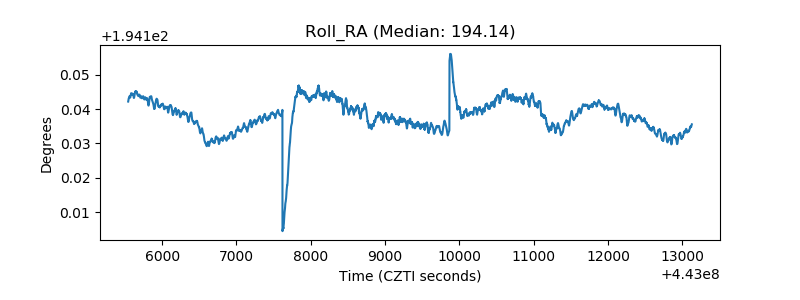 |
| Veto Counter | 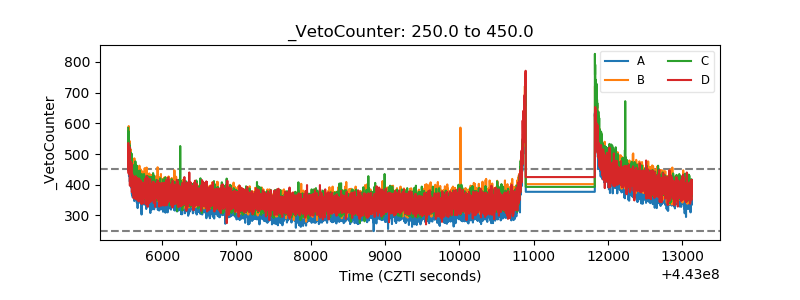 |