| Param | Original file | Final file |
|---|---|---|
| Filename | modeM0/AS1A13_042T03_9000006030_44878cztM0_level2.fits | modeM0/AS1A13_042T03_9000006030_44878cztM0_level2_quad_clean.evt |
| Size (bytes) | 517,190,400 | 117,455,040 |
| Size | 493.2 MB | 112.0 MB |
| Events in quadrant A | 5,580,059 | 793,195 |
| Events in quadrant B | 3,658,756 | 826,949 |
| Events in quadrant C | 3,376,124 | 792,716 |
| Events in quadrant D | 6,011,570 | 677,988 |
| Mode M9 | |||
|---|---|---|---|
| Quadrant | BADHDUFLAG | Total packets | Discarded packets |
| A | 0 | 15 | 0 |
| B | 0 | 16 | 0 |
| C | 0 | 16 | 0 |
| D | 0 | 16 | 0 |
| Mode SS | |||
|---|---|---|---|
| Quadrant | BADHDUFLAG | Total packets | Discarded packets |
| A | 0 | 136 | 0 |
| B | 0 | 136 | 0 |
| C | 0 | 136 | 0 |
| D | 0 | 136 | 0 |
| Mode M0 | |||
|---|---|---|---|
| Quadrant | BADHDUFLAG | Total packets | Discarded packets |
| A | 0 | 21618 | 2 |
| B | 0 | 15257 | 2 |
| C | 0 | 14474 | 2 |
| D | 0 | 22462 | 2 |
| Quadrant | Total seconds | Saturated seconds | Saturation percentage |
|---|---|---|---|
| A | 6680 | 232 | 3.473054% |
| B | 6680 | 138 | 2.065868% |
| C | 6680 | 90 | 1.347305% |
| D | 6680 | 687 | 10.284431% |
Noise dominated data is calculated using 1-second bins in cleaned event files. If a bin has >2000 counts, and if more than 50% of those come from <1% of pixels, then it is considered to be noise-dominated and hence unusable.
| Quadrant | # 1 sec bins | Bins with >0 counts | Bins with >2000 counts | High rate bins dominated by noise | Noise dominated (total time) | Noise dominated (detector-on time) | Marked lightcurve |
|---|---|---|---|---|---|---|---|
| A | 7840 | 6681 | 12 | 12 | 0.15% | 0.18% | 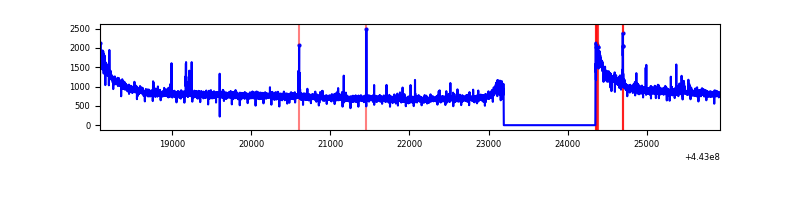 |
| B | 7840 | 6681 | 21 | 21 | 0.27% | 0.31% | 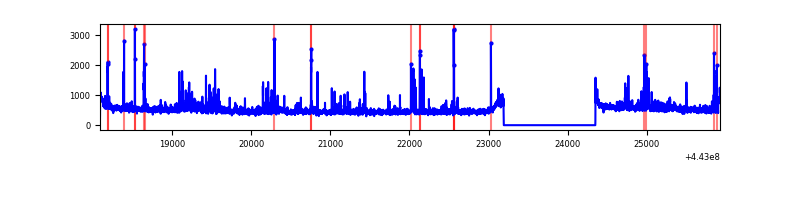 |
| C | 7840 | 6681 | 13 | 13 | 0.17% | 0.19% | 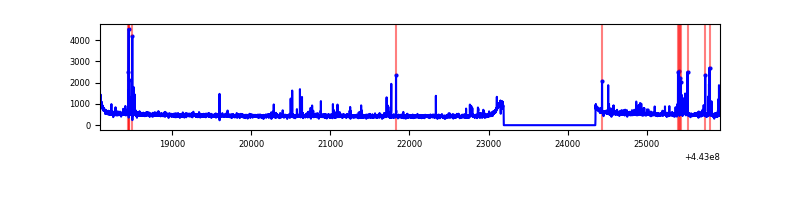 |
| D | 7840 | 6681 | 435 | 435 | 5.55% | 6.51% | 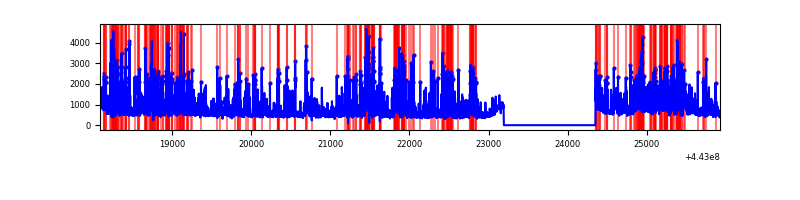 |
Top three noisy pixels from each quadrant. If the there are fewer than three noisy pixels in the level2.evt file, extra rows are filled as -1
| Pixel properties | Quadrant properties | ||||||
|---|---|---|---|---|---|---|---|
| Quadrant | DetID | PixID | Counts | Sigma | Mean | Median | Sigma |
| A | 10 | 83 | 2341100 | 13763.54 | 821 | 804 | 170.0 |
| A | 7 | 3 | 30485 | 174.56 | 821 | 804 | 170.0 |
| A | 2 | 79 | 11483 | 62.8 | 821 | 804 | 170.0 |
| B | 5 | 255 | 225092 | 1401.46 | 818 | 794 | 160.0 |
| B | 0 | 155 | 53215 | 327.54 | 818 | 794 | 160.0 |
| B | 0 | 186 | 39636 | 242.69 | 818 | 794 | 160.0 |
| C | 1 | 3 | 122965 | 646.5 | 811 | 819 | 188.9 |
| C | 5 | 4 | 58308 | 304.28 | 811 | 819 | 188.9 |
| C | 14 | 254 | 9732 | 47.18 | 811 | 819 | 188.9 |
| D | 1 | 52 | 1385688 | 7043.69 | 786 | 764 | 196.6 |
| D | 13 | 249 | 687116 | 3490.77 | 786 | 764 | 196.6 |
| D | 5 | 171 | 462267 | 2347.19 | 786 | 764 | 196.6 |
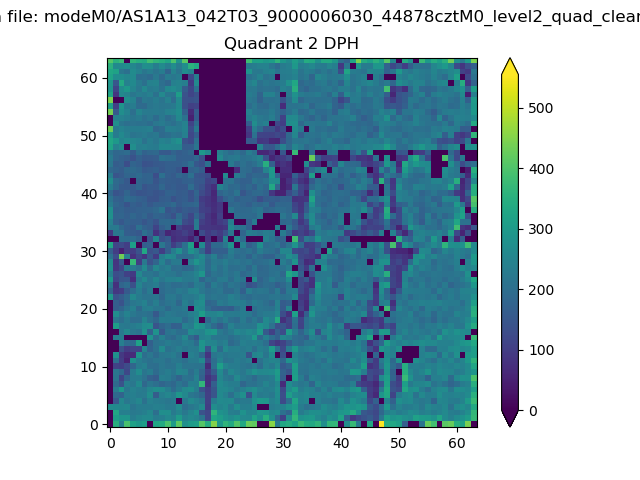
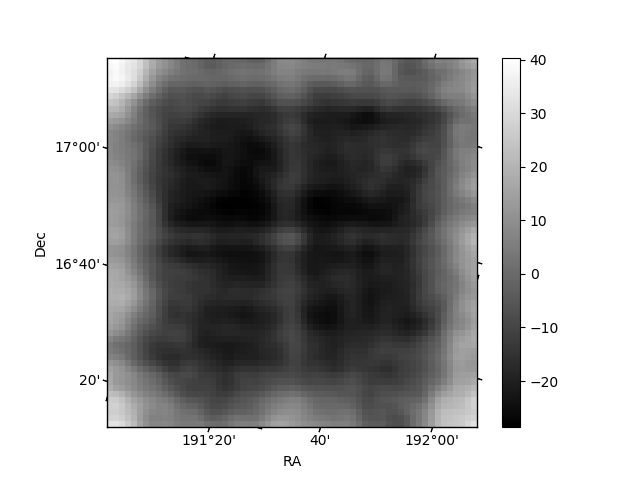
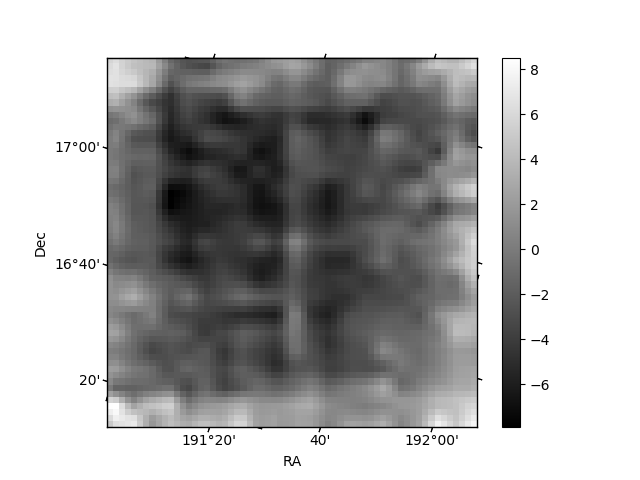
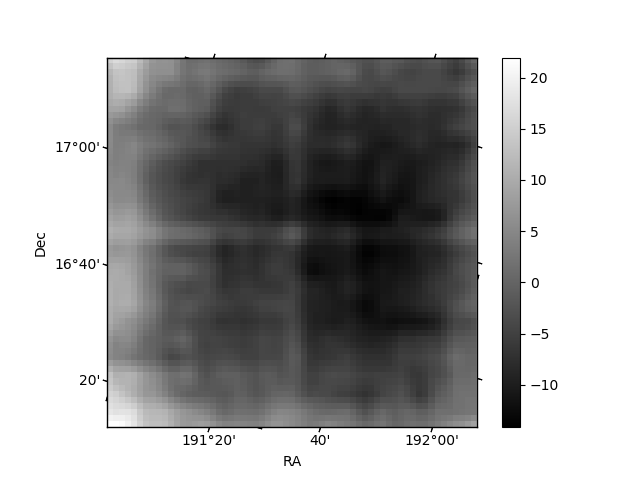
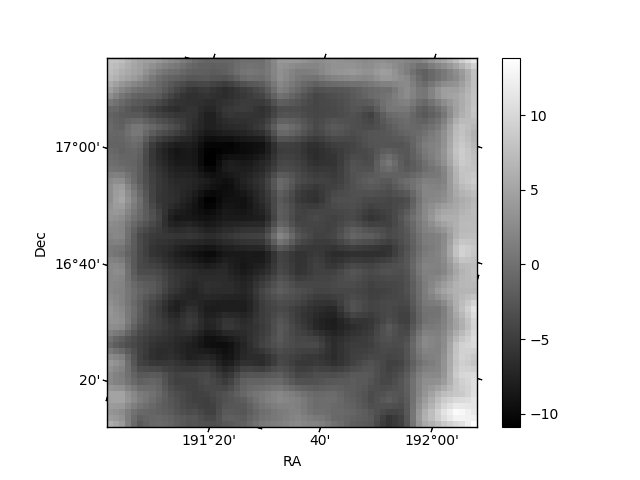
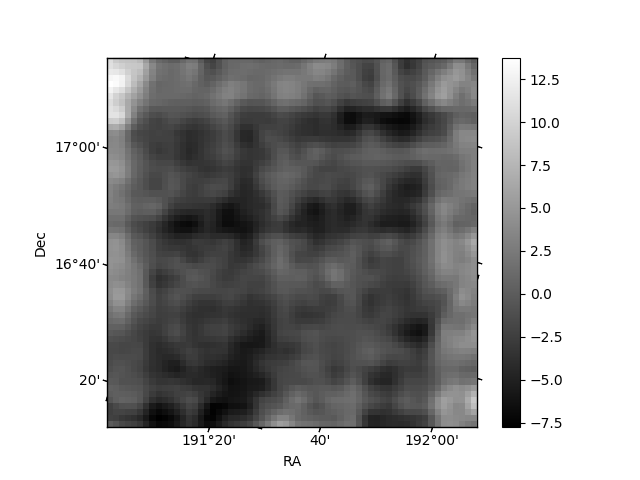
Histogram calculated using DETX and DETY for each event in the final _common_clean file
| Quadrant A | 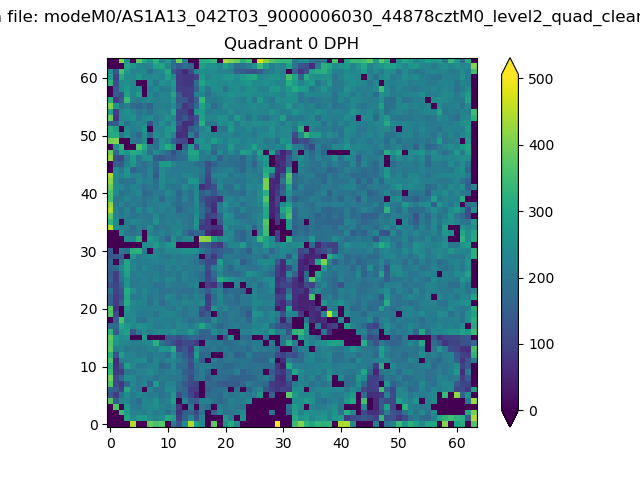 |
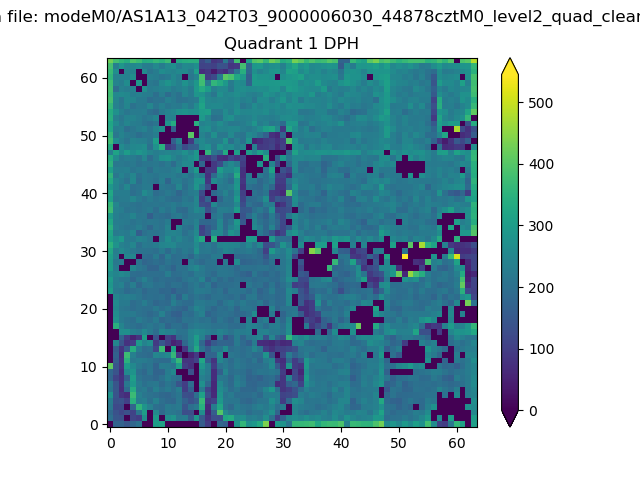 |
Quadrant B |
|---|---|---|---|
| Quadrant D | 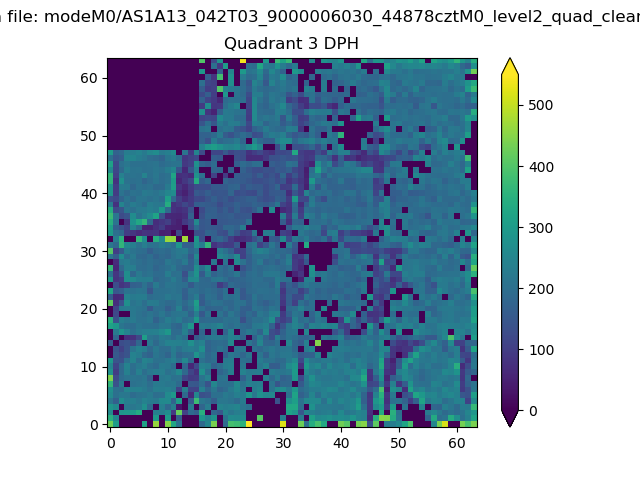 |
 |
Quadrant C |
| Plot type | Count rate plots | Images |
|---|---|---|
| Comparison with Poisson distribution Blue bars denote a histogram of data divided into 1 sec bins. Red curve is a Poisson curve with rate = median count rate of data. |
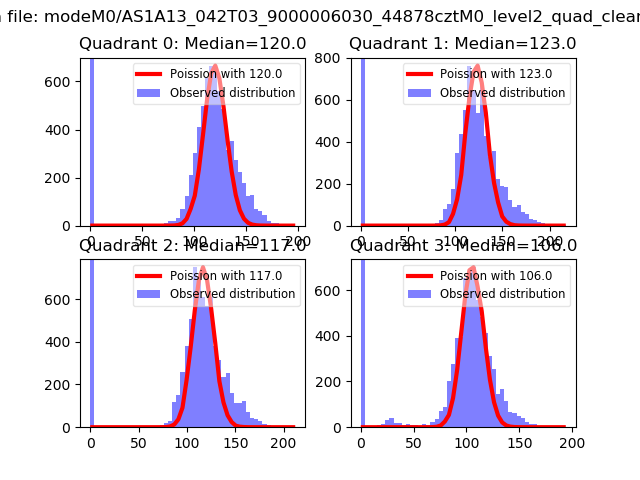 |
 |
| Quadrant-wise count rates Data is divided into 100 sec bins |
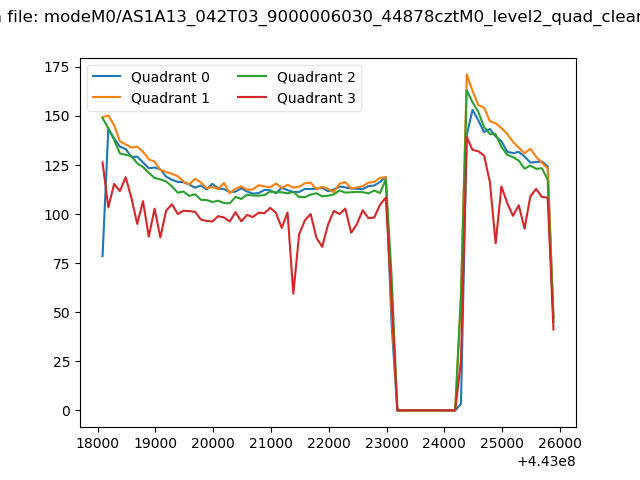 |
|
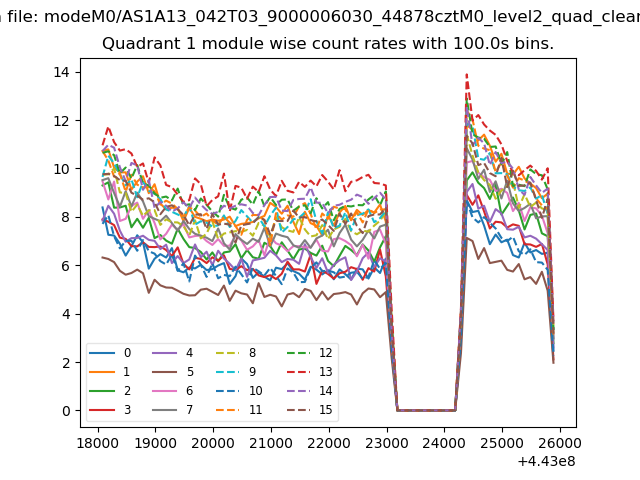
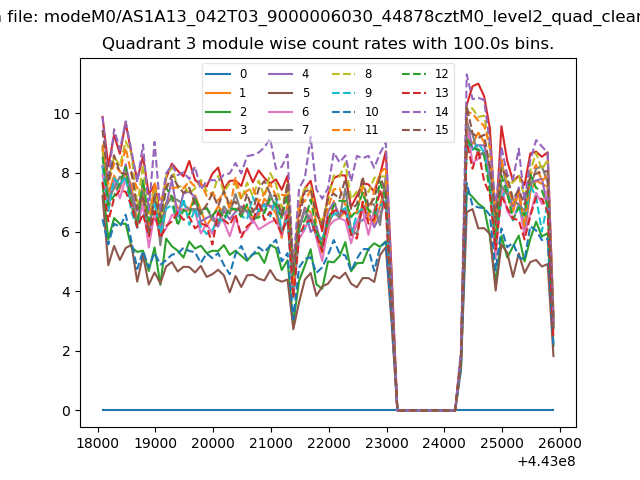
| Module-wise count rates for Quadrant A Data is divided into 100 sec bins |
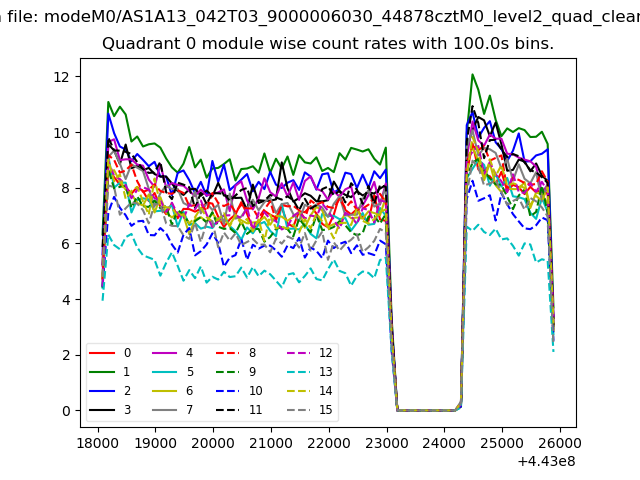 |
 |
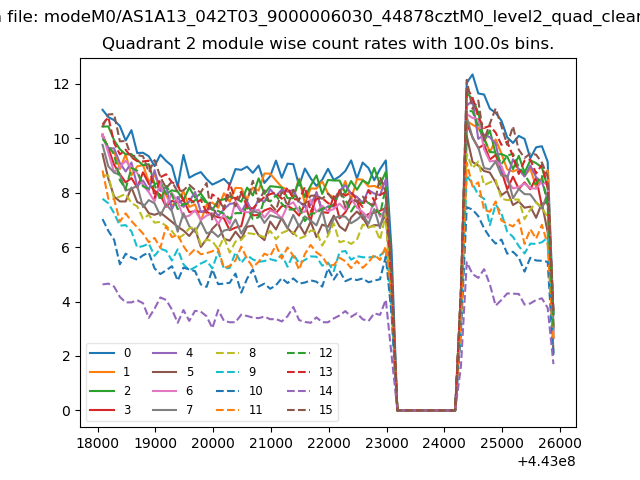
| Module-wise count rates for Quadrant B Data is divided into 100 sec bins |
 |
 |
| Module-wise count rates for Quadrant C Data is divided into 100 sec bins |
 |
 |
| Module-wise count rates for Quadrant D Data is divided into 100 sec bins |
 |
 |
| Parameter | Plot |
|---|---|
| CZT HV Monitor | 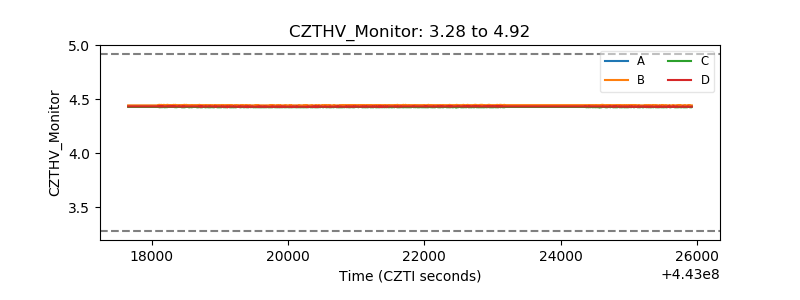 |
| D_VDD | 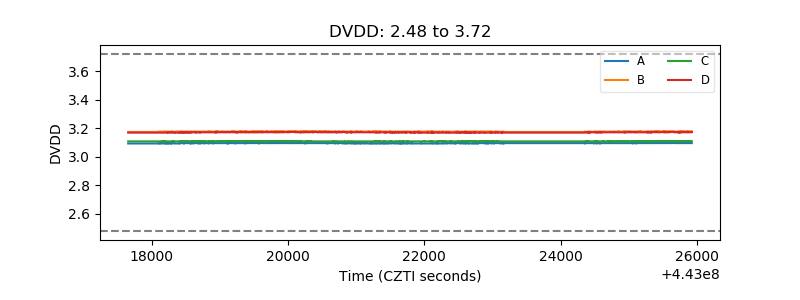 |
| Temperature 1 | 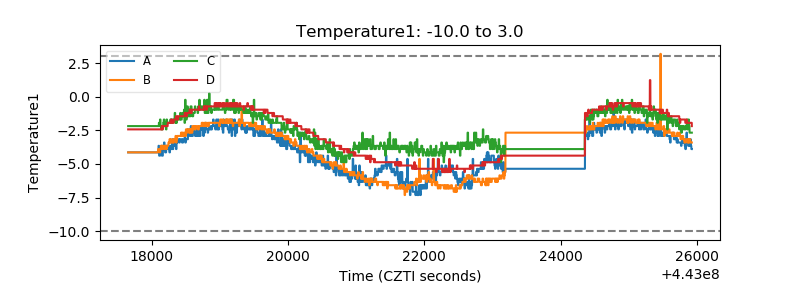 |
| Veto HV Monitor | 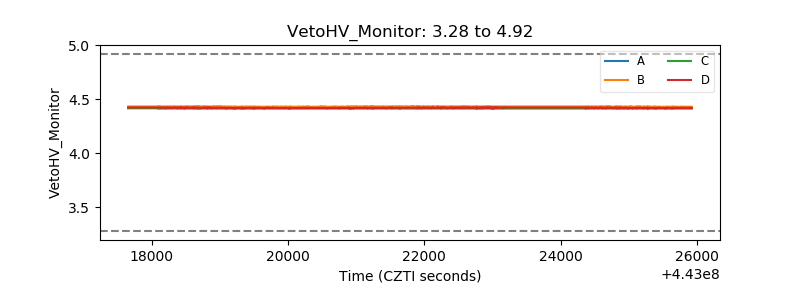 |
| Veto LLD | 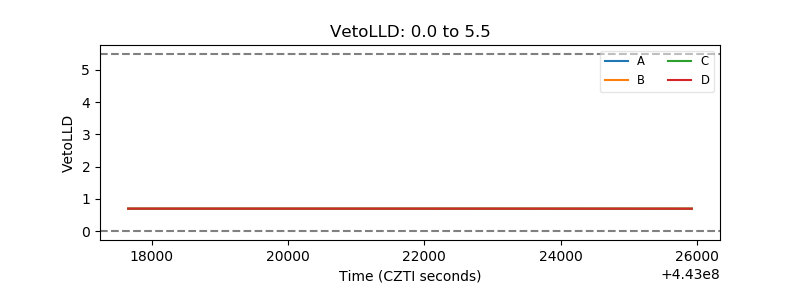 |
| Alpha Counter | 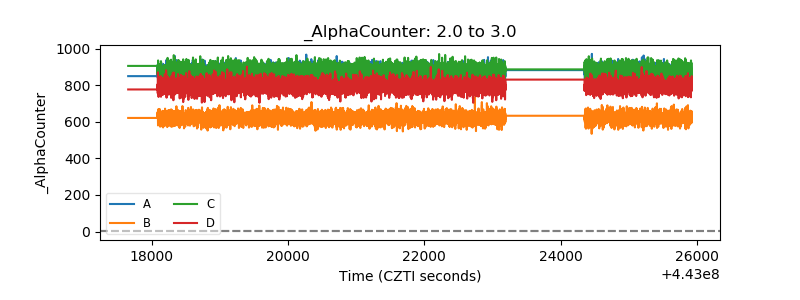 |
| _CPM_Rate | 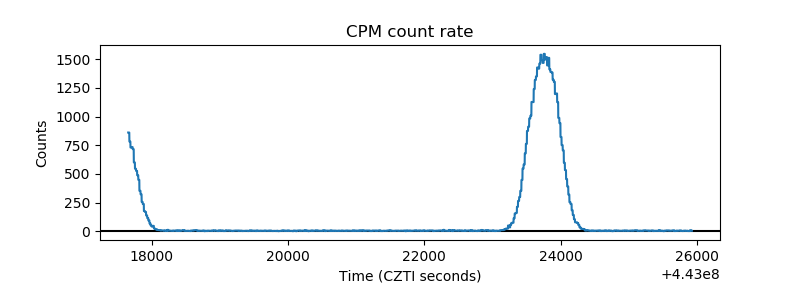 |
| CZT Counter |  |
| +2.5 Volts monitor | 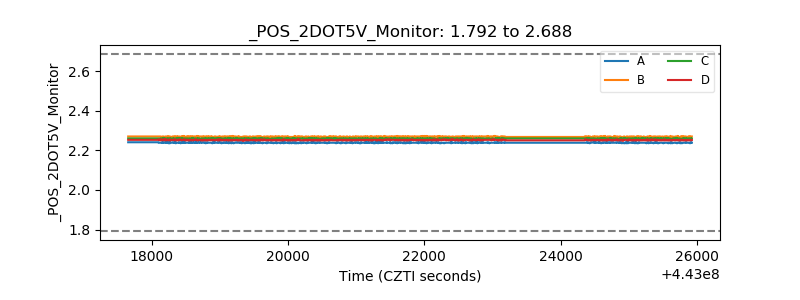 |
| +5 Volts monitor | 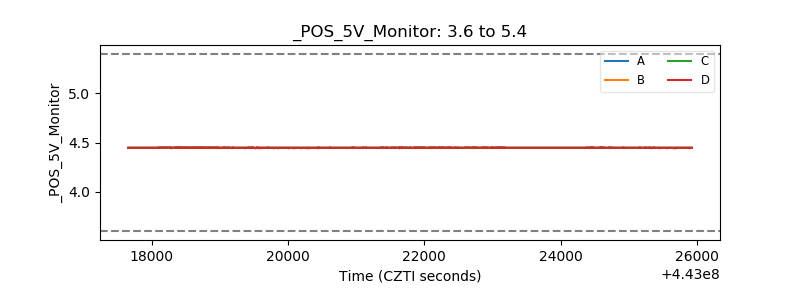 |
| _ROLL_ROT | 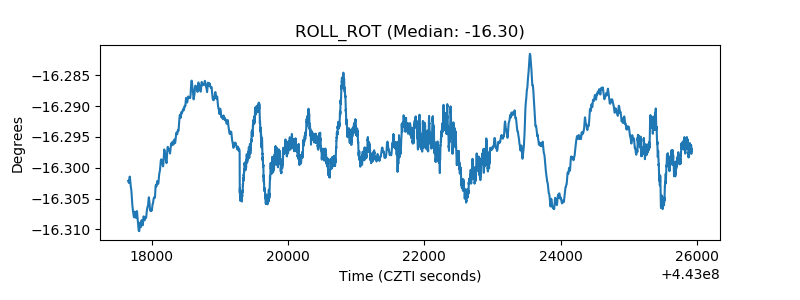 |
| _Roll_DEC | 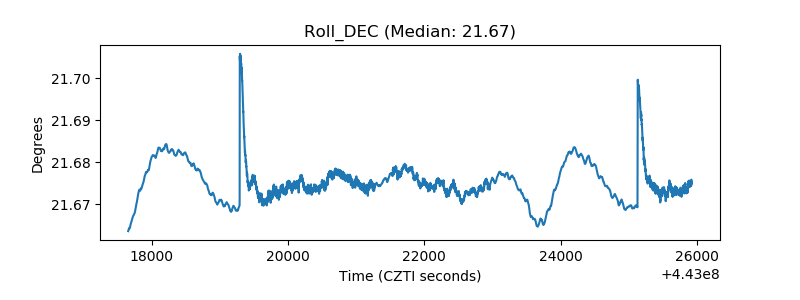 |
| _Roll_RA | 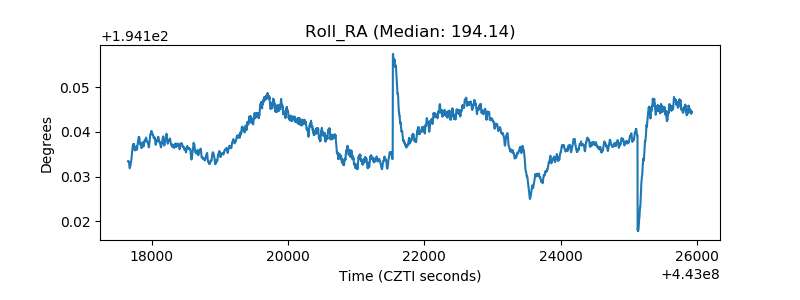 |
| Veto Counter | 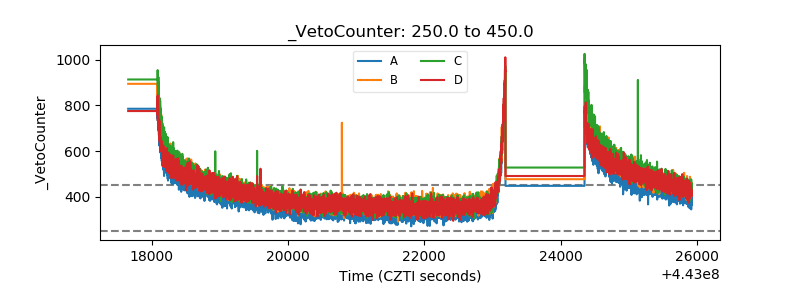 |