| Param | Original file | Final file |
|---|---|---|
| Filename | modeM0/AS1A13_042T03_9000006030_44879cztM0_level2.fits | modeM0/AS1A13_042T03_9000006030_44879cztM0_level2_quad_clean.evt |
| Size (bytes) | 498,499,200 | 105,713,280 |
| Size | 475.4 MB | 100.8 MB |
| Events in quadrant A | 4,932,787 | 730,921 |
| Events in quadrant B | 3,233,257 | 759,325 |
| Events in quadrant C | 3,007,626 | 728,687 |
| Events in quadrant D | 6,816,710 | 565,628 |
| Mode M9 | |||
|---|---|---|---|
| Quadrant | BADHDUFLAG | Total packets | Discarded packets |
| A | 0 | 12 | 0 |
| B | 0 | 12 | 0 |
| C | 0 | 12 | 0 |
| D | 0 | 12 | 0 |
| Mode SS | |||
|---|---|---|---|
| Quadrant | BADHDUFLAG | Total packets | Discarded packets |
| A | 0 | 122 | 0 |
| B | 0 | 122 | 0 |
| C | 0 | 122 | 0 |
| D | 0 | 122 | 0 |
| Mode M0 | |||
|---|---|---|---|
| Quadrant | BADHDUFLAG | Total packets | Discarded packets |
| A | 0 | 19155 | 1 |
| B | 0 | 13518 | 1 |
| C | 0 | 12835 | 1 |
| D | 0 | 24346 | 1 |
| Quadrant | Total seconds | Saturated seconds | Saturation percentage |
|---|---|---|---|
| A | 5960 | 184 | 3.087248% |
| B | 5960 | 121 | 2.030201% |
| C | 5960 | 89 | 1.493289% |
| D | 5960 | 1154 | 19.362416% |
Noise dominated data is calculated using 1-second bins in cleaned event files. If a bin has >2000 counts, and if more than 50% of those come from <1% of pixels, then it is considered to be noise-dominated and hence unusable.
| Quadrant | # 1 sec bins | Bins with >0 counts | Bins with >2000 counts | High rate bins dominated by noise | Noise dominated (total time) | Noise dominated (detector-on time) | Marked lightcurve |
|---|---|---|---|---|---|---|---|
| A | 7185 | 5961 | 12 | 12 | 0.17% | 0.20% | 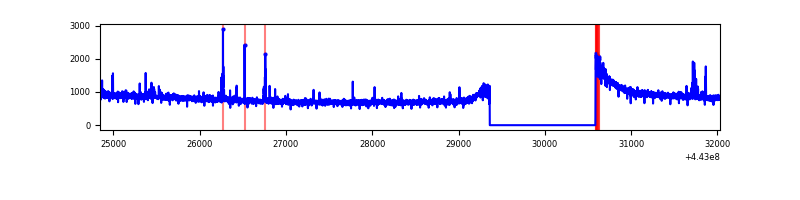 |
| B | 7185 | 5961 | 9 | 9 | 0.13% | 0.15% | 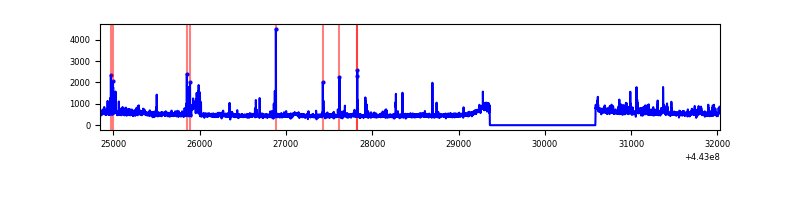 |
| C | 7185 | 5961 | 11 | 11 | 0.15% | 0.18% | 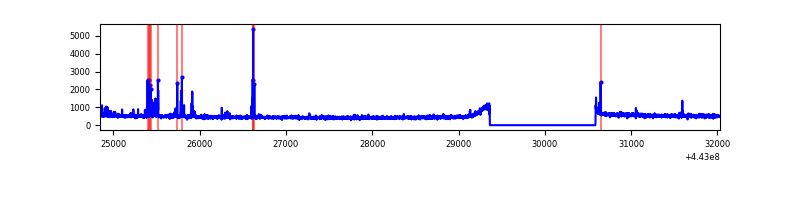 |
| D | 7185 | 5961 | 872 | 872 | 12.14% | 14.63% | 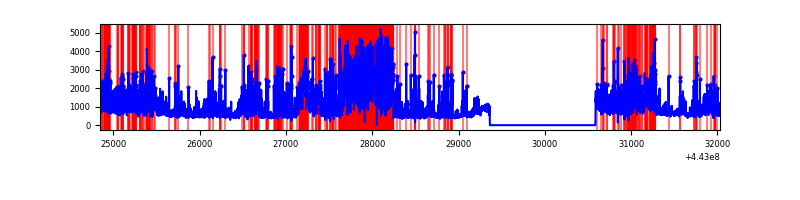 |
Top three noisy pixels from each quadrant. If the there are fewer than three noisy pixels in the level2.evt file, extra rows are filled as -1
| Pixel properties | Quadrant properties | ||||||
|---|---|---|---|---|---|---|---|
| Quadrant | DetID | PixID | Counts | Sigma | Mean | Median | Sigma |
| A | 10 | 83 | 1993331 | 12985.89 | 739 | 722 | 153.4 |
| A | 13 | 248 | 54927 | 353.26 | 739 | 722 | 153.4 |
| A | 2 | 79 | 12016 | 73.6 | 739 | 722 | 153.4 |
| B | 5 | 255 | 130021 | 884.35 | 740 | 718 | 146.2 |
| B | 0 | 155 | 55723 | 376.2 | 740 | 718 | 146.2 |
| B | 0 | 168 | 31758 | 212.29 | 740 | 718 | 146.2 |
| C | 1 | 3 | 62257 | 358.13 | 734 | 739 | 171.8 |
| C | 5 | 4 | 59791 | 343.78 | 734 | 739 | 171.8 |
| C | 14 | 254 | 9705 | 52.2 | 734 | 739 | 171.8 |
| D | 13 | 187 | 1647973 | 9643.04 | 680 | 660 | 170.8 |
| D | 1 | 52 | 1371526 | 8024.78 | 680 | 660 | 170.8 |
| D | 5 | 171 | 765671 | 4478.22 | 680 | 660 | 170.8 |
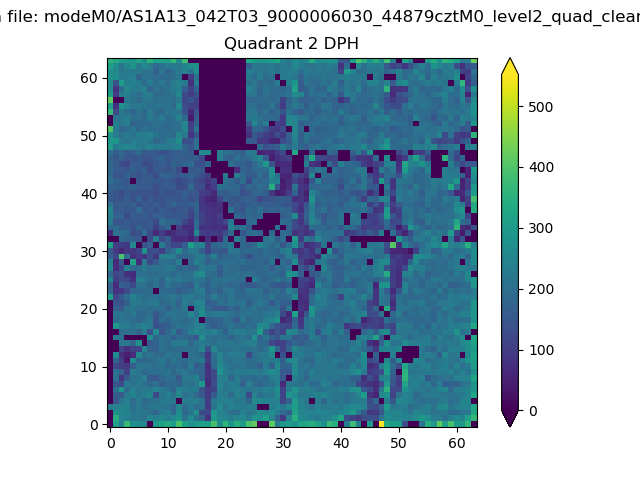
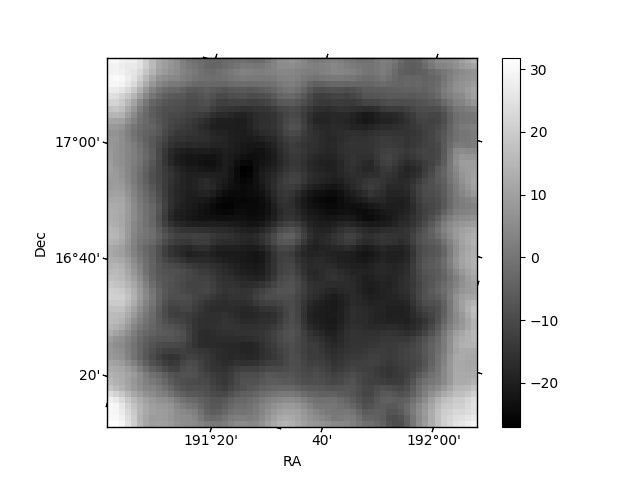
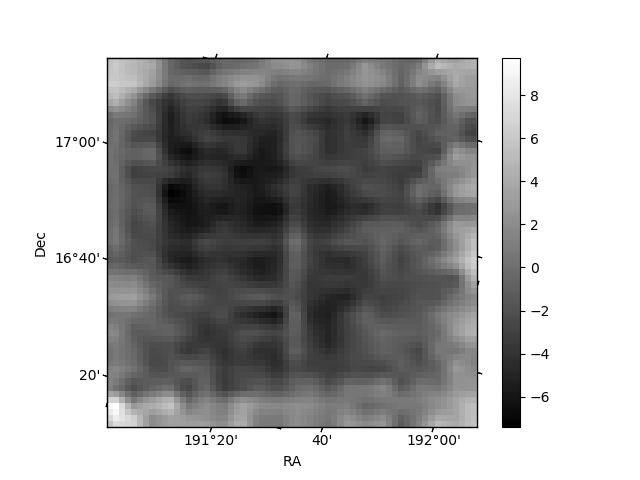
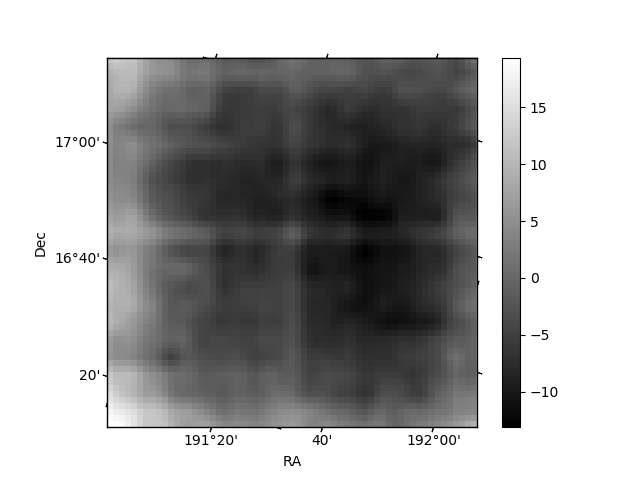
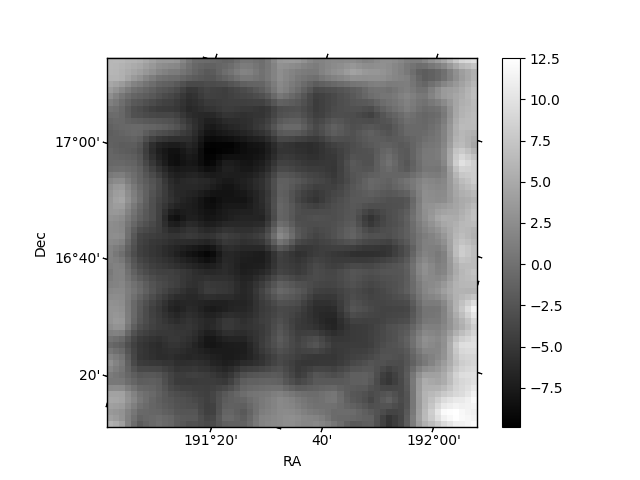
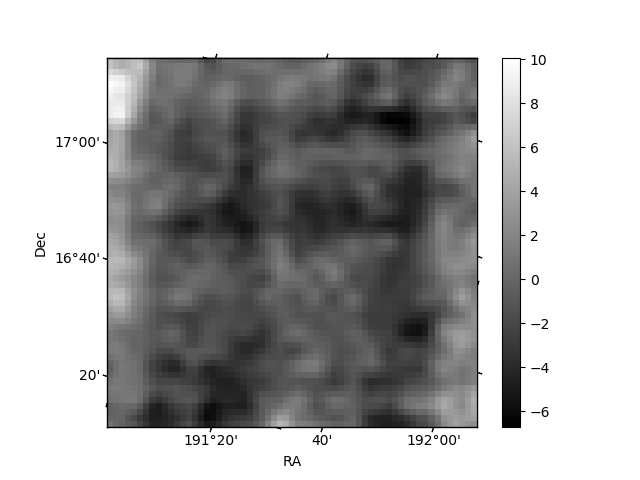
Histogram calculated using DETX and DETY for each event in the final _common_clean file
| Quadrant A | 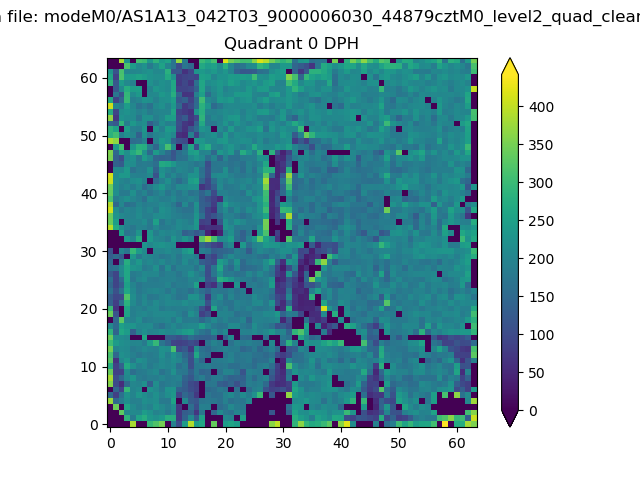 |
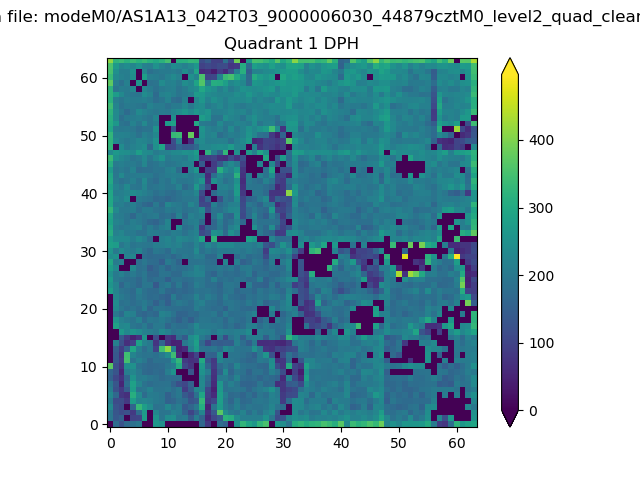 |
Quadrant B |
|---|---|---|---|
| Quadrant D | 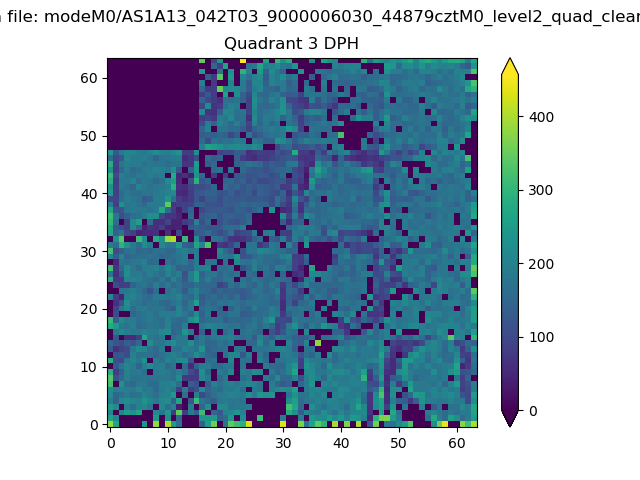 |
 |
Quadrant C |
| Plot type | Count rate plots | Images |
|---|---|---|
| Comparison with Poisson distribution Blue bars denote a histogram of data divided into 1 sec bins. Red curve is a Poisson curve with rate = median count rate of data. |
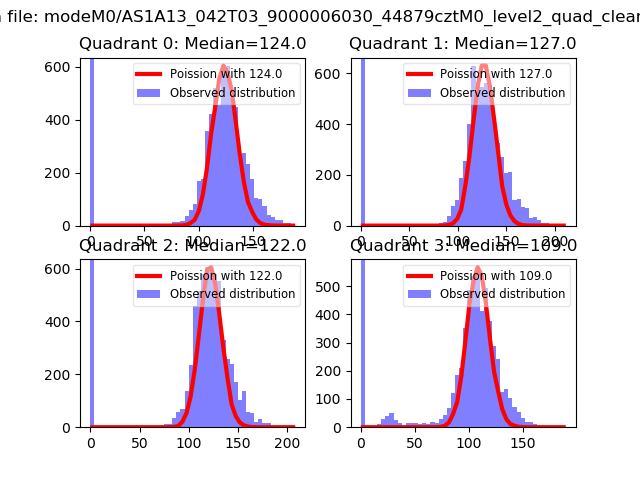 |
 |
| Quadrant-wise count rates Data is divided into 100 sec bins |
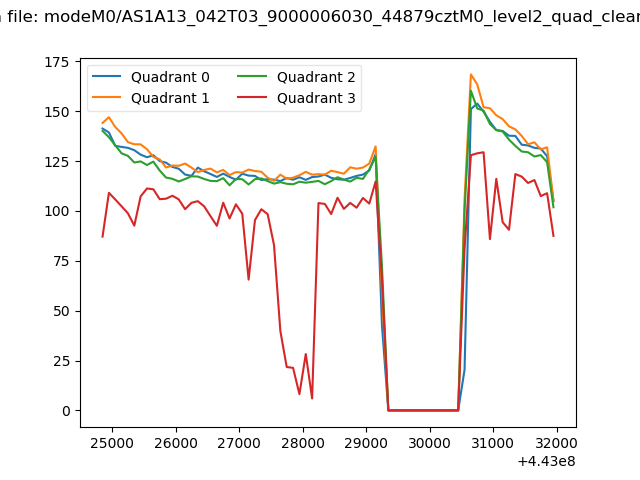 |
|
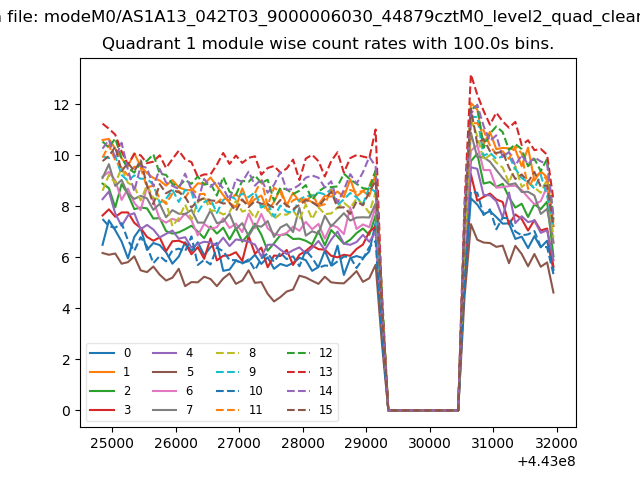
| Module-wise count rates for Quadrant A Data is divided into 100 sec bins |
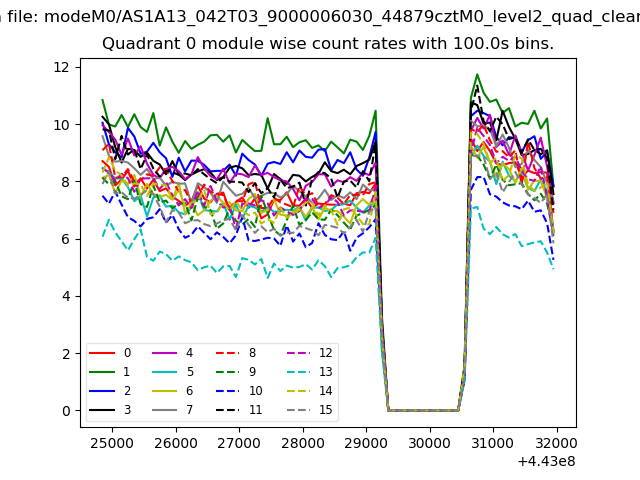 |
 |
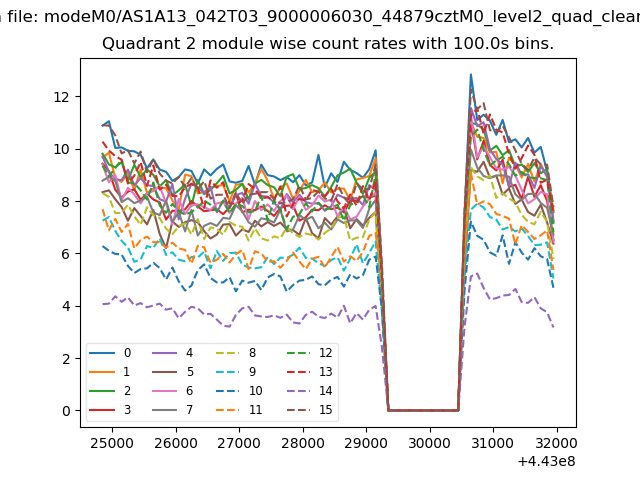
| Module-wise count rates for Quadrant B Data is divided into 100 sec bins |
 |
 |
| Module-wise count rates for Quadrant C Data is divided into 100 sec bins |
 |
 |
| Module-wise count rates for Quadrant D Data is divided into 100 sec bins |
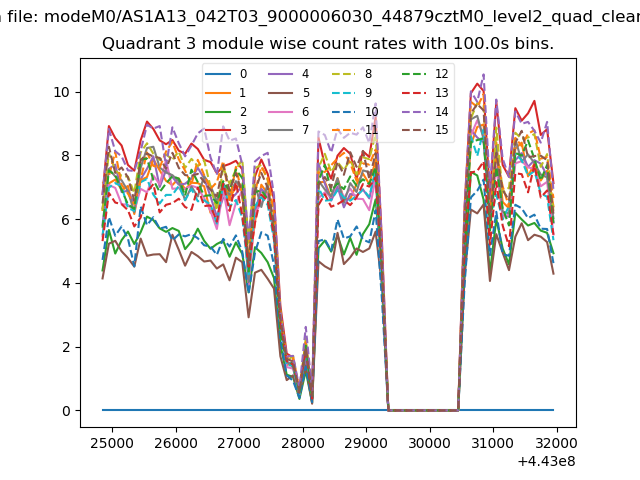 |
 |
| Parameter | Plot |
|---|---|
| CZT HV Monitor | 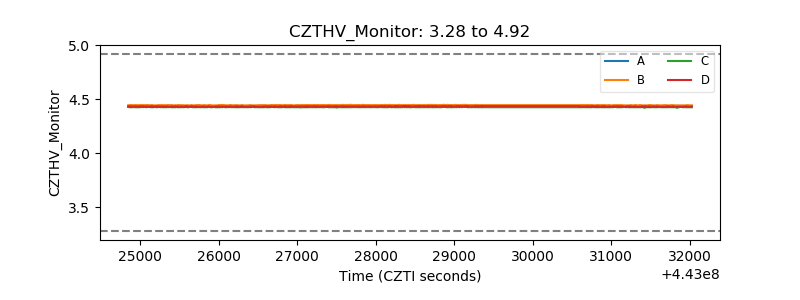 |
| D_VDD | 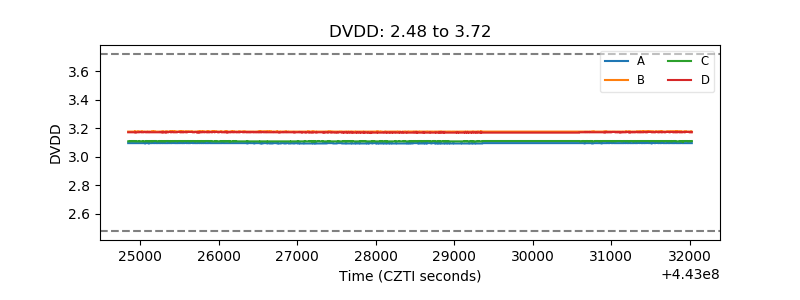 |
| Temperature 1 | 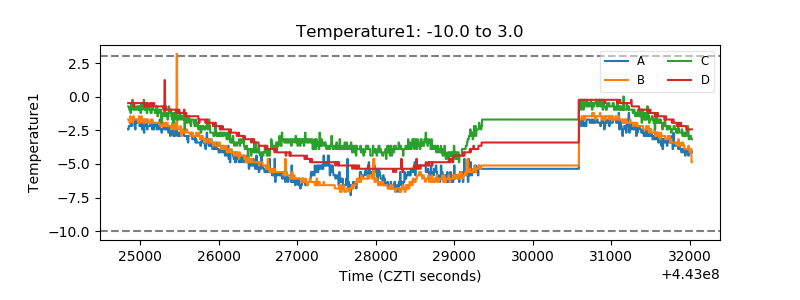 |
| Veto HV Monitor | 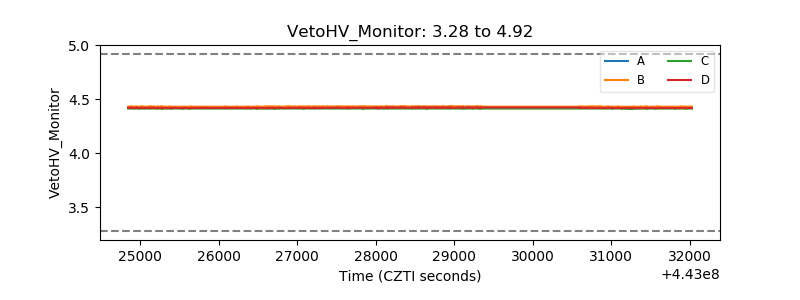 |
| Veto LLD | 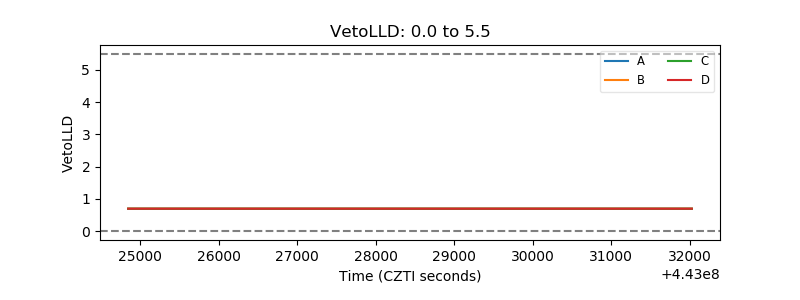 |
| Alpha Counter | 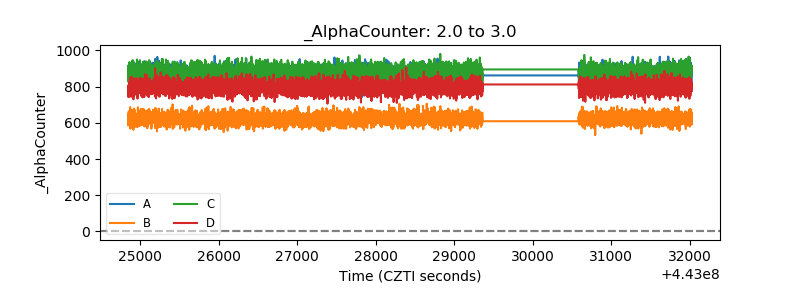 |
| _CPM_Rate | 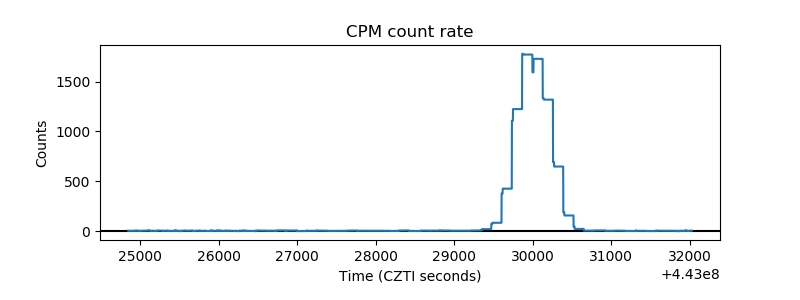 |
| CZT Counter | 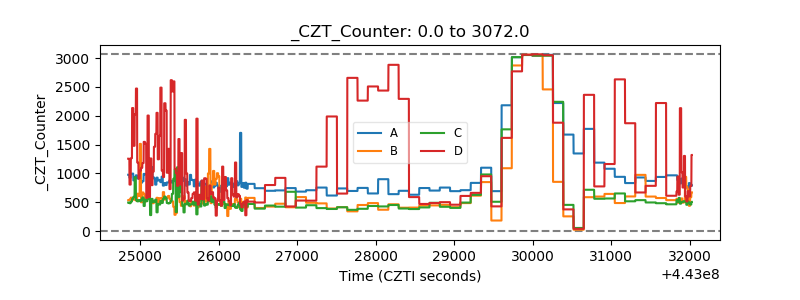 |
| +2.5 Volts monitor | 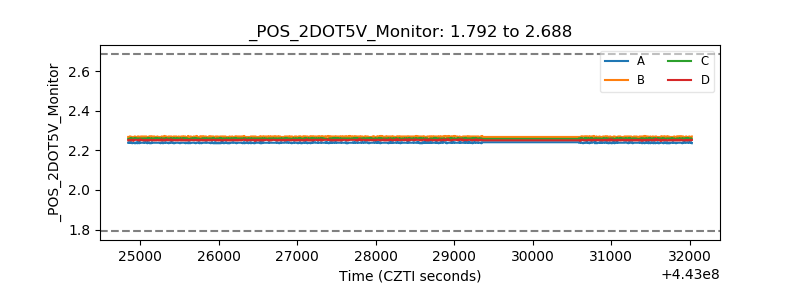 |
| +5 Volts monitor | 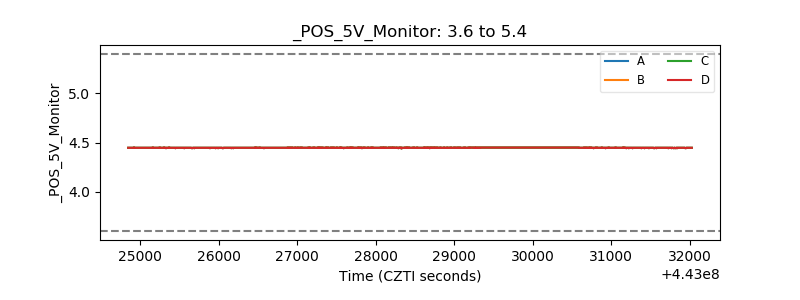 |
| _ROLL_ROT | 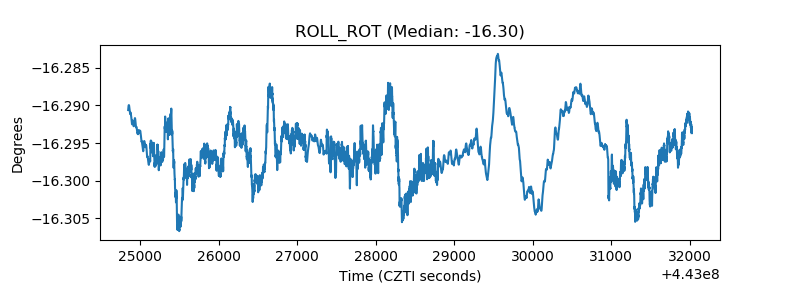 |
| _Roll_DEC | 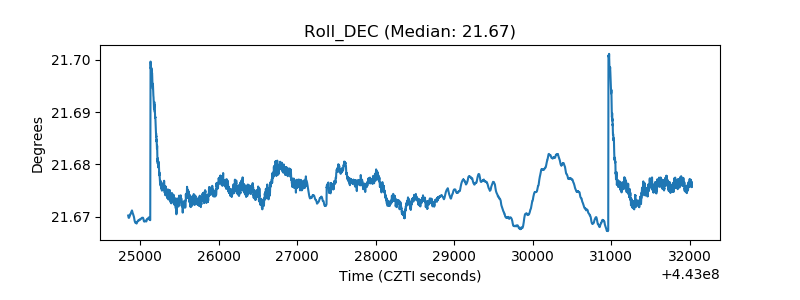 |
| _Roll_RA | 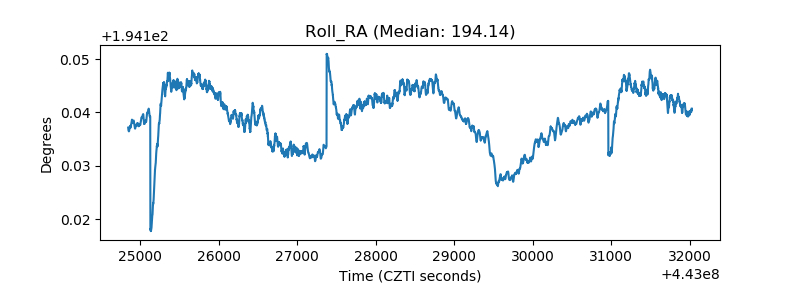 |
| Veto Counter | 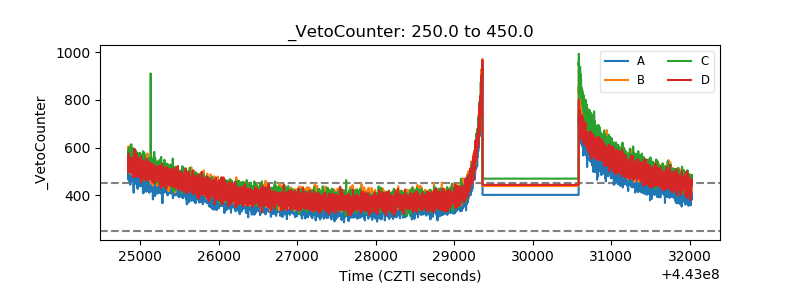 |