| Param | Original file | Final file |
|---|---|---|
| Filename | modeM0/AS1A13_042T03_9000006030_44880cztM0_level2.fits | modeM0/AS1A13_042T03_9000006030_44880cztM0_level2_quad_clean.evt |
| Size (bytes) | 197,962,560 | 46,978,560 |
| Size | 188.8 MB | 44.8 MB |
| Events in quadrant A | 2,074,803 | 322,403 |
| Events in quadrant B | 1,403,175 | 330,179 |
| Events in quadrant C | 1,235,628 | 318,124 |
| Events in quadrant D | 2,414,850 | 269,689 |
| Mode SS | |||
|---|---|---|---|
| Quadrant | BADHDUFLAG | Total packets | Discarded packets |
| A | 0 | 50 | 0 |
| B | 0 | 50 | 0 |
| C | 0 | 50 | 0 |
| D | 0 | 50 | 0 |
| Mode M0 | |||
|---|---|---|---|
| Quadrant | BADHDUFLAG | Total packets | Discarded packets |
| A | 0 | 8042 | 0 |
| B | 0 | 5780 | 0 |
| C | 0 | 5237 | 0 |
| D | 0 | 8933 | 0 |
| Quadrant | Total seconds | Saturated seconds | Saturation percentage |
|---|---|---|---|
| A | 2541 | 19 | 0.747737% |
| B | 2542 | 15 | 0.590087% |
| C | 2542 | 2 | 0.078678% |
| D | 2542 | 249 | 9.795437% |
Noise dominated data is calculated using 1-second bins in cleaned event files. If a bin has >2000 counts, and if more than 50% of those come from <1% of pixels, then it is considered to be noise-dominated and hence unusable.
| Quadrant | # 1 sec bins | Bins with >0 counts | Bins with >2000 counts | High rate bins dominated by noise | Noise dominated (total time) | Noise dominated (detector-on time) | Marked lightcurve |
|---|---|---|---|---|---|---|---|
| A | 2541 | 2541 | 13 | 13 | 0.51% | 0.51% |  |
| B | 2542 | 2542 | 5 | 5 | 0.20% | 0.20% |  |
| C | 2542 | 2542 | 1 | 1 | 0.04% | 0.04% |  |
| D | 2542 | 2542 | 189 | 189 | 7.44% | 7.44% |  |
Top three noisy pixels from each quadrant. If the there are fewer than three noisy pixels in the level2.evt file, extra rows are filled as -1
| Pixel properties | Quadrant properties | ||||||
|---|---|---|---|---|---|---|---|
| Quadrant | DetID | PixID | Counts | Sigma | Mean | Median | Sigma |
| A | 10 | 83 | 812925 | 12686.16 | 305 | 299 | 64.1 |
| A | 13 | 248 | 66938 | 1040.32 | 305 | 299 | 64.1 |
| A | 15 | 174 | 5691 | 84.18 | 305 | 299 | 64.1 |
| B | 5 | 255 | 90646 | 1494.62 | 306 | 298 | 60.4 |
| B | 0 | 155 | 40220 | 660.43 | 306 | 298 | 60.4 |
| B | 0 | 183 | 23738 | 387.77 | 306 | 298 | 60.4 |
| C | 1 | 3 | 31700 | 432.48 | 305 | 307 | 72.6 |
| C | 14 | 254 | 6341 | 83.12 | 305 | 307 | 72.6 |
| C | 3 | 233 | 5071 | 65.62 | 305 | 307 | 72.6 |
| D | 1 | 52 | 591501 | 7953.25 | 292 | 283 | 74.3 |
| D | 5 | 171 | 256376 | 3445.05 | 292 | 283 | 74.3 |
| D | 2 | 249 | 179541 | 2411.44 | 292 | 283 | 74.3 |
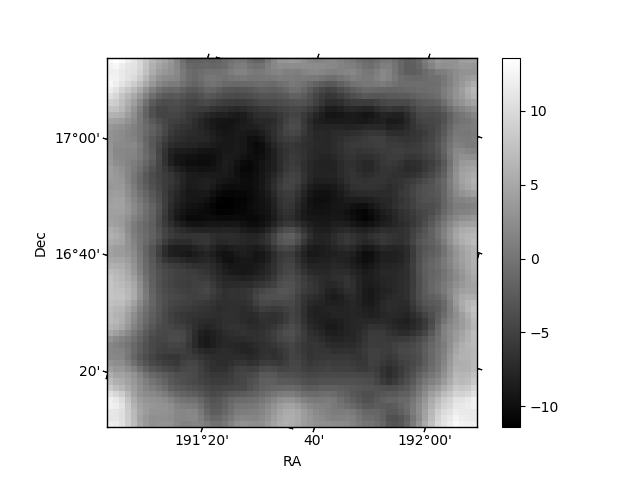
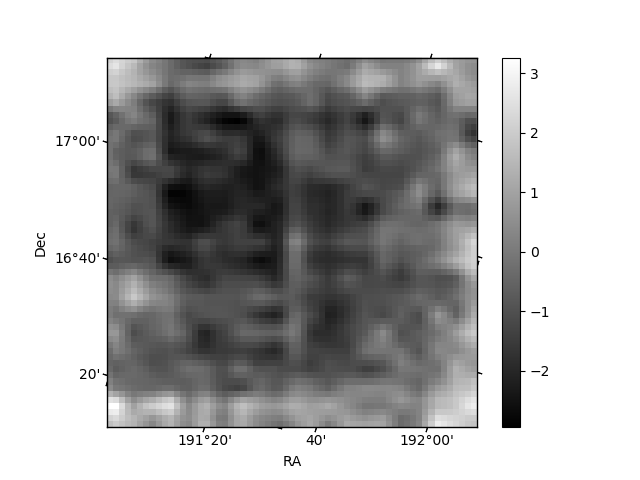
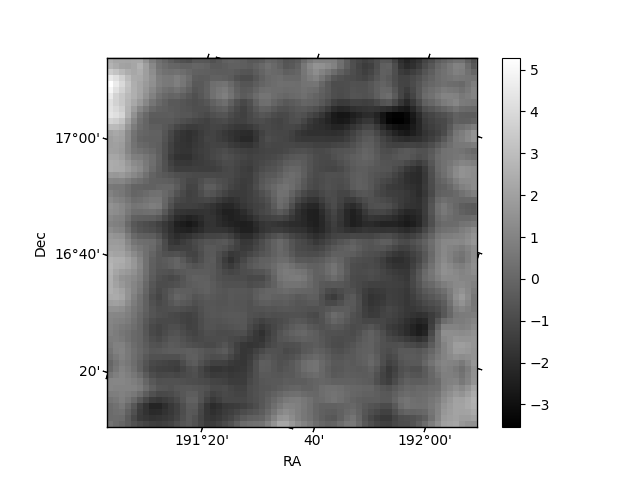
Histogram calculated using DETX and DETY for each event in the final _common_clean file
| Quadrant A | 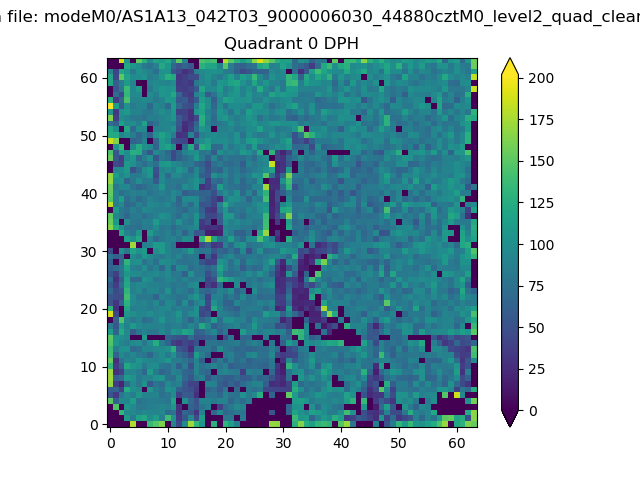 |
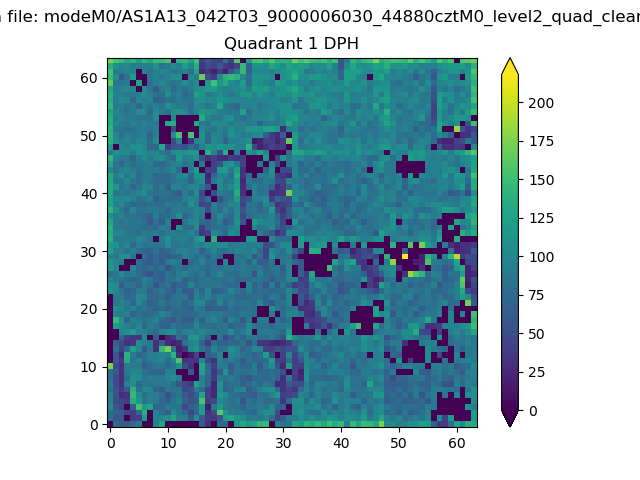 |
Quadrant B |
|---|---|---|---|
| Quadrant D | 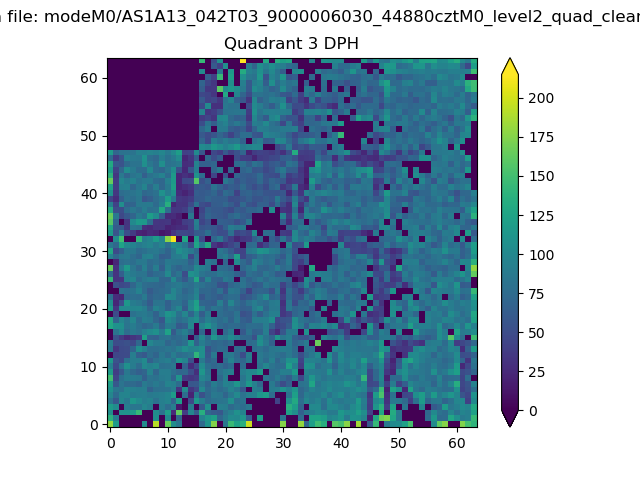 |
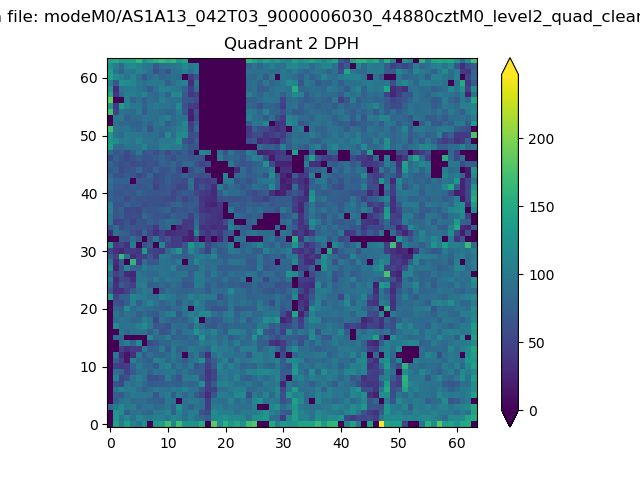 |
Quadrant C |
| Plot type | Count rate plots | Images |
|---|---|---|
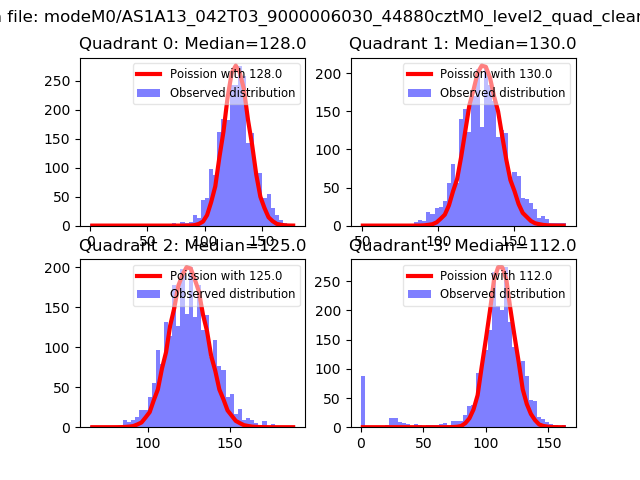
| Comparison with Poisson distribution Blue bars denote a histogram of data divided into 1 sec bins. Red curve is a Poisson curve with rate = median count rate of data. |
 |
 |
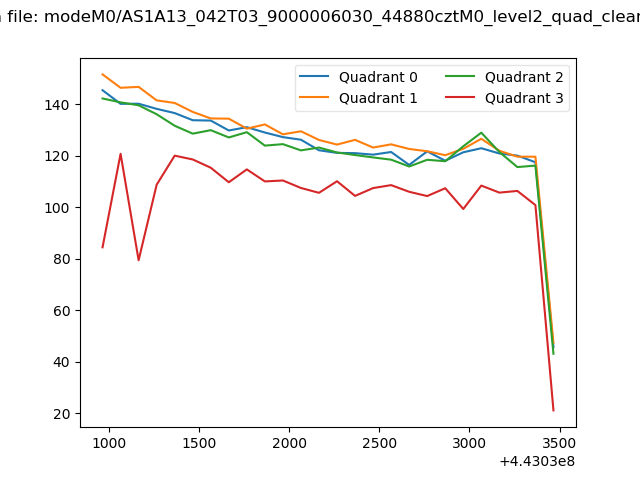
| Quadrant-wise count rates Data is divided into 100 sec bins |
 |
|
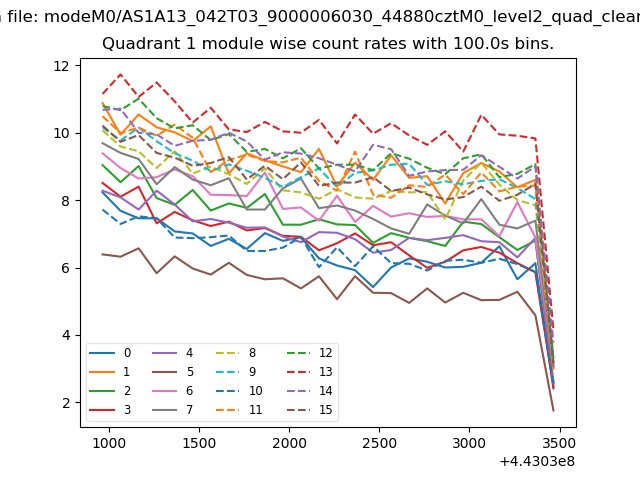
| Module-wise count rates for Quadrant A Data is divided into 100 sec bins |
 |
 |
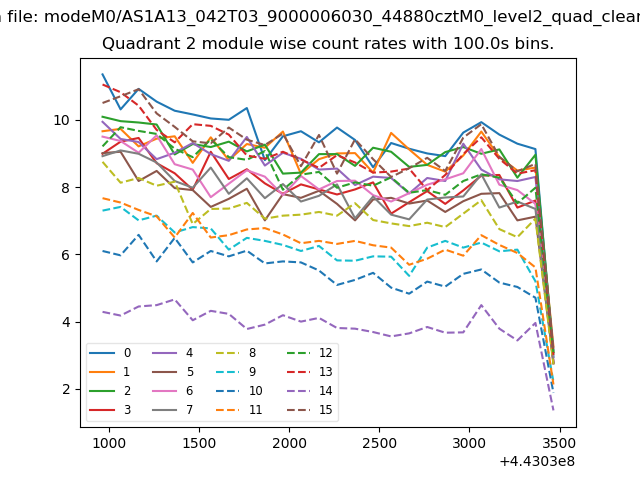
| Module-wise count rates for Quadrant B Data is divided into 100 sec bins |
 |
 |
| Module-wise count rates for Quadrant C Data is divided into 100 sec bins |
 |
 |
| Module-wise count rates for Quadrant D Data is divided into 100 sec bins |
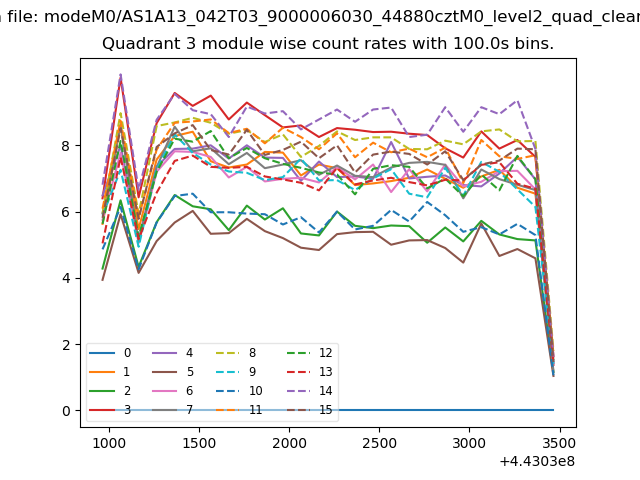 |
 |
| Parameter | Plot |
|---|---|
| CZT HV Monitor | 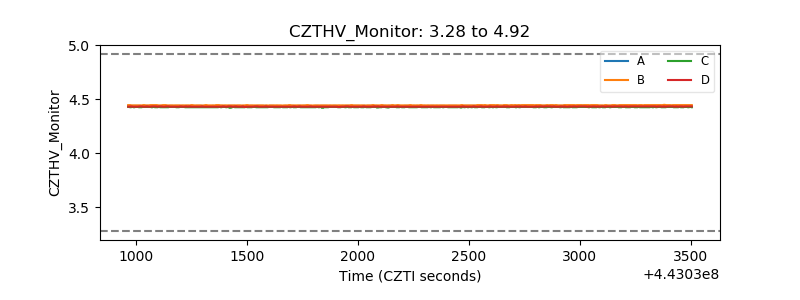 |
| D_VDD | 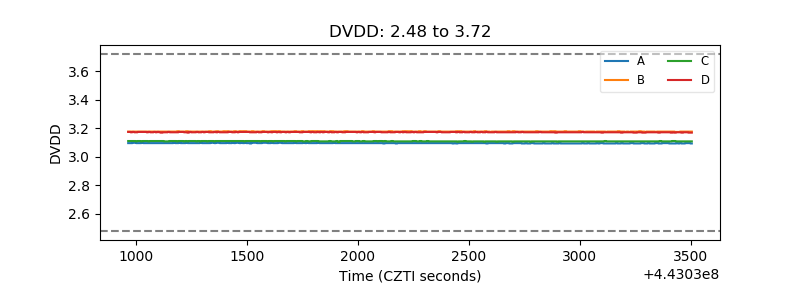 |
| Temperature 1 | 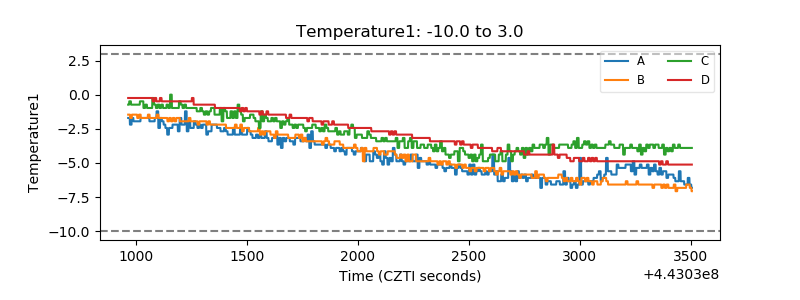 |
| Veto HV Monitor |  |
| Veto LLD | 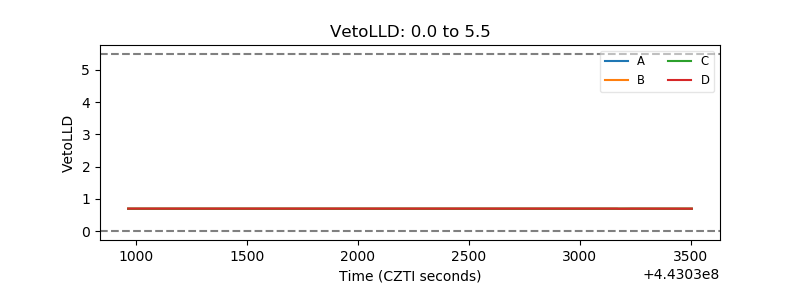 |
| Alpha Counter | 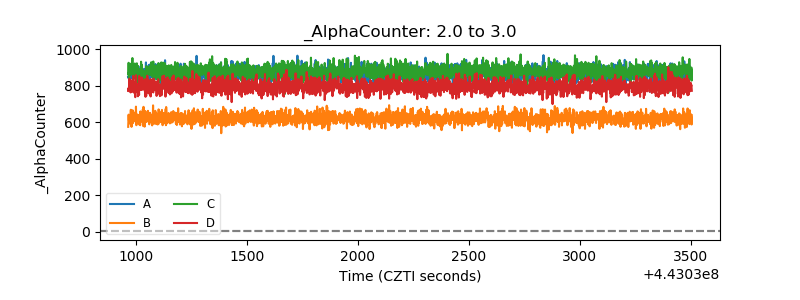 |
| _CPM_Rate | 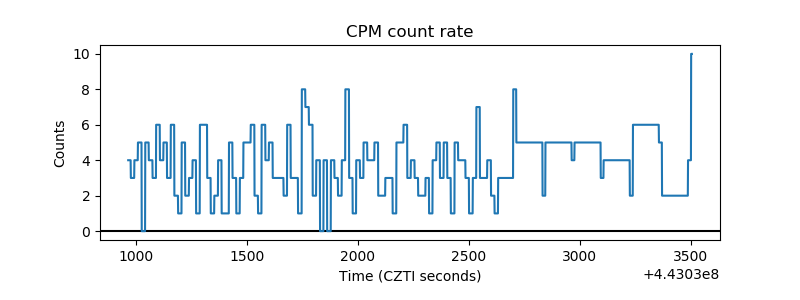 |
| CZT Counter | 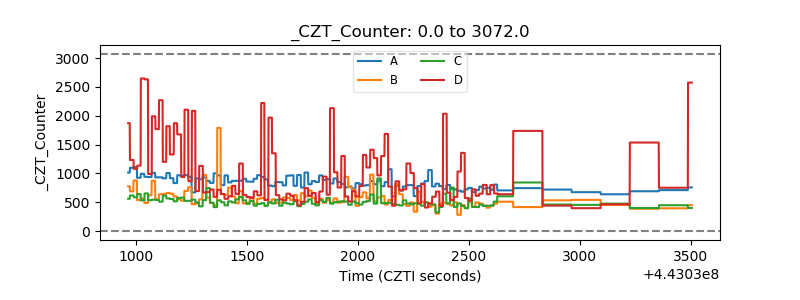 |
| +2.5 Volts monitor | 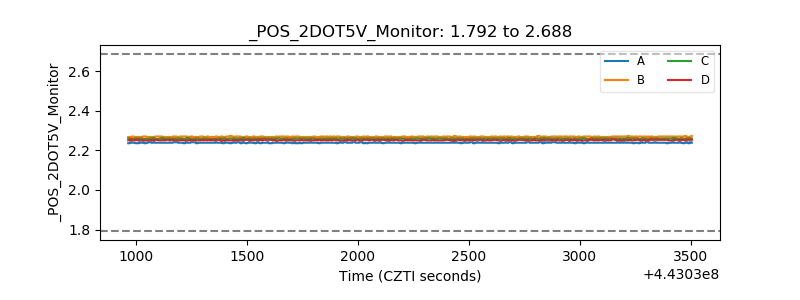 |
| +5 Volts monitor | 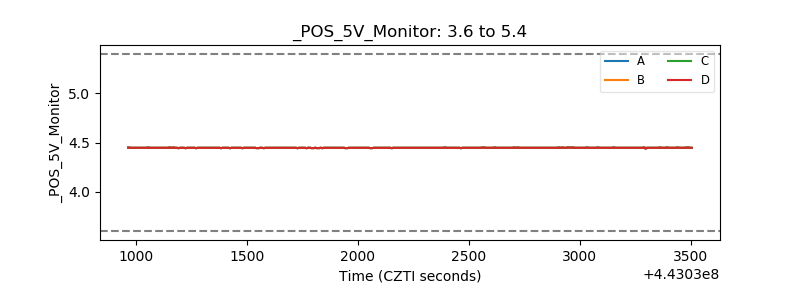 |
| _ROLL_ROT | 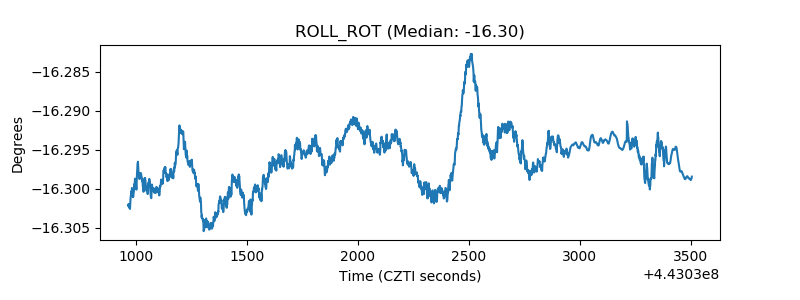 |
| _Roll_DEC | 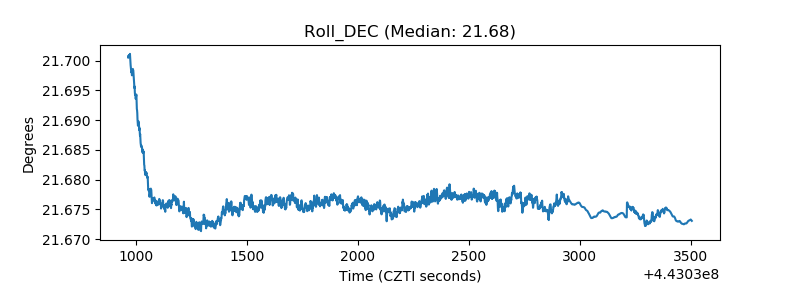 |
| _Roll_RA | 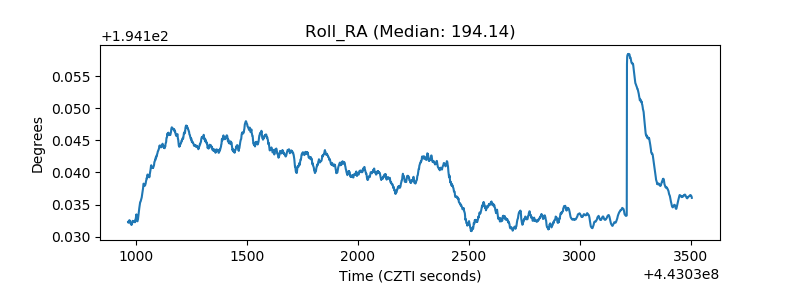 |
| Veto Counter | 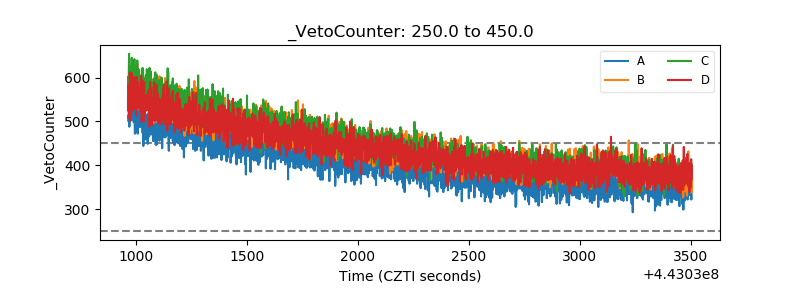 |