| Param | Original file | Final file |
|---|---|---|
| Filename | modeM0/AS1A13_044T01_9000006034_44968cztM0_level2.fits | modeM0/AS1A13_044T01_9000006034_44968cztM0_level2_quad_clean.evt |
| Size (bytes) | 528,624,000 | 110,937,600 |
| Size | 504.1 MB | 105.8 MB |
| Events in quadrant A | 5,605,643 | 761,013 |
| Events in quadrant B | 4,493,110 | 761,993 |
| Events in quadrant C | 3,375,659 | 739,027 |
| Events in quadrant D | 5,590,872 | 644,564 |
| Mode M9 | |||
|---|---|---|---|
| Quadrant | BADHDUFLAG | Total packets | Discarded packets |
| A | 0 | 12 | 0 |
| B | 0 | 12 | 0 |
| C | 0 | 12 | 0 |
| D | 0 | 12 | 0 |
| Mode M0 | |||
|---|---|---|---|
| Quadrant | BADHDUFLAG | Total packets | Discarded packets |
| A | 0 | 20957 | 2 |
| B | 0 | 17632 | 1 |
| C | 0 | 14419 | 1 |
| D | 0 | 21090 | 1 |
| Mode SS | |||
|---|---|---|---|
| Quadrant | BADHDUFLAG | Total packets | Discarded packets |
| A | 0 | 132 | 0 |
| B | 0 | 132 | 0 |
| C | 0 | 132 | 0 |
| D | 0 | 132 | 0 |
| Quadrant | Total seconds | Saturated seconds | Saturation percentage |
|---|---|---|---|
| A | 6484 | 193 | 2.976558% |
| B | 6485 | 337 | 5.196608% |
| C | 6485 | 111 | 1.711642% |
| D | 6485 | 622 | 9.591365% |
Noise dominated data is calculated using 1-second bins in cleaned event files. If a bin has >2000 counts, and if more than 50% of those come from <1% of pixels, then it is considered to be noise-dominated and hence unusable.
| Quadrant | # 1 sec bins | Bins with >0 counts | Bins with >2000 counts | High rate bins dominated by noise | Noise dominated (total time) | Noise dominated (detector-on time) | Marked lightcurve |
|---|---|---|---|---|---|---|---|
| A | 7659 | 6485 | 13 | 13 | 0.17% | 0.20% | 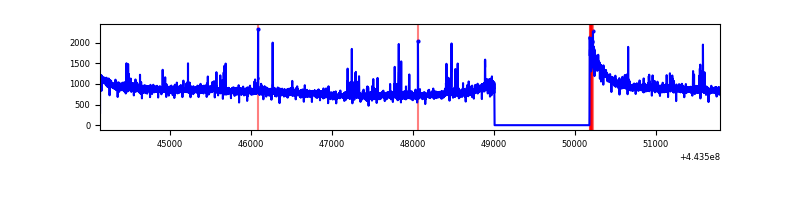 |
| B | 7660 | 6486 | 174 | 174 | 2.27% | 2.68% | 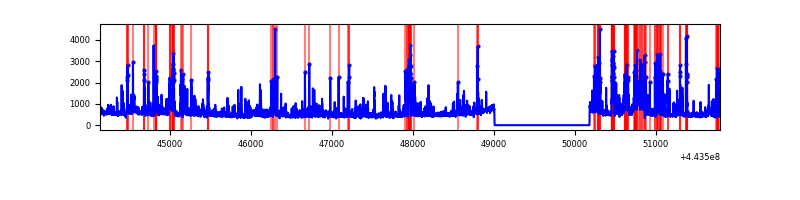 |
| C | 7660 | 6486 | 52 | 52 | 0.68% | 0.80% | 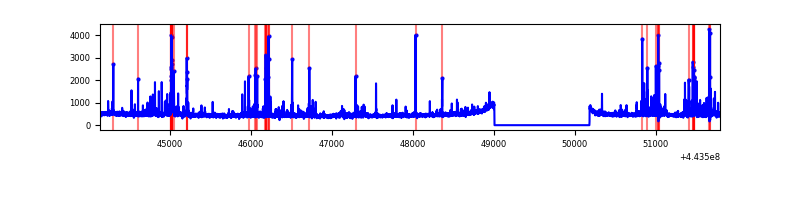 |
| D | 7660 | 6486 | 455 | 455 | 5.94% | 7.02% | 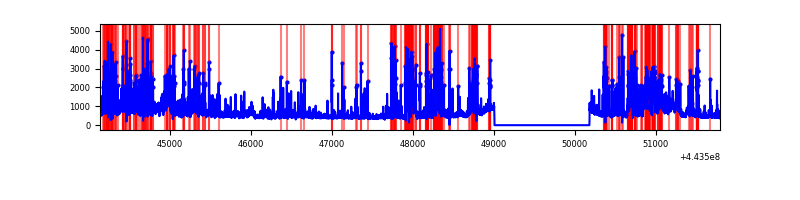 |
Top three noisy pixels from each quadrant. If the there are fewer than three noisy pixels in the level2.evt file, extra rows are filled as -1
| Pixel properties | Quadrant properties | ||||||
|---|---|---|---|---|---|---|---|
| Quadrant | DetID | PixID | Counts | Sigma | Mean | Median | Sigma |
| A | 10 | 83 | 2520830 | 15947.31 | 760 | 744 | 158.0 |
| A | 7 | 3 | 61767 | 386.16 | 760 | 744 | 158.0 |
| A | 13 | 6 | 29475 | 181.81 | 760 | 744 | 158.0 |
| B | 0 | 189 | 679359 | 4722.08 | 745 | 724 | 143.7 |
| B | 0 | 219 | 167259 | 1158.79 | 745 | 724 | 143.7 |
| B | 4 | 171 | 134284 | 929.34 | 745 | 724 | 143.7 |
| C | 12 | 2 | 174132 | 992.79 | 742 | 747 | 174.6 |
| C | 1 | 3 | 140646 | 801.05 | 742 | 747 | 174.6 |
| C | 12 | 250 | 56182 | 317.42 | 742 | 747 | 174.6 |
| D | 13 | 249 | 700611 | 3855.15 | 725 | 705 | 181.6 |
| D | 12 | 233 | 497584 | 2736.86 | 725 | 705 | 181.6 |
| D | 5 | 235 | 438537 | 2411.62 | 725 | 705 | 181.6 |
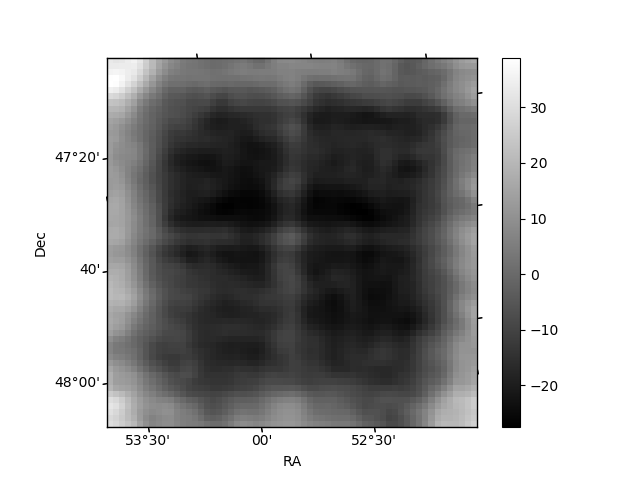
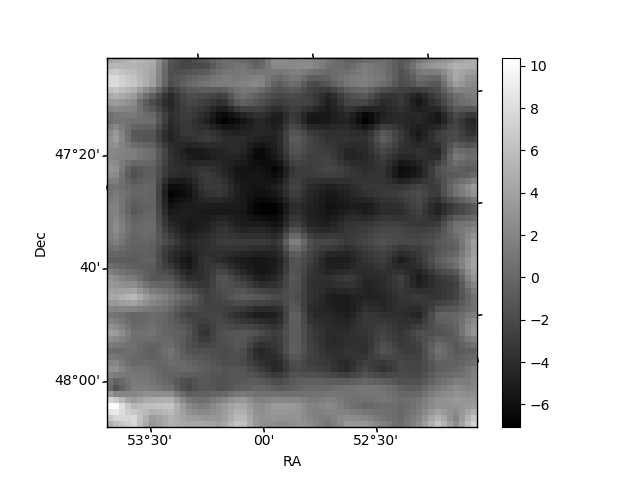
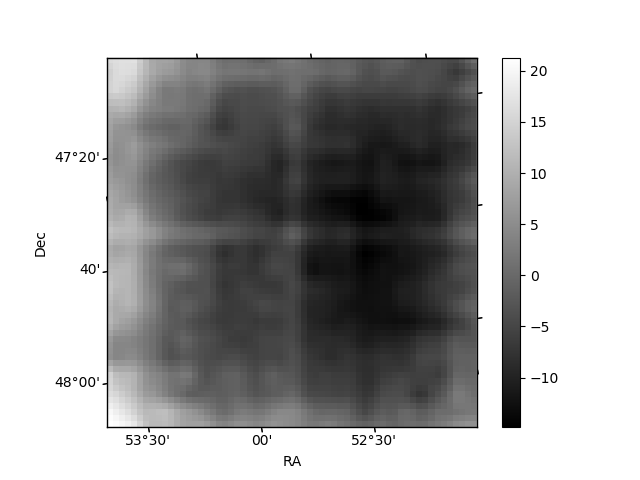
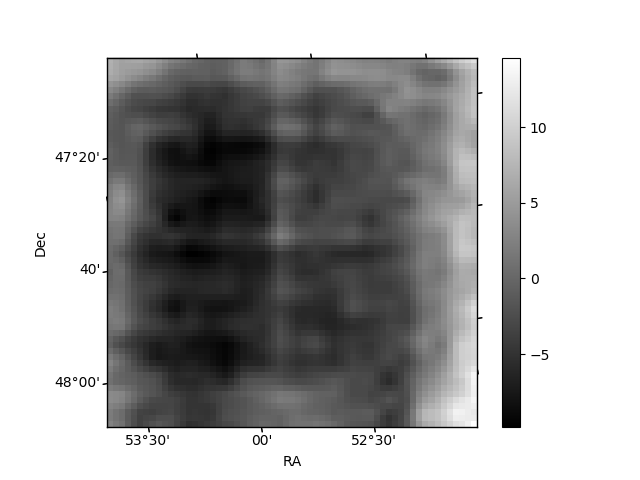
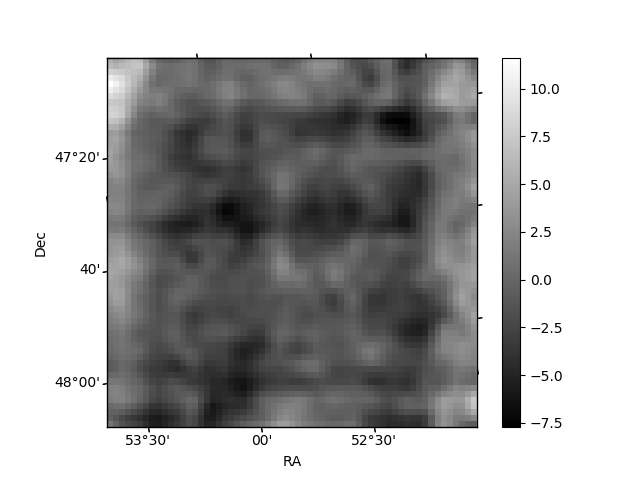
Histogram calculated using DETX and DETY for each event in the final _common_clean file
| Quadrant A | 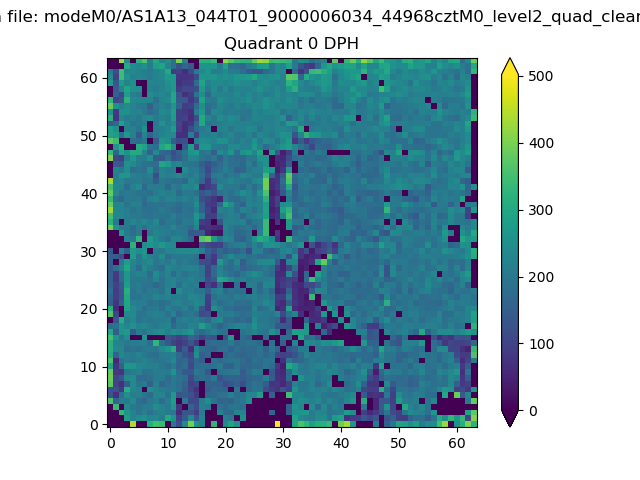 |
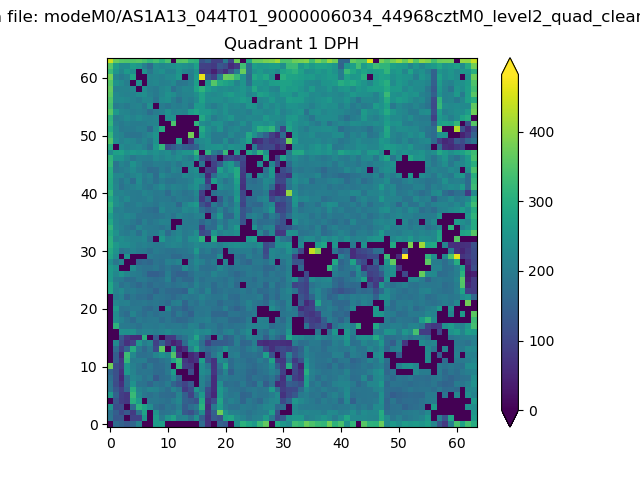 |
Quadrant B |
|---|---|---|---|
| Quadrant D | 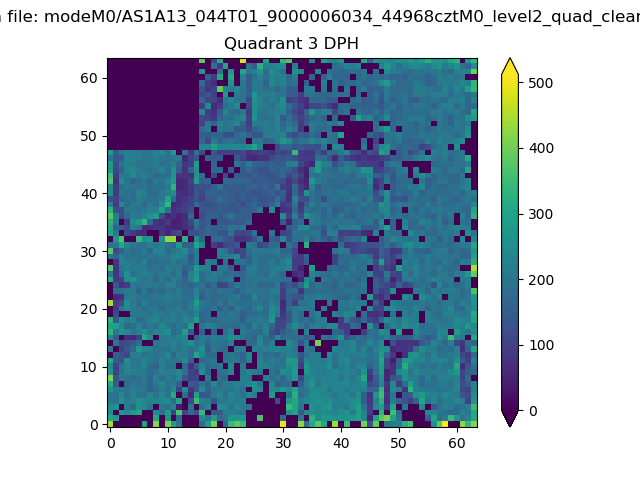 |
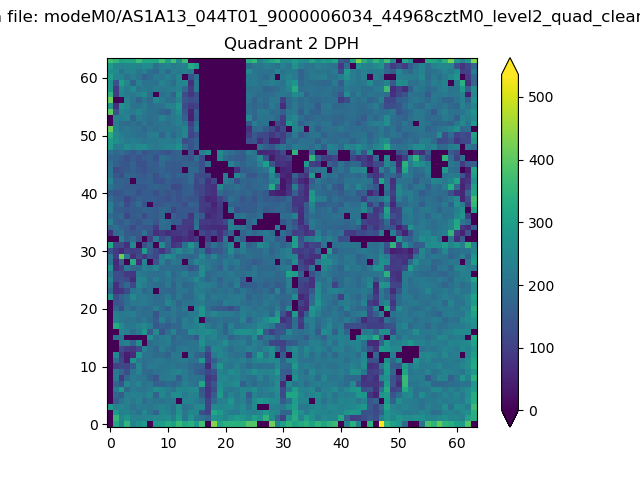 |
Quadrant C |
| Plot type | Count rate plots | Images |
|---|---|---|
| Comparison with Poisson distribution Blue bars denote a histogram of data divided into 1 sec bins. Red curve is a Poisson curve with rate = median count rate of data. |
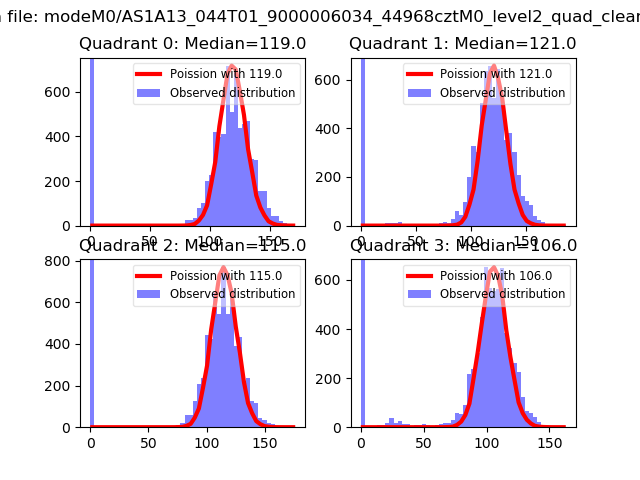 |
 |
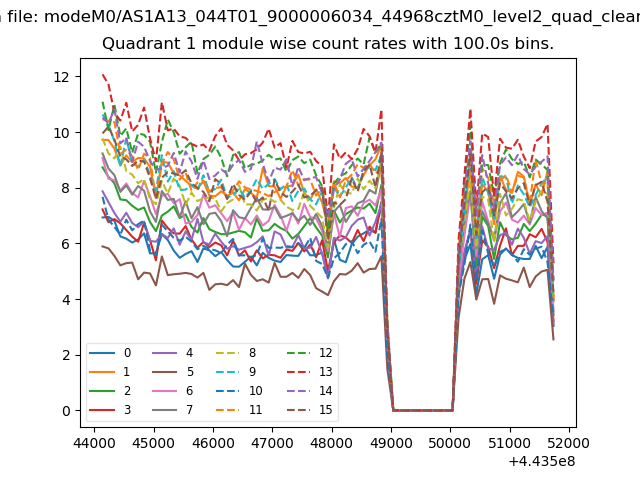
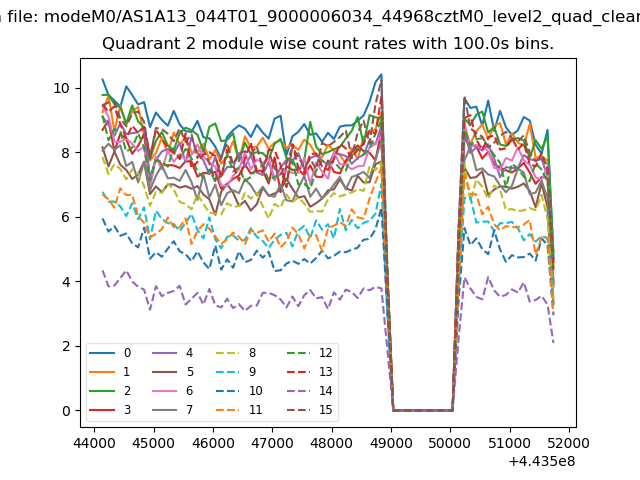
| Quadrant-wise count rates Data is divided into 100 sec bins |
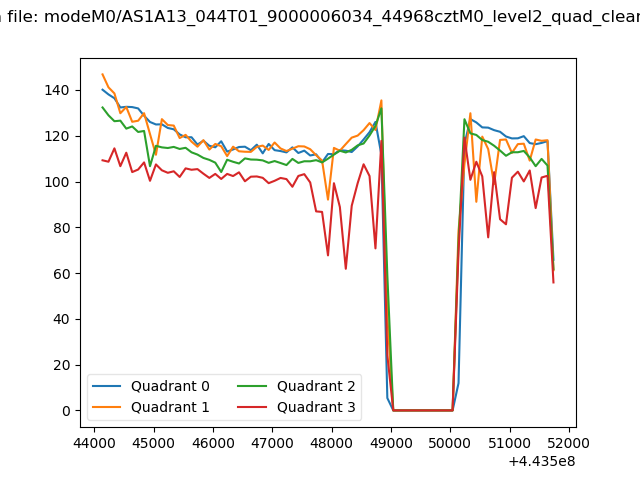 |
|
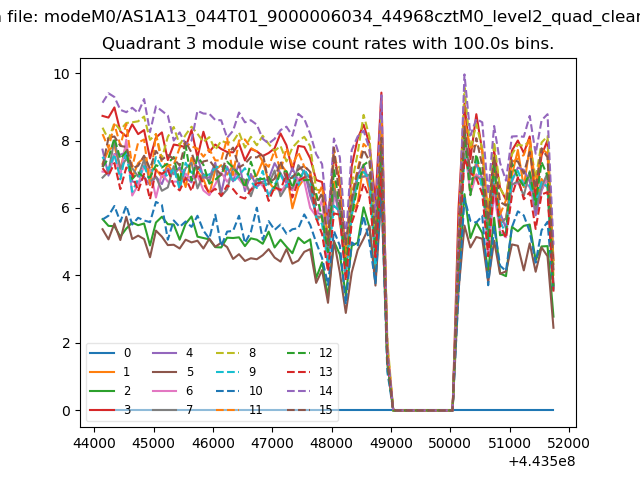
| Module-wise count rates for Quadrant A Data is divided into 100 sec bins |
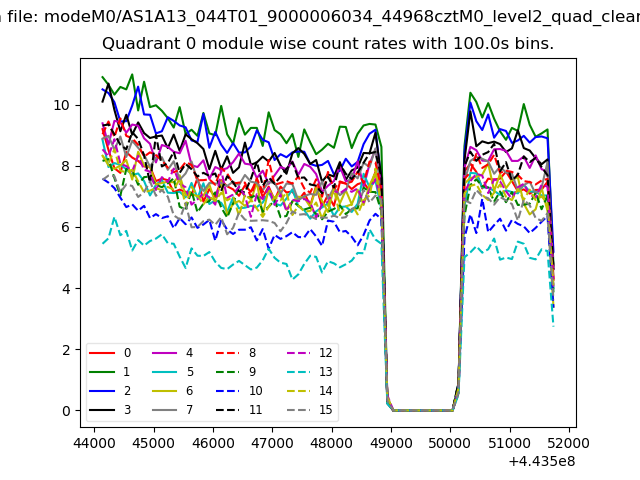 |
 |
| Module-wise count rates for Quadrant B Data is divided into 100 sec bins |
 |
 |
| Module-wise count rates for Quadrant C Data is divided into 100 sec bins |
 |
 |
| Module-wise count rates for Quadrant D Data is divided into 100 sec bins |
 |
 |
| Parameter | Plot |
|---|---|
| CZT HV Monitor | 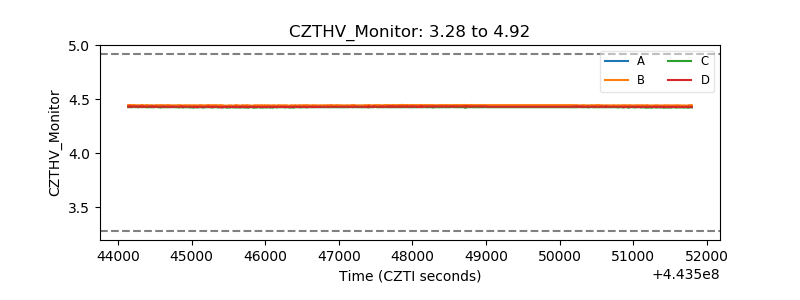 |
| D_VDD | 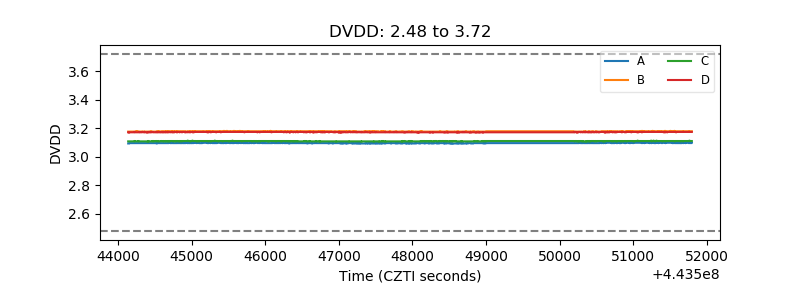 |
| Temperature 1 | 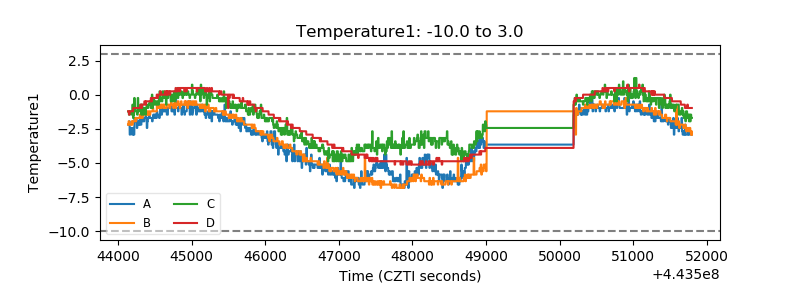 |
| Veto HV Monitor | 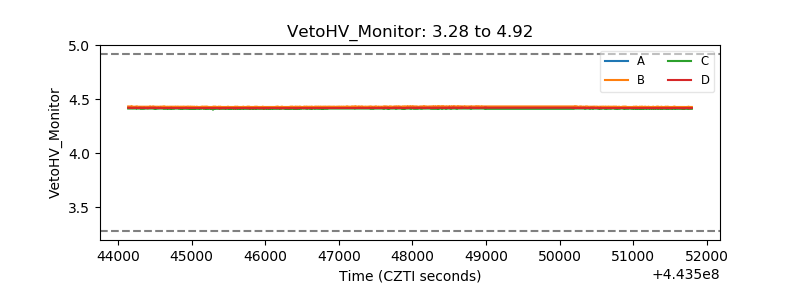 |
| Veto LLD | 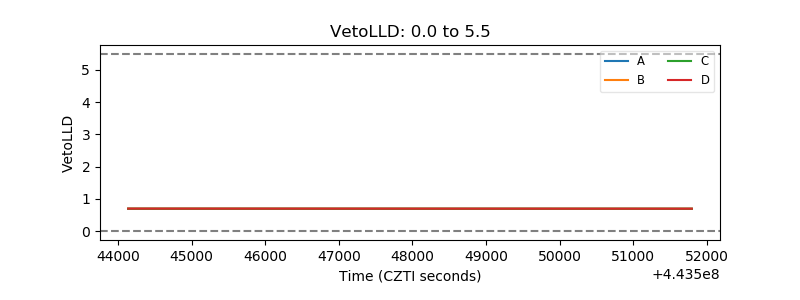 |
| Alpha Counter | 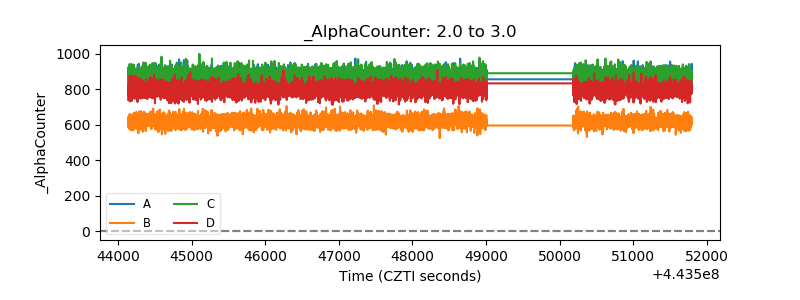 |
| _CPM_Rate | 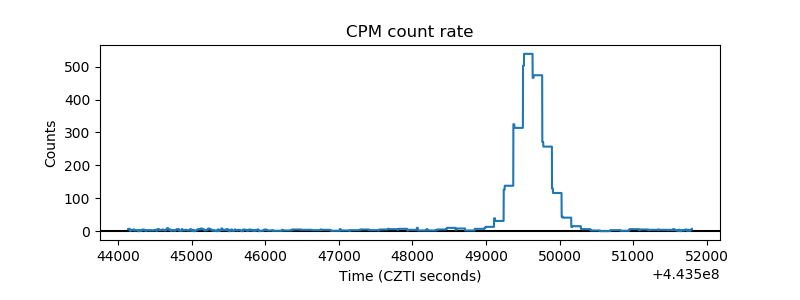 |
| CZT Counter | 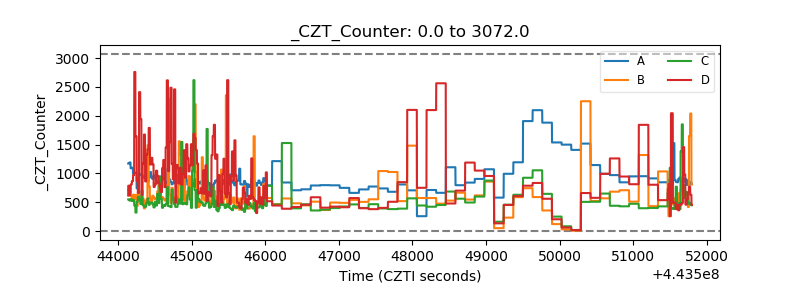 |
| +2.5 Volts monitor | 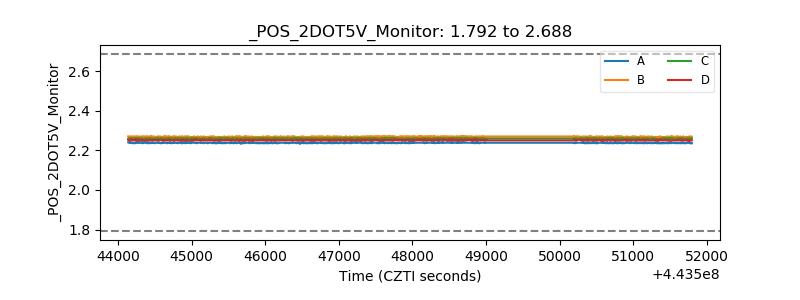 |
| +5 Volts monitor | 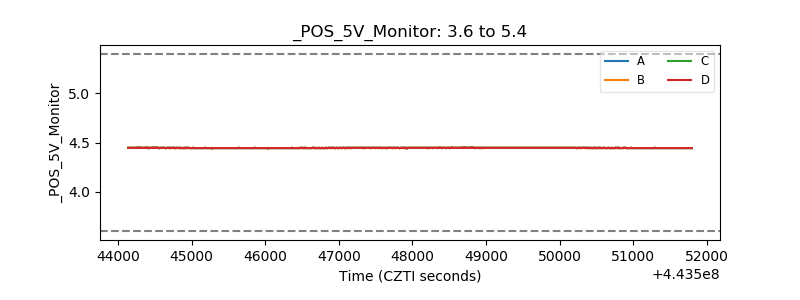 |
| _ROLL_ROT | 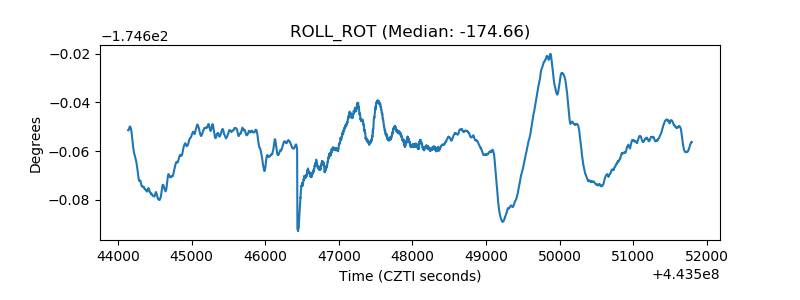 |
| _Roll_DEC | 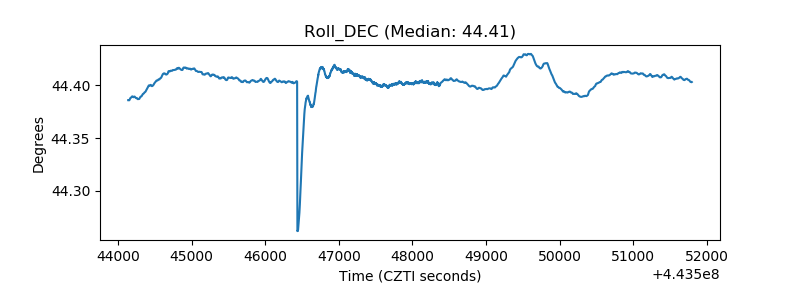 |
| _Roll_RA | 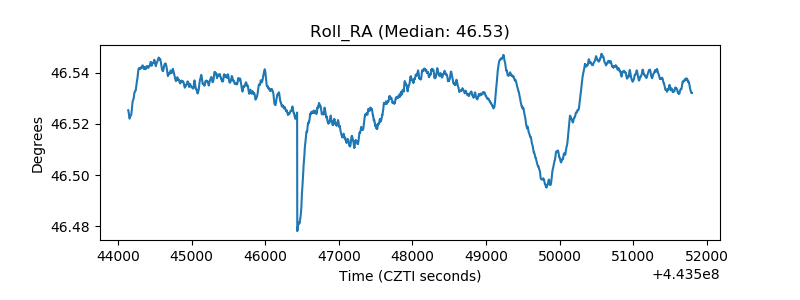 |
| Veto Counter | 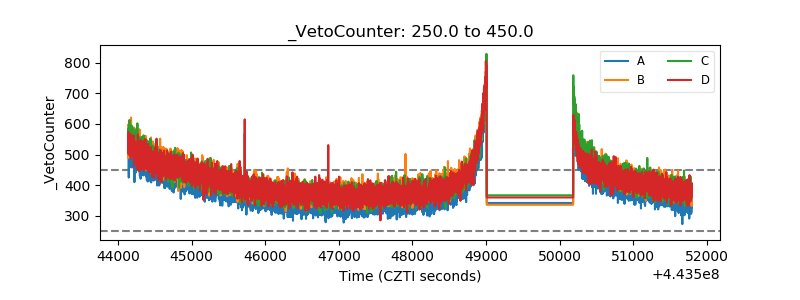 |