| Param | Original file | Final file |
|---|---|---|
| Filename | modeM0/AS1A13_044T01_9000006034_44969cztM0_level2.fits | modeM0/AS1A13_044T01_9000006034_44969cztM0_level2_quad_clean.evt |
| Size (bytes) | 583,989,120 | 110,675,520 |
| Size | 556.9 MB | 105.5 MB |
| Events in quadrant A | 5,888,838 | 753,407 |
| Events in quadrant B | 4,574,714 | 765,151 |
| Events in quadrant C | 3,351,103 | 748,319 |
| Events in quadrant D | 7,276,836 | 610,953 |
| Mode M9 | |||
|---|---|---|---|
| Quadrant | BADHDUFLAG | Total packets | Discarded packets |
| A | 0 | 9 | 0 |
| B | 0 | 10 | 0 |
| C | 0 | 10 | 0 |
| D | 0 | 10 | 0 |
| Mode M0 | |||
|---|---|---|---|
| Quadrant | BADHDUFLAG | Total packets | Discarded packets |
| A | 0 | 22329 | 2 |
| B | 0 | 18033 | 2 |
| C | 0 | 14730 | 2 |
| D | 0 | 26339 | 5 |
| Mode SS | |||
|---|---|---|---|
| Quadrant | BADHDUFLAG | Total packets | Discarded packets |
| A | 0 | 138 | 0 |
| B | 0 | 138 | 0 |
| C | 0 | 138 | 0 |
| D | 0 | 138 | 0 |
| Quadrant | Total seconds | Saturated seconds | Saturation percentage |
|---|---|---|---|
| A | 6789 | 289 | 4.256886% |
| B | 6789 | 336 | 4.949183% |
| C | 6789 | 76 | 1.119458% |
| D | 6788 | 1084 | 15.969358% |
Noise dominated data is calculated using 1-second bins in cleaned event files. If a bin has >2000 counts, and if more than 50% of those come from <1% of pixels, then it is considered to be noise-dominated and hence unusable.
| Quadrant | # 1 sec bins | Bins with >0 counts | Bins with >2000 counts | High rate bins dominated by noise | Noise dominated (total time) | Noise dominated (detector-on time) | Marked lightcurve |
|---|---|---|---|---|---|---|---|
| A | 7709 | 6791 | 20 | 20 | 0.26% | 0.29% | 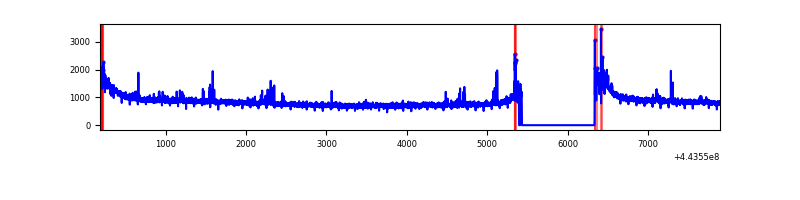 |
| B | 7709 | 6791 | 180 | 180 | 2.33% | 2.65% |  |
| C | 7709 | 6791 | 25 | 25 | 0.32% | 0.37% | 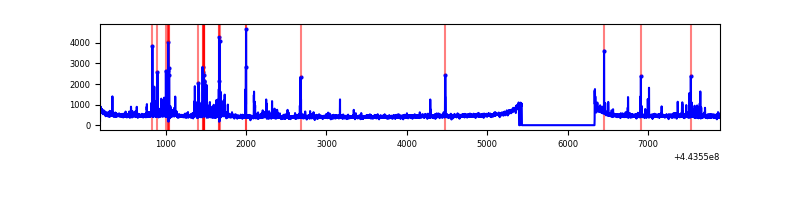 |
| D | 7708 | 6790 | 814 | 814 | 10.56% | 11.99% | 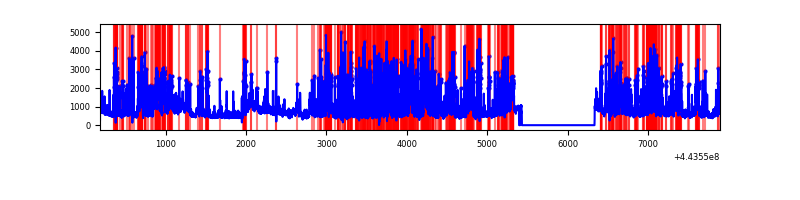 |
Top three noisy pixels from each quadrant. If the there are fewer than three noisy pixels in the level2.evt file, extra rows are filled as -1
| Pixel properties | Quadrant properties | ||||||
|---|---|---|---|---|---|---|---|
| Quadrant | DetID | PixID | Counts | Sigma | Mean | Median | Sigma |
| A | 10 | 83 | 2720396 | 16749.75 | 779 | 763 | 162.4 |
| A | 7 | 3 | 53731 | 326.22 | 779 | 763 | 162.4 |
| A | 13 | 248 | 30438 | 182.76 | 779 | 763 | 162.4 |
| B | 0 | 189 | 512846 | 3367.8 | 771 | 747 | 152.1 |
| B | 0 | 219 | 248462 | 1629.09 | 771 | 747 | 152.1 |
| B | 0 | 190 | 112826 | 737.08 | 771 | 747 | 152.1 |
| C | 12 | 2 | 165503 | 908.05 | 771 | 775 | 181.4 |
| C | 12 | 250 | 55583 | 302.13 | 771 | 775 | 181.4 |
| C | 14 | 254 | 49925 | 270.94 | 771 | 775 | 181.4 |
| D | 13 | 249 | 1535439 | 8425.68 | 732 | 710 | 182.1 |
| D | 12 | 233 | 649315 | 3560.85 | 732 | 710 | 182.1 |
| D | 13 | 171 | 594809 | 3261.61 | 732 | 710 | 182.1 |
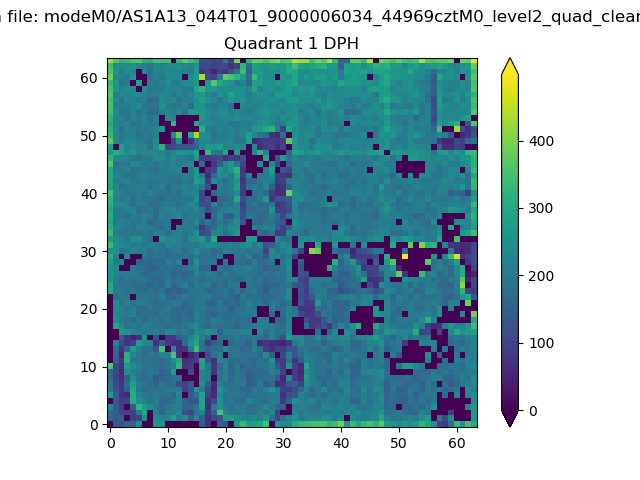
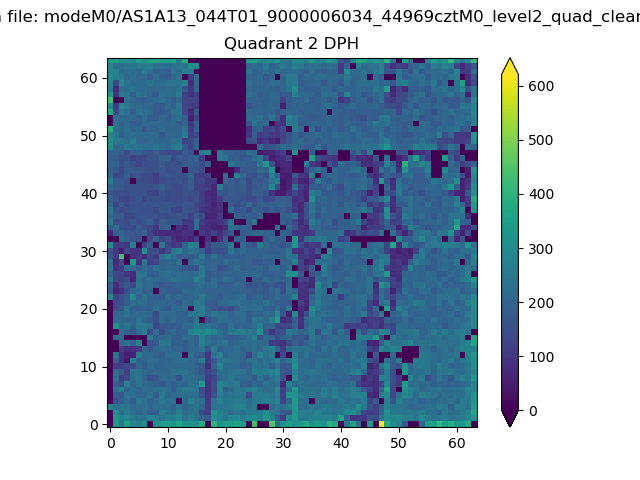
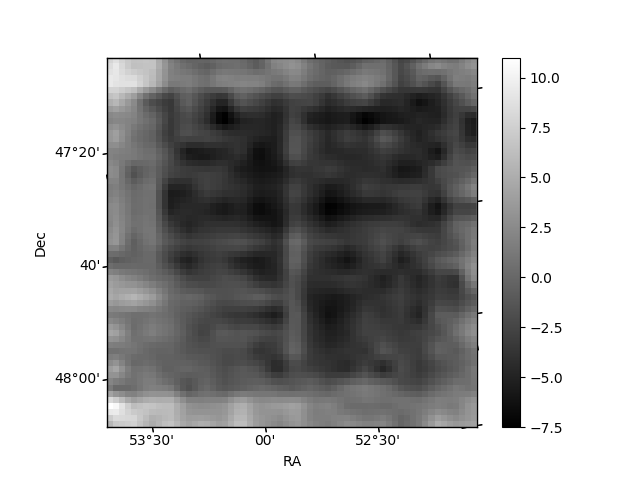
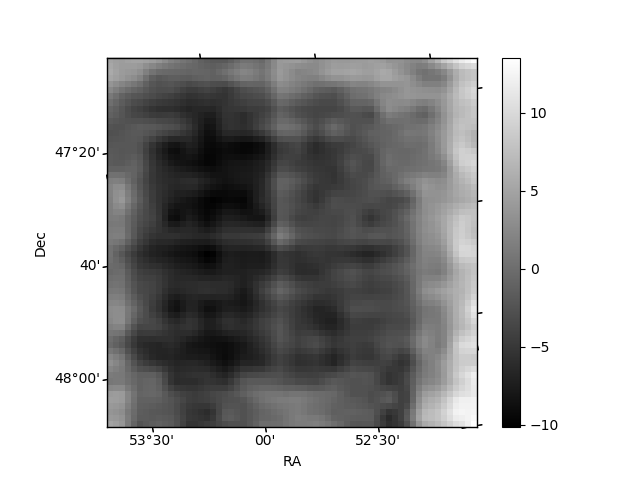
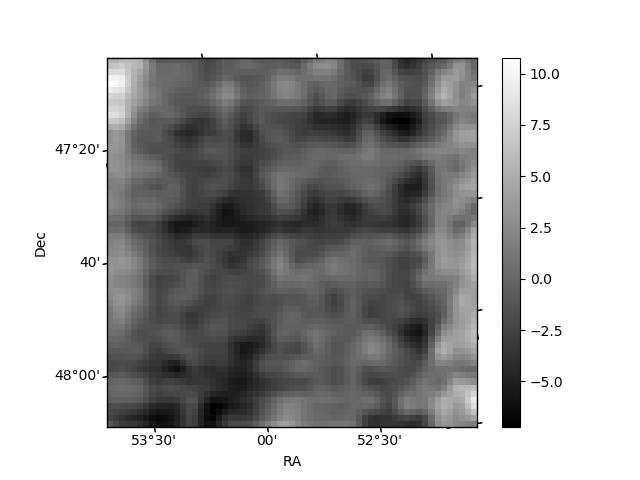
Histogram calculated using DETX and DETY for each event in the final _common_clean file
| Quadrant A | 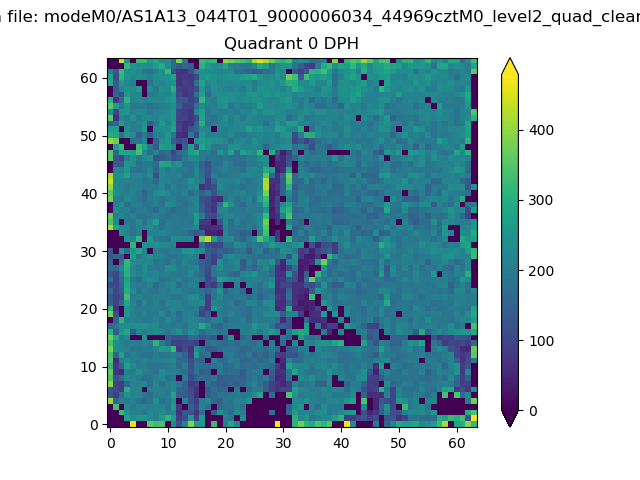 |
 |
Quadrant B |
|---|---|---|---|
| Quadrant D | 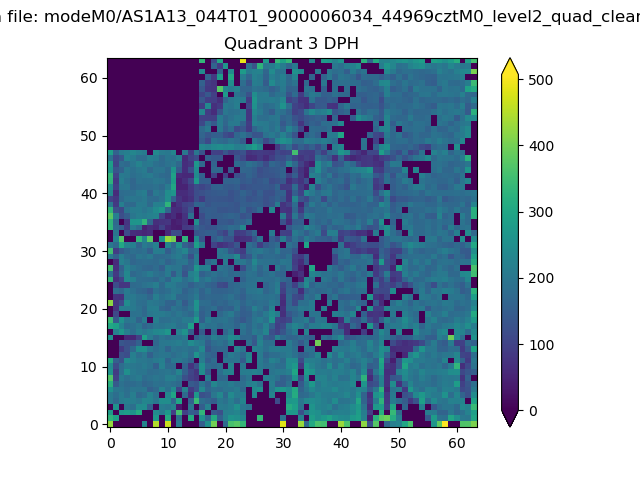 |
 |
Quadrant C |
| Plot type | Count rate plots | Images |
|---|---|---|
| Comparison with Poisson distribution Blue bars denote a histogram of data divided into 1 sec bins. Red curve is a Poisson curve with rate = median count rate of data. |
 |
 |
| Quadrant-wise count rates Data is divided into 100 sec bins |
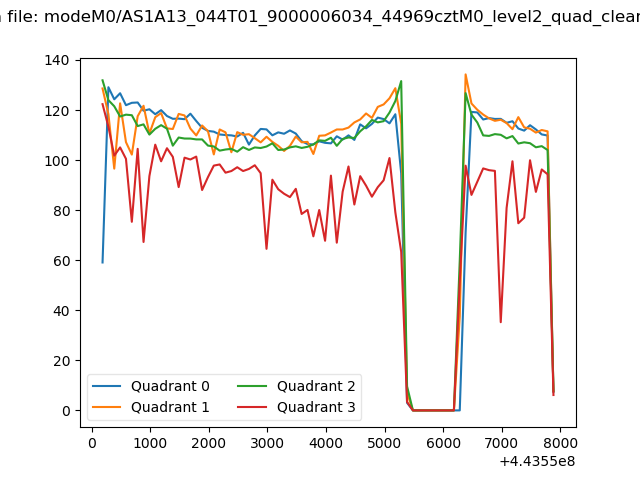 |
|
| Module-wise count rates for Quadrant A Data is divided into 100 sec bins |
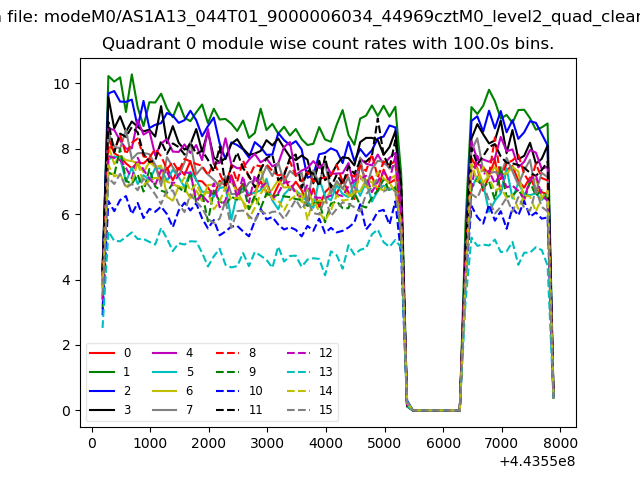 |
 |
| Module-wise count rates for Quadrant B Data is divided into 100 sec bins |
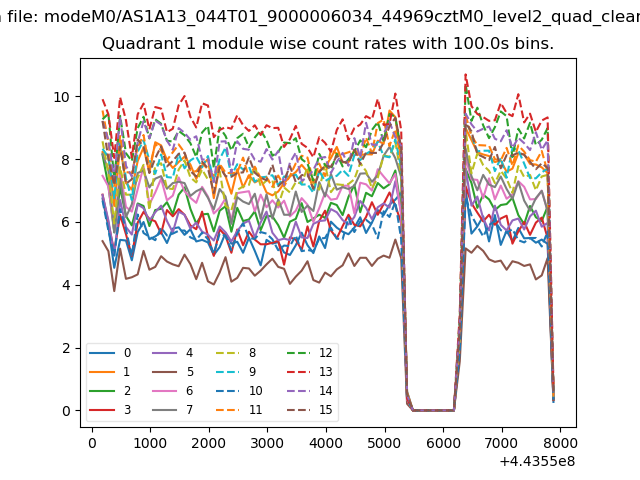 |
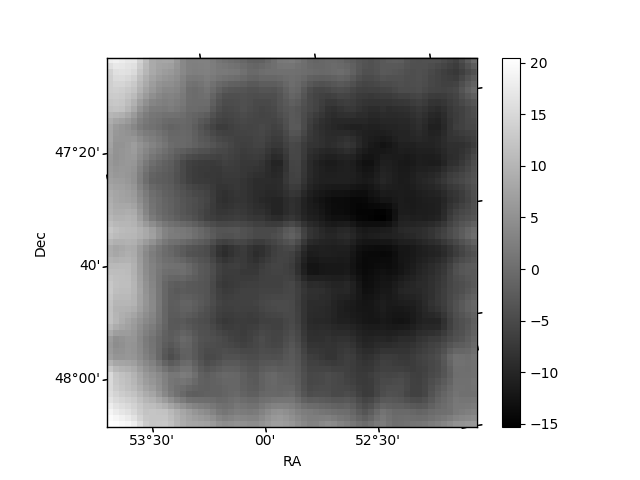 |
| Module-wise count rates for Quadrant C Data is divided into 100 sec bins |
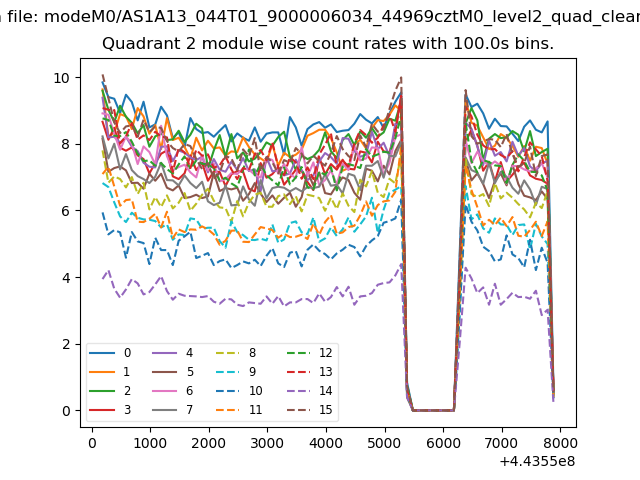 |
 |
| Module-wise count rates for Quadrant D Data is divided into 100 sec bins |
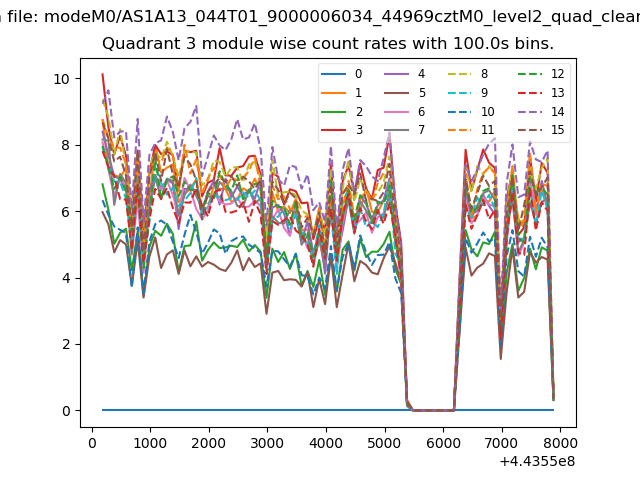 |
 |
| Parameter | Plot |
|---|---|
| CZT HV Monitor | 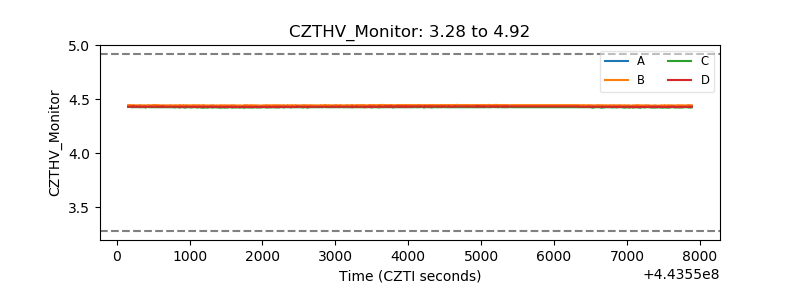 |
| D_VDD | 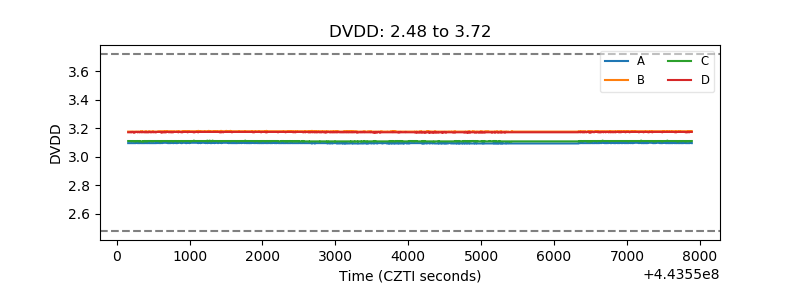 |
| Temperature 1 | 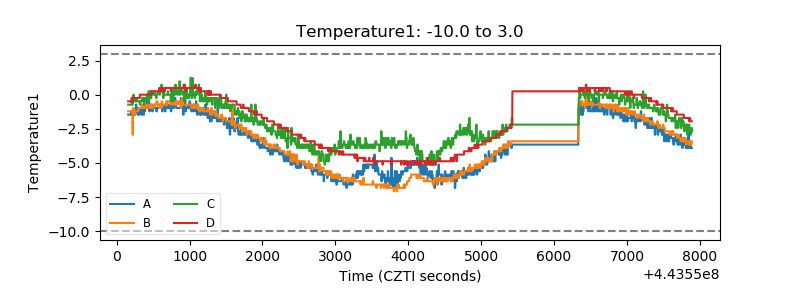 |
| Veto HV Monitor | 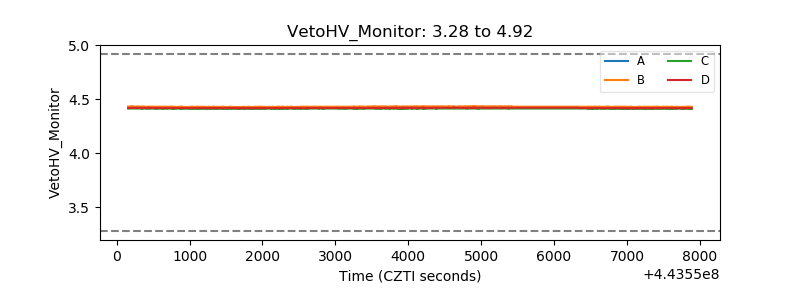 |
| Veto LLD | 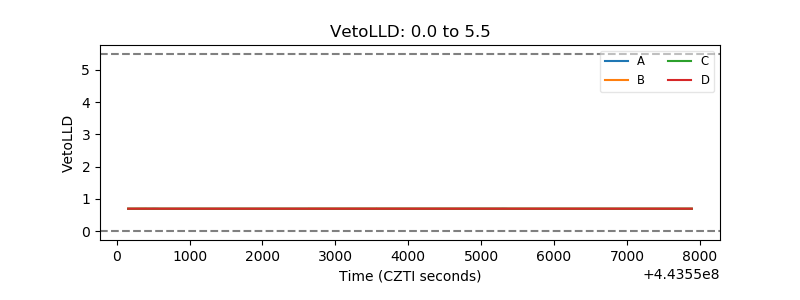 |
| Alpha Counter | 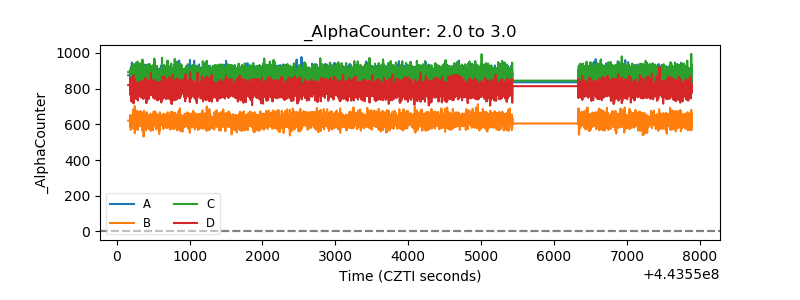 |
| _CPM_Rate | 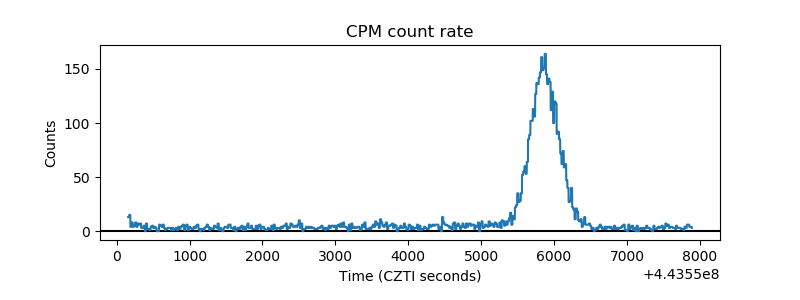 |
| CZT Counter | 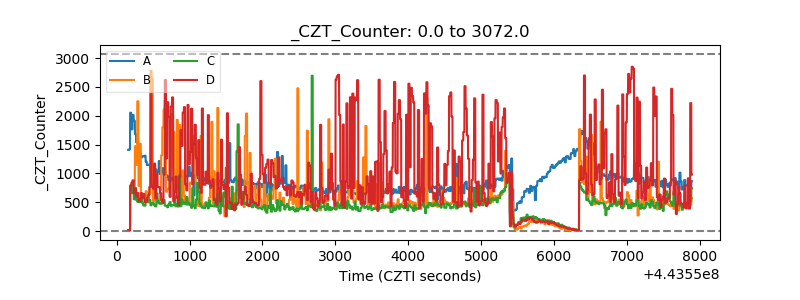 |
| +2.5 Volts monitor | 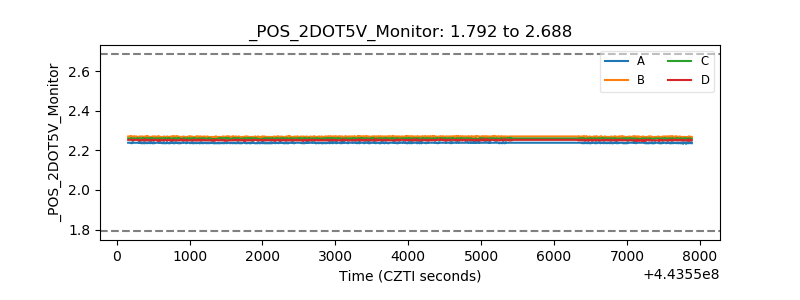 |
| +5 Volts monitor | 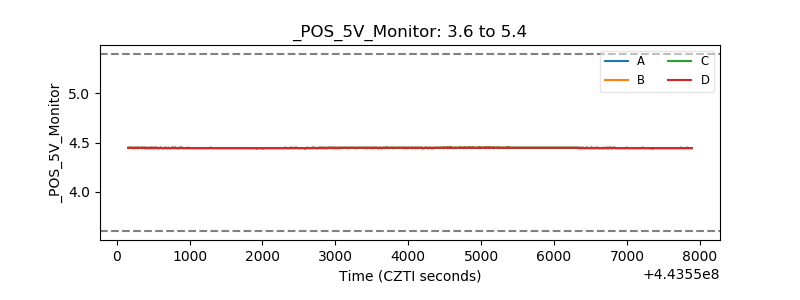 |
| _ROLL_ROT | 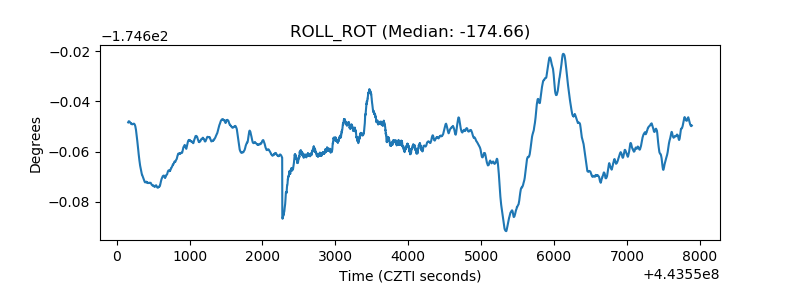 |
| _Roll_DEC | 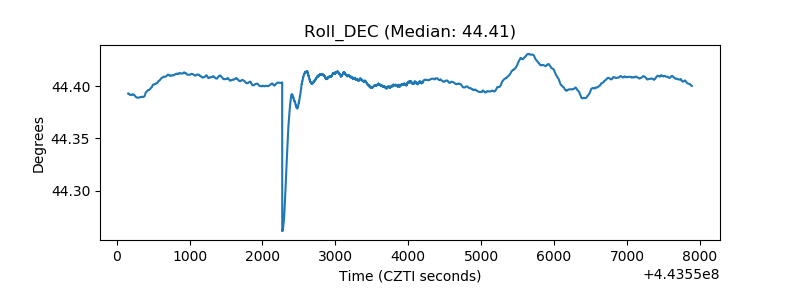 |
| _Roll_RA | 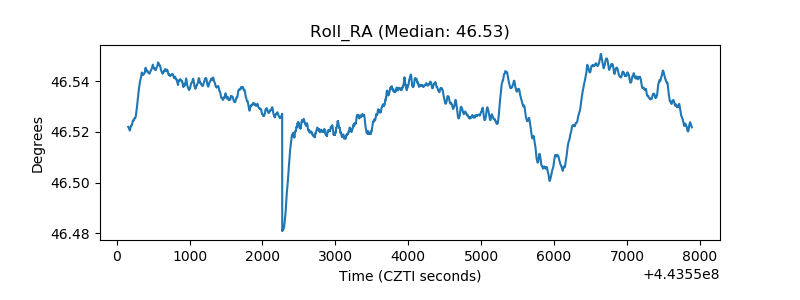 |
| Veto Counter | 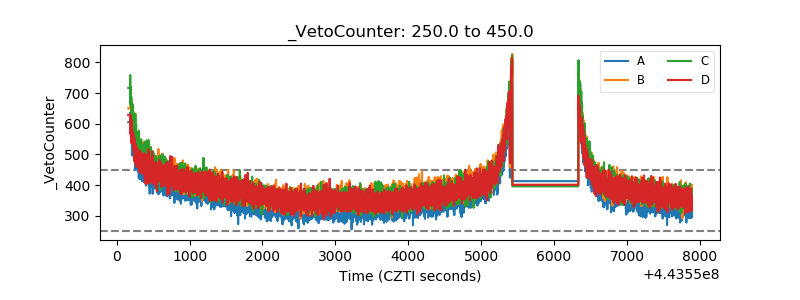 |