| Param | Original file | Final file |
|---|---|---|
| Filename | modeM0/AS1A13_044T01_9000006034_44971cztM0_level2.fits | modeM0/AS1A13_044T01_9000006034_44971cztM0_level2_quad_clean.evt |
| Size (bytes) | 666,331,200 | 125,527,680 |
| Size | 635.5 MB | 119.7 MB |
| Events in quadrant A | 6,476,061 | 856,338 |
| Events in quadrant B | 5,932,837 | 844,191 |
| Events in quadrant C | 3,889,622 | 839,723 |
| Events in quadrant D | 7,755,956 | 711,381 |
| Mode M9 | |||
|---|---|---|---|
| Quadrant | BADHDUFLAG | Total packets | Discarded packets |
| A | 0 | 1 | 0 |
| B | 0 | 2 | 0 |
| C | 0 | 2 | 0 |
| D | 0 | 2 | 0 |
| Mode M0 | |||
|---|---|---|---|
| Quadrant | BADHDUFLAG | Total packets | Discarded packets |
| A | 0 | 25257 | 1 |
| B | 0 | 23145 | 1 |
| C | 0 | 17207 | 1 |
| D | 0 | 28486 | 6 |
| Mode SS | |||
|---|---|---|---|
| Quadrant | BADHDUFLAG | Total packets | Discarded packets |
| A | 0 | 158 | 0 |
| B | 0 | 158 | 0 |
| C | 0 | 158 | 0 |
| D | 0 | 158 | 0 |
| Quadrant | Total seconds | Saturated seconds | Saturation percentage |
|---|---|---|---|
| A | 7892 | 176 | 2.230106% |
| B | 7892 | 547 | 6.931069% |
| C | 7892 | 65 | 0.823619% |
| D | 7891 | 908 | 11.506780% |
Noise dominated data is calculated using 1-second bins in cleaned event files. If a bin has >2000 counts, and if more than 50% of those come from <1% of pixels, then it is considered to be noise-dominated and hence unusable.
| Quadrant | # 1 sec bins | Bins with >0 counts | Bins with >2000 counts | High rate bins dominated by noise | Noise dominated (total time) | Noise dominated (detector-on time) | Marked lightcurve |
|---|---|---|---|---|---|---|---|
| A | 7892 | 7892 | 32 | 32 | 0.41% | 0.41% | 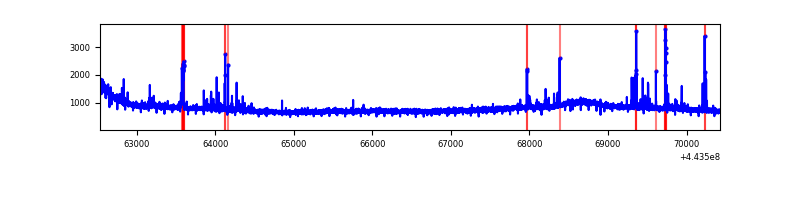 |
| B | 7892 | 7891 | 239 | 239 | 3.03% | 3.03% | 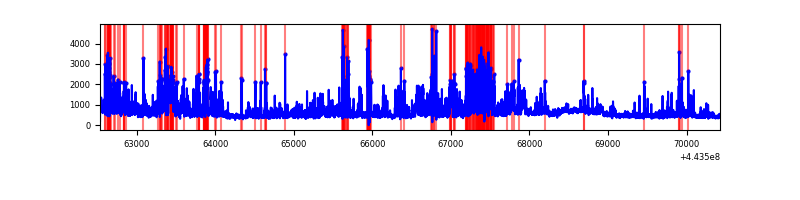 |
| C | 7892 | 7892 | 35 | 35 | 0.44% | 0.44% | 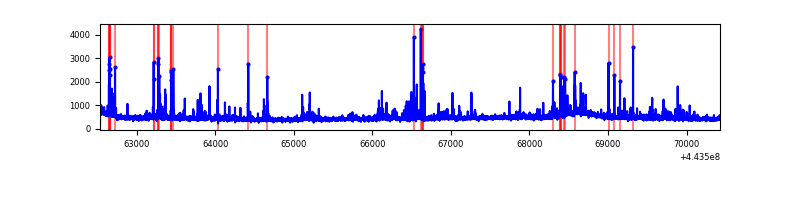 |
| D | 7891 | 7891 | 656 | 656 | 8.31% | 8.31% | 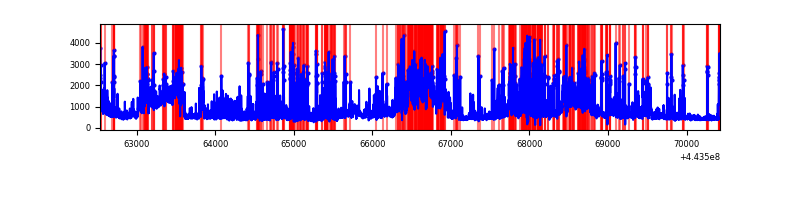 |
Top three noisy pixels from each quadrant. If the there are fewer than three noisy pixels in the level2.evt file, extra rows are filled as -1
| Pixel properties | Quadrant properties | ||||||
|---|---|---|---|---|---|---|---|
| Quadrant | DetID | PixID | Counts | Sigma | Mean | Median | Sigma |
| A | 10 | 83 | 2794309 | 15131.1 | 891 | 871 | 184.6 |
| A | 13 | 248 | 169031 | 910.86 | 891 | 871 | 184.6 |
| A | 0 | 243 | 33475 | 176.6 | 891 | 871 | 184.6 |
| B | 0 | 219 | 1202924 | 7043.75 | 876 | 851 | 170.7 |
| B | 0 | 189 | 676391 | 3958.44 | 876 | 851 | 170.7 |
| B | 0 | 168 | 103824 | 603.39 | 876 | 851 | 170.7 |
| C | 12 | 250 | 145768 | 701.22 | 879 | 882 | 206.6 |
| C | 12 | 2 | 90157 | 432.07 | 879 | 882 | 206.6 |
| C | 14 | 254 | 59987 | 286.06 | 879 | 882 | 206.6 |
| D | 13 | 249 | 1016635 | 4788.26 | 845 | 818 | 212.1 |
| D | 1 | 47 | 799179 | 3763.24 | 845 | 818 | 212.1 |
| D | 1 | 52 | 709202 | 3339.11 | 845 | 818 | 212.1 |
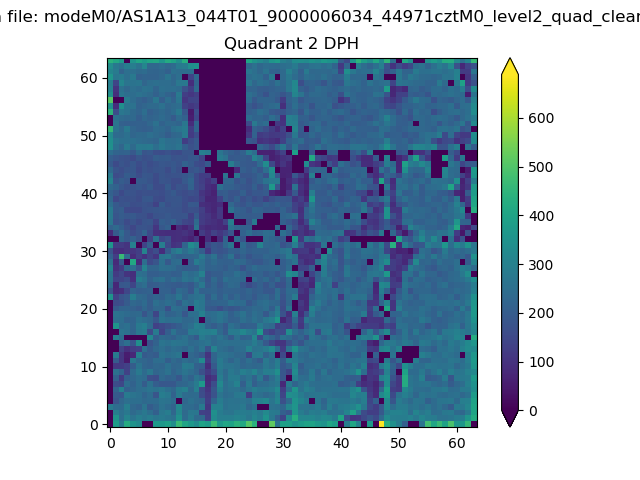
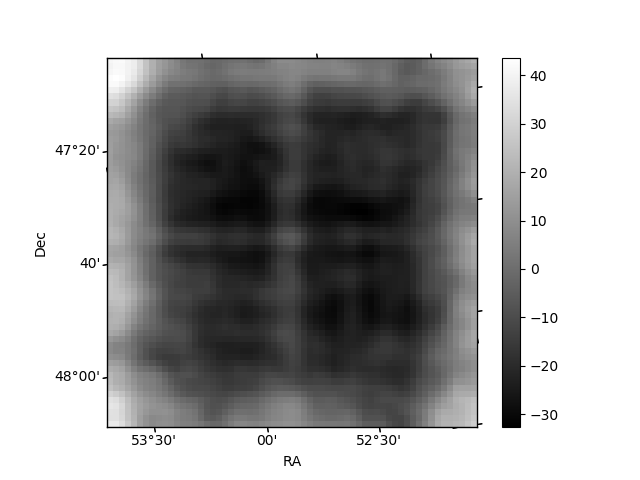
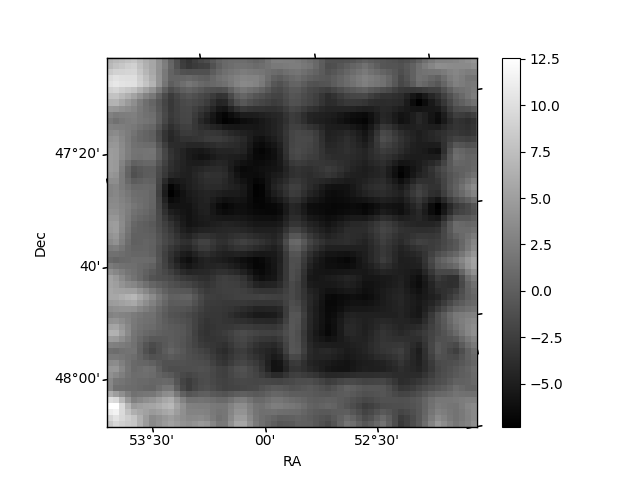
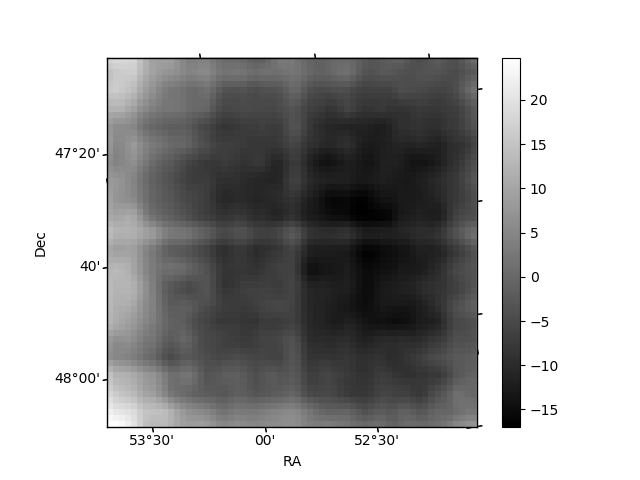
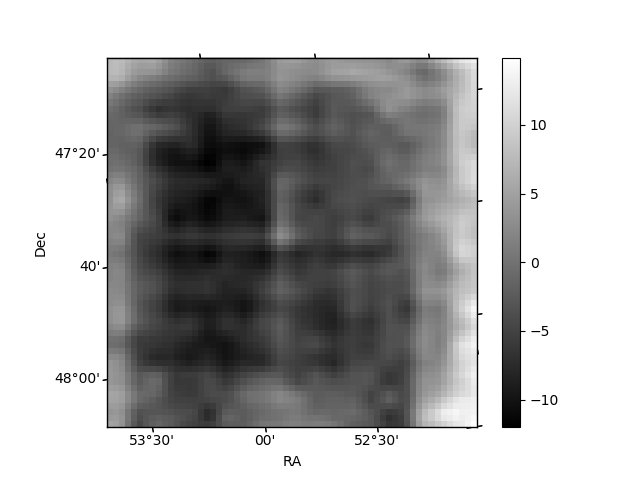
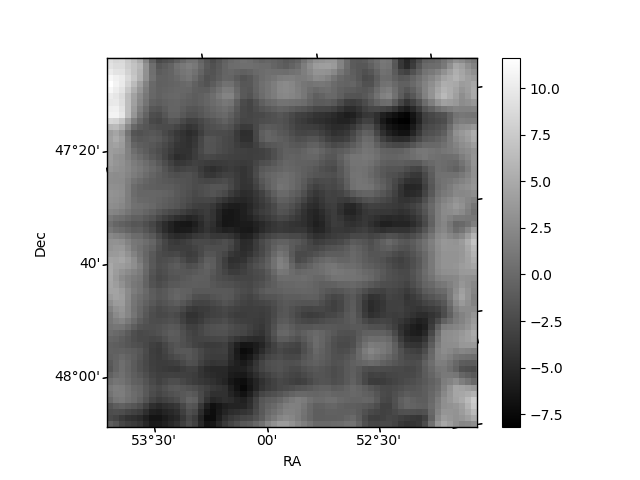
Histogram calculated using DETX and DETY for each event in the final _common_clean file
| Quadrant A | 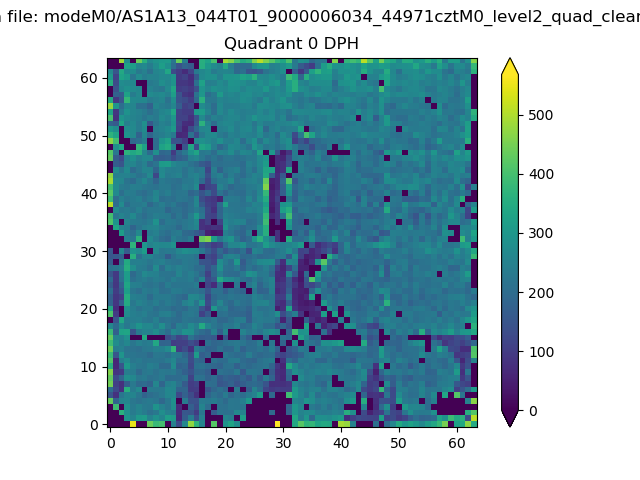 |
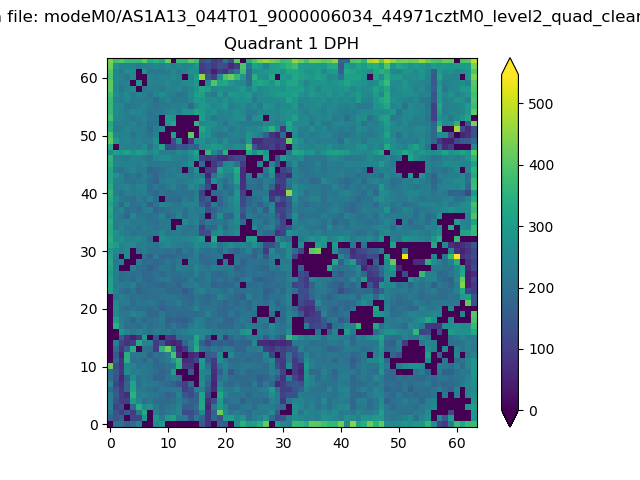 |
Quadrant B |
|---|---|---|---|
| Quadrant D | 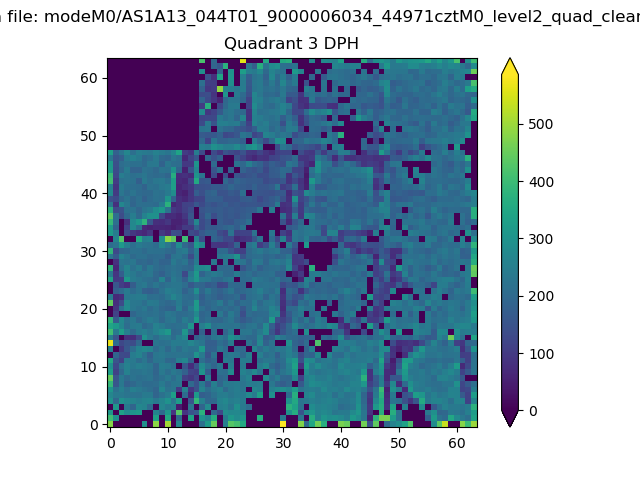 |
 |
Quadrant C |
| Plot type | Count rate plots | Images |
|---|---|---|
| Comparison with Poisson distribution Blue bars denote a histogram of data divided into 1 sec bins. Red curve is a Poisson curve with rate = median count rate of data. |
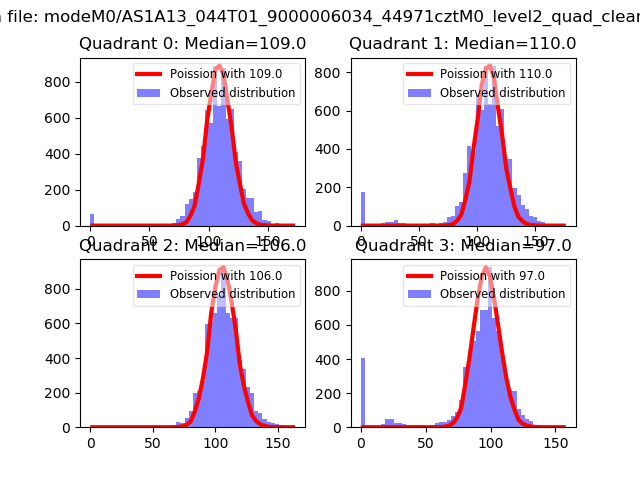 |
 |
| Quadrant-wise count rates Data is divided into 100 sec bins |
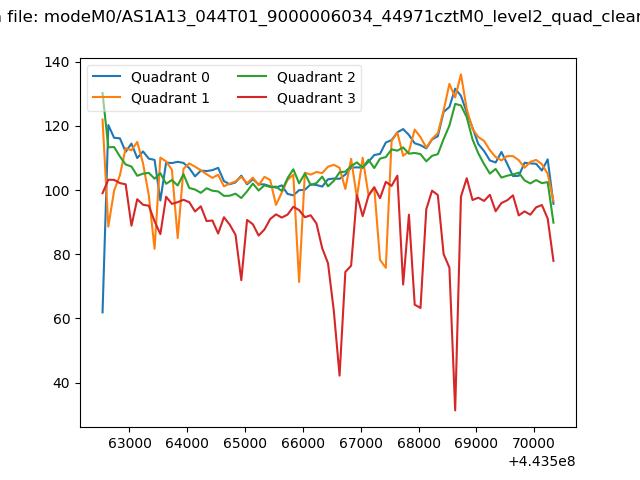 |
|
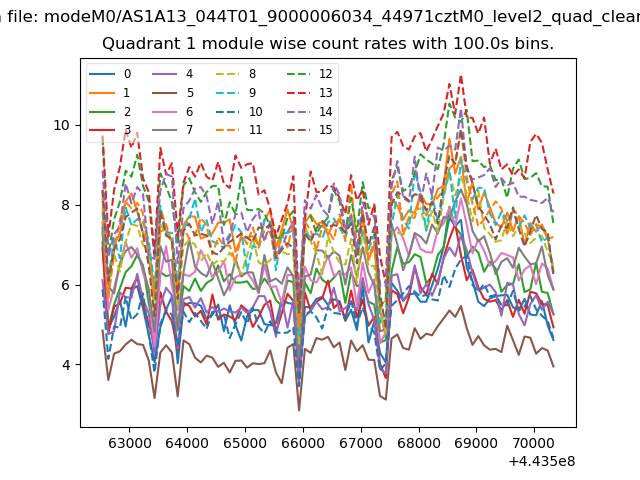
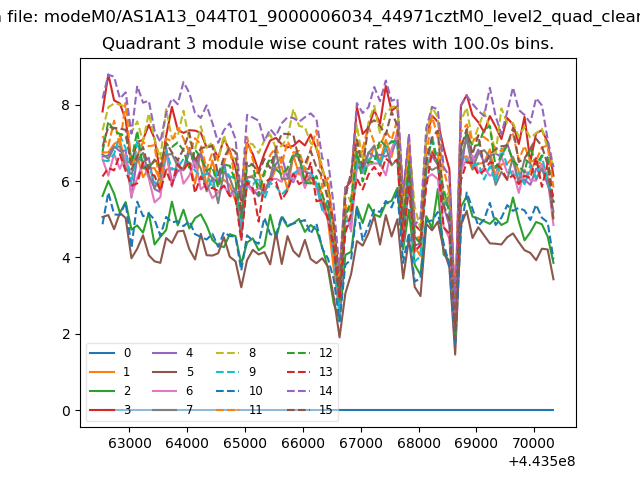
| Module-wise count rates for Quadrant A Data is divided into 100 sec bins |
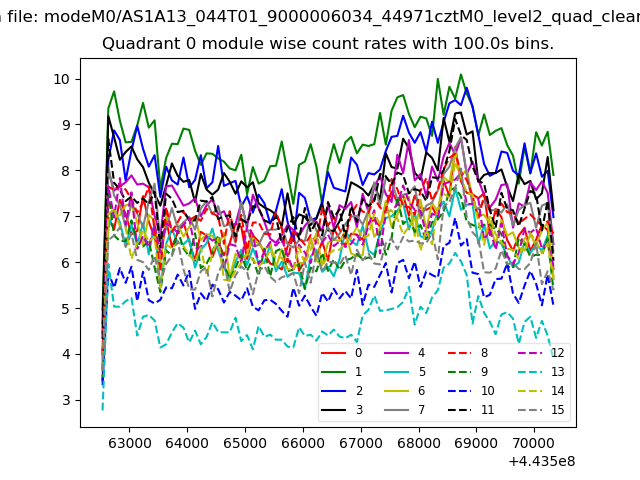 |
 |
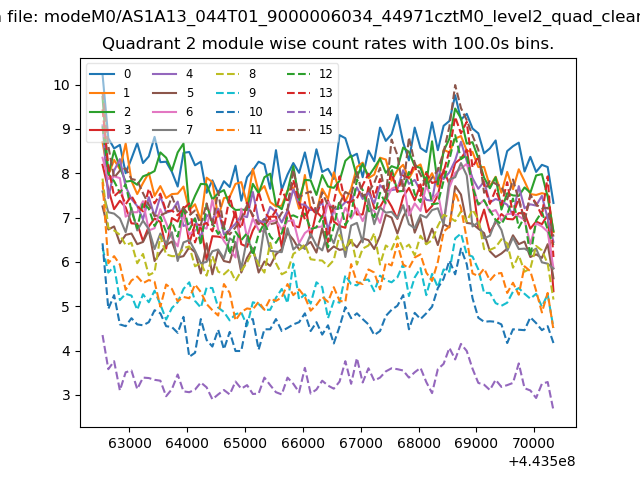
| Module-wise count rates for Quadrant B Data is divided into 100 sec bins |
 |
 |
| Module-wise count rates for Quadrant C Data is divided into 100 sec bins |
 |
 |
| Module-wise count rates for Quadrant D Data is divided into 100 sec bins |
 |
 |
| Parameter | Plot |
|---|---|
| CZT HV Monitor | 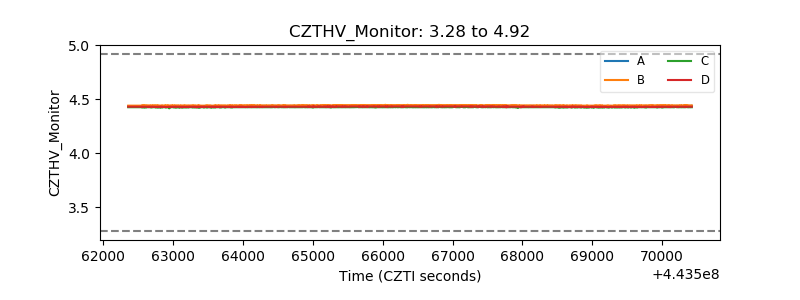 |
| D_VDD | 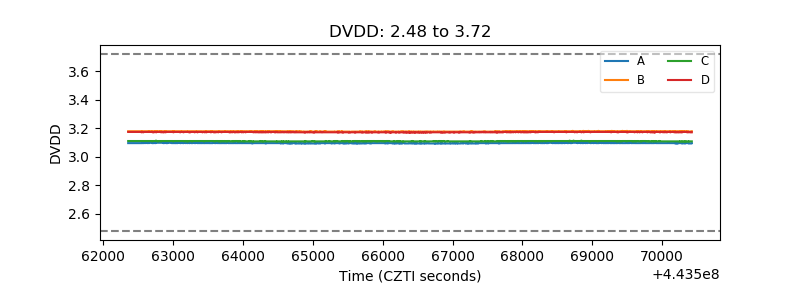 |
| Temperature 1 | 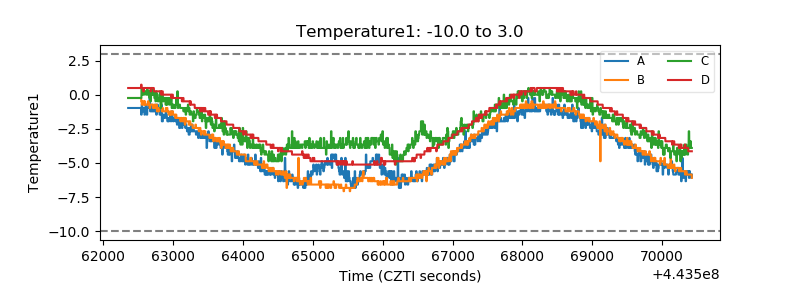 |
| Veto HV Monitor | 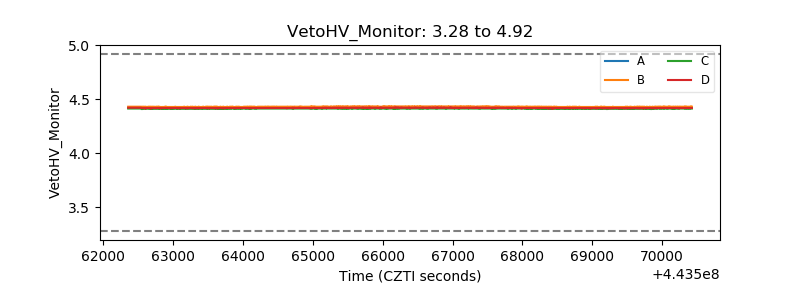 |
| Veto LLD | 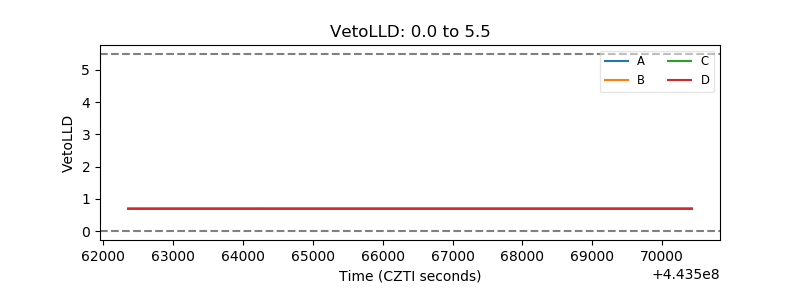 |
| Alpha Counter |  |
| _CPM_Rate | 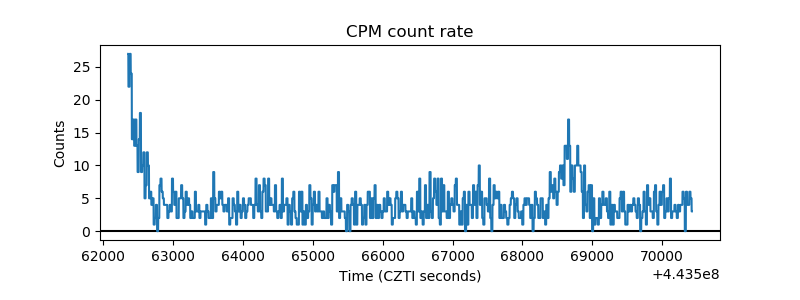 |
| CZT Counter | 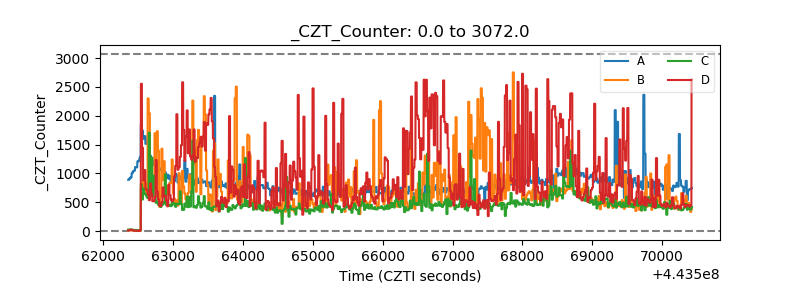 |
| +2.5 Volts monitor | 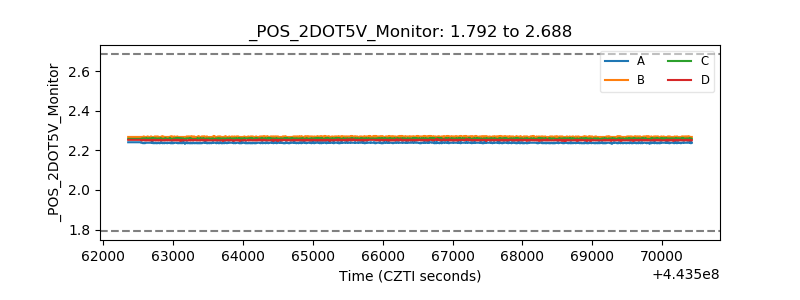 |
| +5 Volts monitor |  |
| _ROLL_ROT | 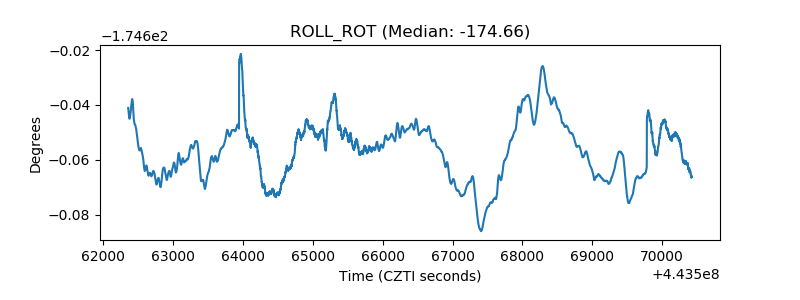 |
| _Roll_DEC | 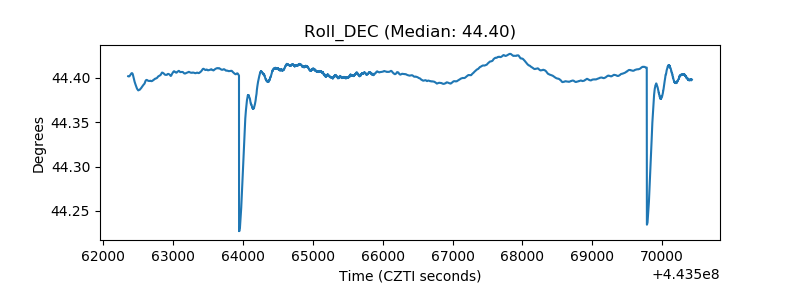 |
| _Roll_RA | 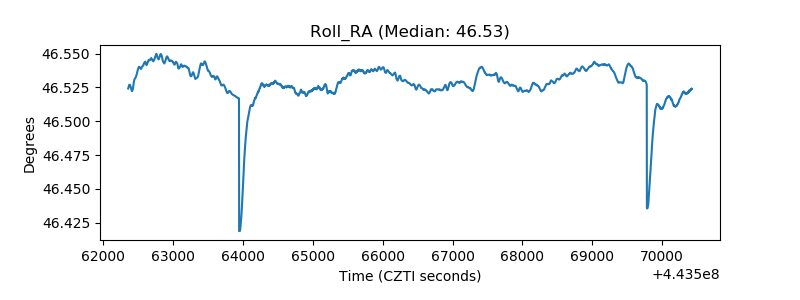 |
| Veto Counter | 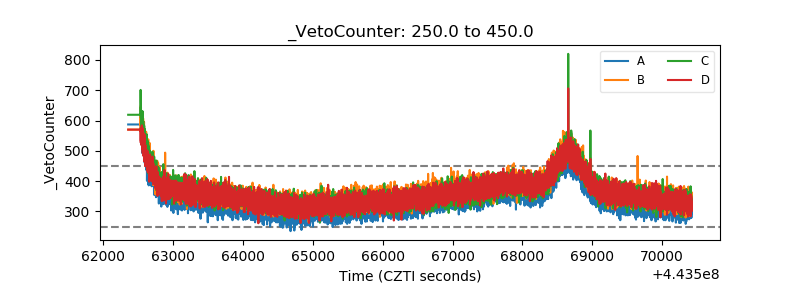 |