| Param | Original file | Final file |
|---|---|---|
| Filename | modeM0/AS1A13_044T01_9000006034_44972cztM0_level2.fits | modeM0/AS1A13_044T01_9000006034_44972cztM0_level2_quad_clean.evt |
| Size (bytes) | 613,177,920 | 127,342,080 |
| Size | 584.8 MB | 121.4 MB |
| Events in quadrant A | 6,771,994 | 832,644 |
| Events in quadrant B | 4,866,466 | 868,627 |
| Events in quadrant C | 3,736,750 | 842,545 |
| Events in quadrant D | 6,702,352 | 755,255 |
| Mode M0 | |||
|---|---|---|---|
| Quadrant | BADHDUFLAG | Total packets | Discarded packets |
| A | 0 | 26268 | 0 |
| B | 0 | 20016 | 0 |
| C | 0 | 16880 | 0 |
| D | 0 | 25424 | 0 |
| Mode SS | |||
|---|---|---|---|
| Quadrant | BADHDUFLAG | Total packets | Discarded packets |
| A | 0 | 160 | 0 |
| B | 0 | 160 | 0 |
| C | 0 | 160 | 0 |
| D | 0 | 160 | 0 |
| Quadrant | Total seconds | Saturated seconds | Saturation percentage |
|---|---|---|---|
| A | 8006 | 374 | 4.671496% |
| B | 8006 | 224 | 2.797902% |
| C | 8006 | 25 | 0.312266% |
| D | 8007 | 424 | 5.295367% |
Noise dominated data is calculated using 1-second bins in cleaned event files. If a bin has >2000 counts, and if more than 50% of those come from <1% of pixels, then it is considered to be noise-dominated and hence unusable.
| Quadrant | # 1 sec bins | Bins with >0 counts | Bins with >2000 counts | High rate bins dominated by noise | Noise dominated (total time) | Noise dominated (detector-on time) | Marked lightcurve |
|---|---|---|---|---|---|---|---|
| A | 8006 | 8006 | 167 | 167 | 2.09% | 2.09% | 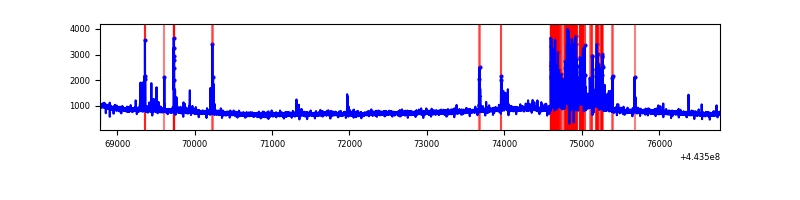 |
| B | 8006 | 8006 | 133 | 133 | 1.66% | 1.66% | 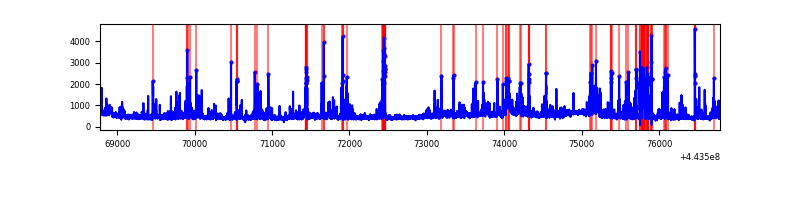 |
| C | 8006 | 8006 | 16 | 16 | 0.20% | 0.20% | 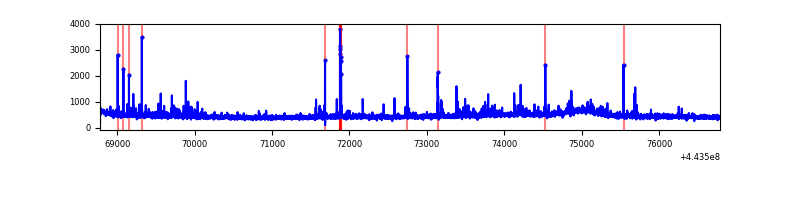 |
| D | 8007 | 8007 | 363 | 363 | 4.53% | 4.53% | 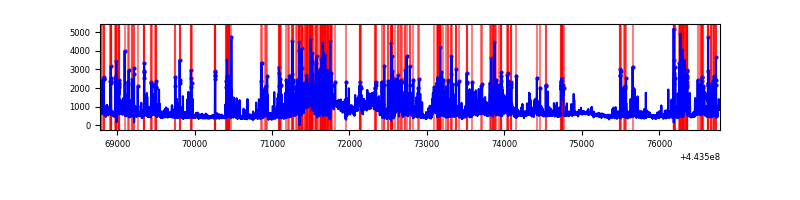 |
Top three noisy pixels from each quadrant. If the there are fewer than three noisy pixels in the level2.evt file, extra rows are filled as -1
| Pixel properties | Quadrant properties | ||||||
|---|---|---|---|---|---|---|---|
| Quadrant | DetID | PixID | Counts | Sigma | Mean | Median | Sigma |
| A | 10 | 83 | 2655906 | 14531.03 | 876 | 857 | 182.7 |
| A | 13 | 248 | 680087 | 3717.41 | 876 | 857 | 182.7 |
| A | 7 | 3 | 21269 | 111.71 | 876 | 857 | 182.7 |
| B | 0 | 189 | 542774 | 3099.34 | 889 | 860 | 174.8 |
| B | 0 | 219 | 194575 | 1107.91 | 889 | 860 | 174.8 |
| B | 4 | 222 | 142265 | 808.73 | 889 | 860 | 174.8 |
| C | 3 | 233 | 122380 | 586.25 | 882 | 885 | 207.2 |
| C | 12 | 250 | 103266 | 494.02 | 882 | 885 | 207.2 |
| C | 12 | 2 | 35652 | 167.76 | 882 | 885 | 207.2 |
| D | 13 | 249 | 810673 | 3711.73 | 867 | 839 | 218.2 |
| D | 13 | 187 | 719953 | 3295.93 | 867 | 839 | 218.2 |
| D | 2 | 249 | 262263 | 1198.19 | 867 | 839 | 218.2 |
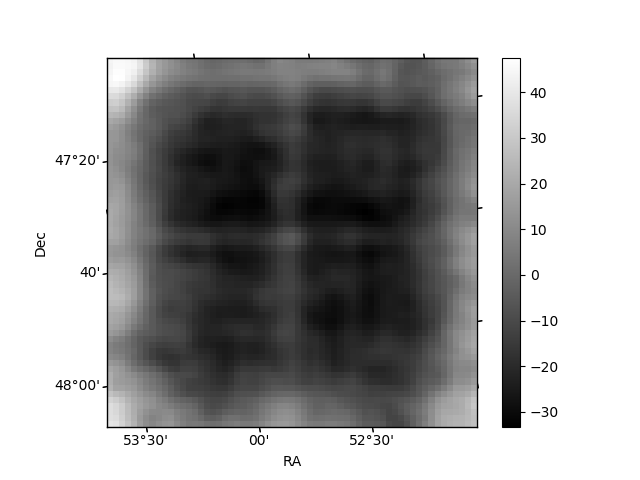
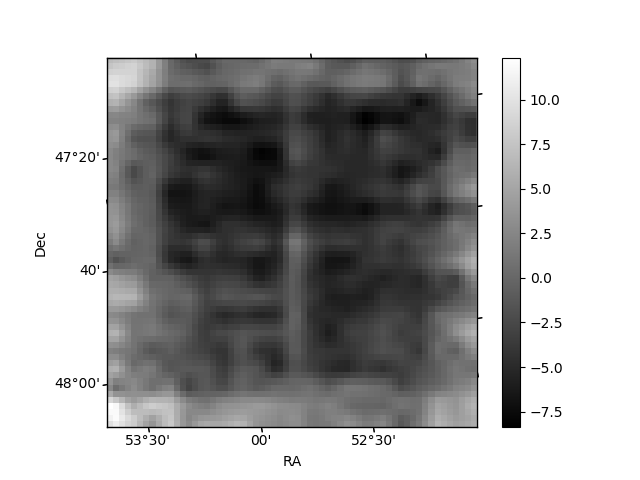
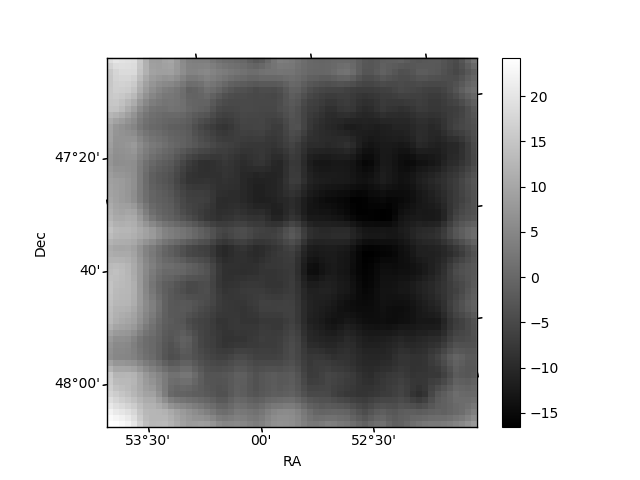
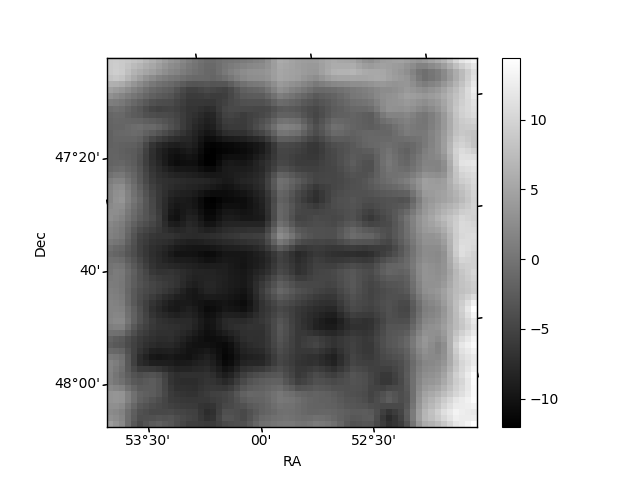
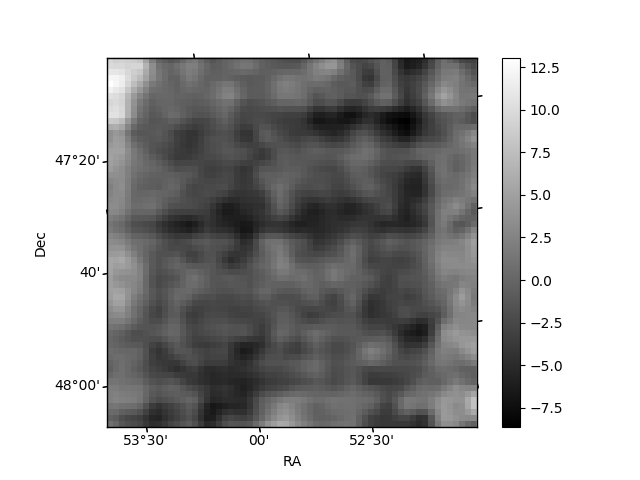
Histogram calculated using DETX and DETY for each event in the final _common_clean file
| Quadrant A | 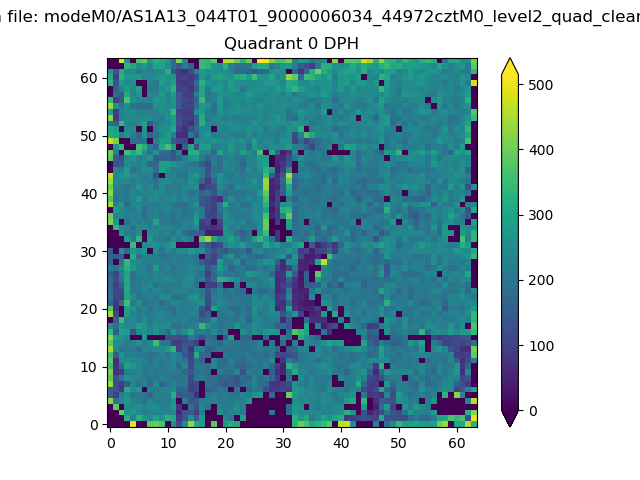 |
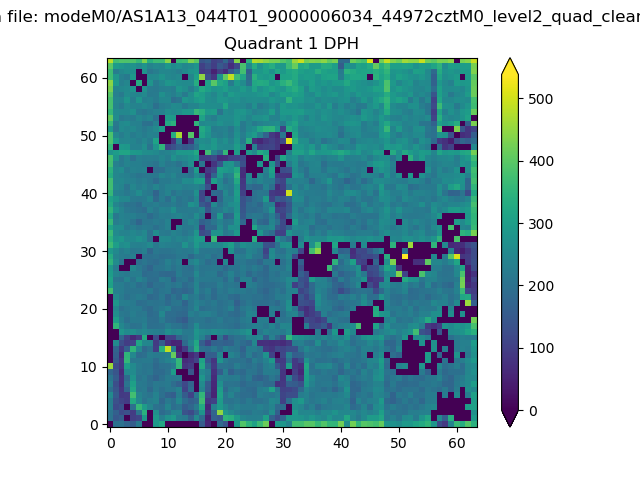 |
Quadrant B |
|---|---|---|---|
| Quadrant D | 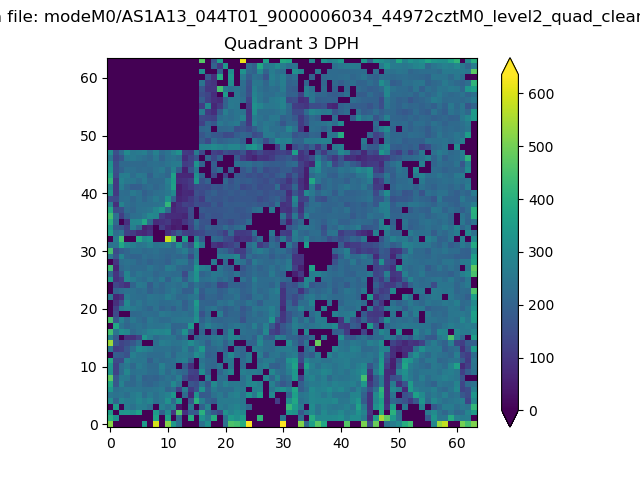 |
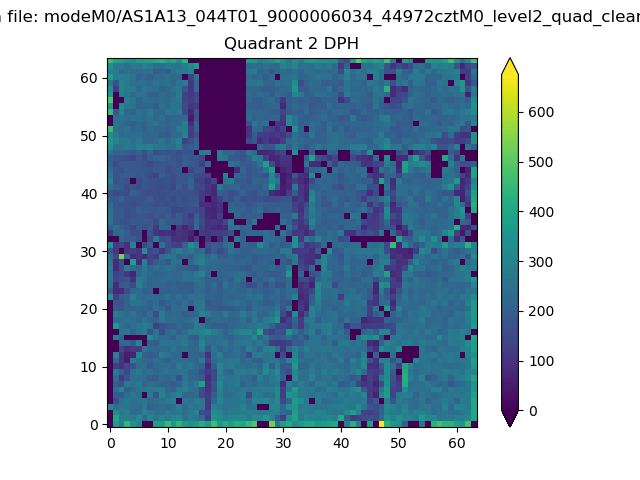 |
Quadrant C |
| Plot type | Count rate plots | Images |
|---|---|---|
| Comparison with Poisson distribution Blue bars denote a histogram of data divided into 1 sec bins. Red curve is a Poisson curve with rate = median count rate of data. |
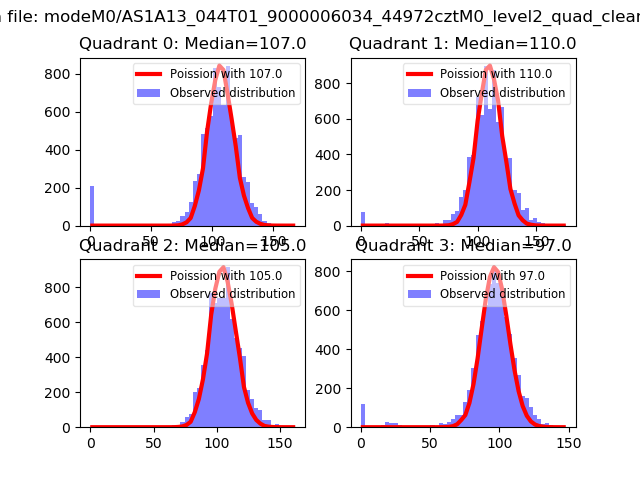 |
 |
| Quadrant-wise count rates Data is divided into 100 sec bins |
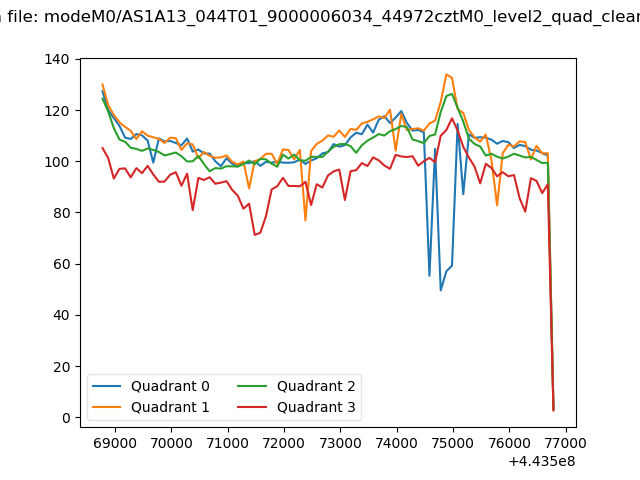 |
|
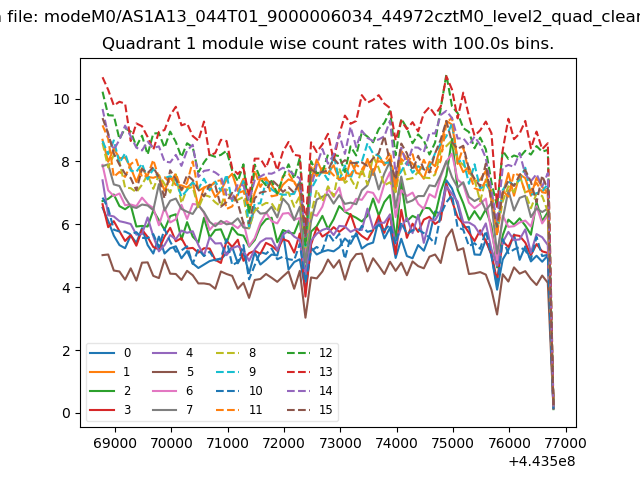
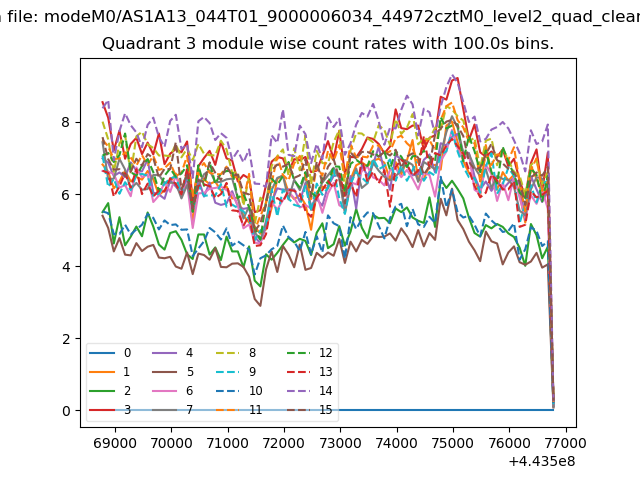
| Module-wise count rates for Quadrant A Data is divided into 100 sec bins |
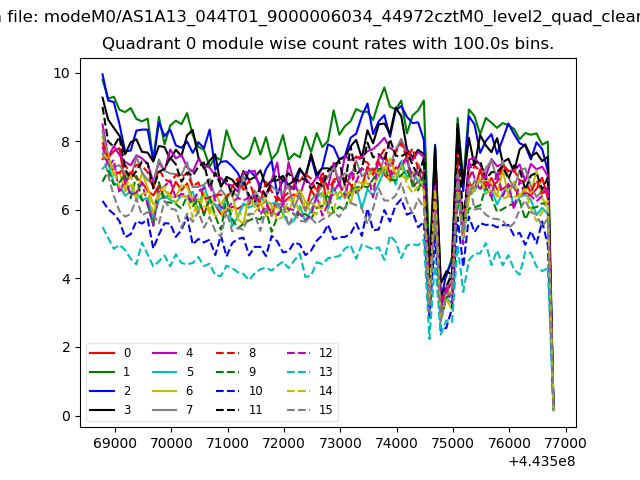 |
 |
| Module-wise count rates for Quadrant B Data is divided into 100 sec bins |
 |
 |
| Module-wise count rates for Quadrant C Data is divided into 100 sec bins |
 |
 |
| Module-wise count rates for Quadrant D Data is divided into 100 sec bins |
 |
 |
| Parameter | Plot |
|---|---|
| CZT HV Monitor | 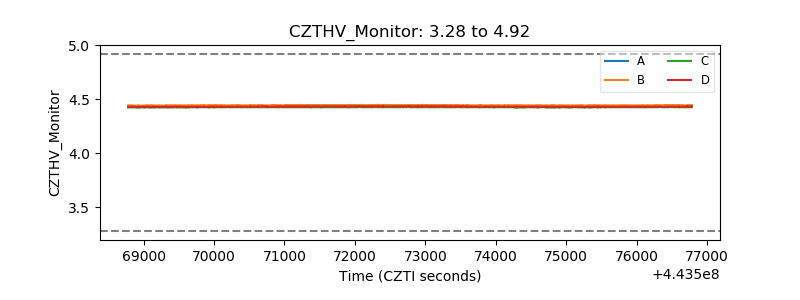 |
| D_VDD | 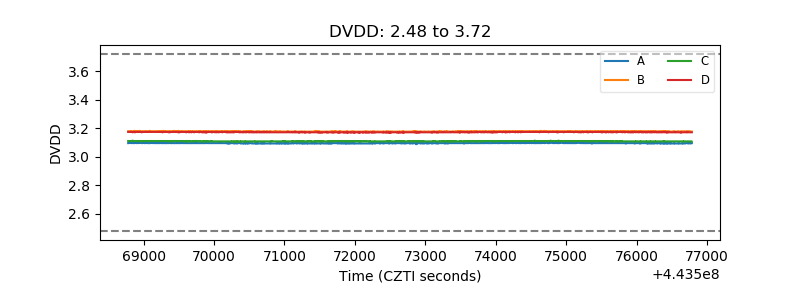 |
| Temperature 1 | 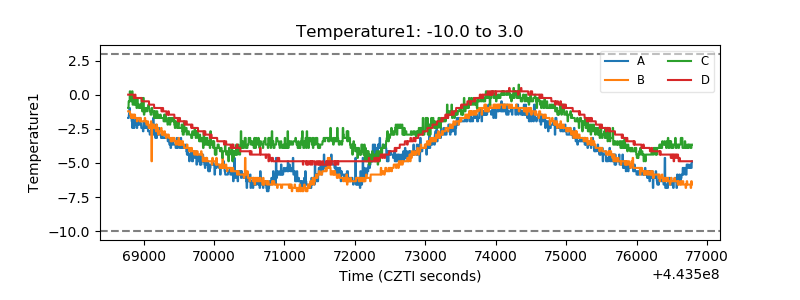 |
| Veto HV Monitor | 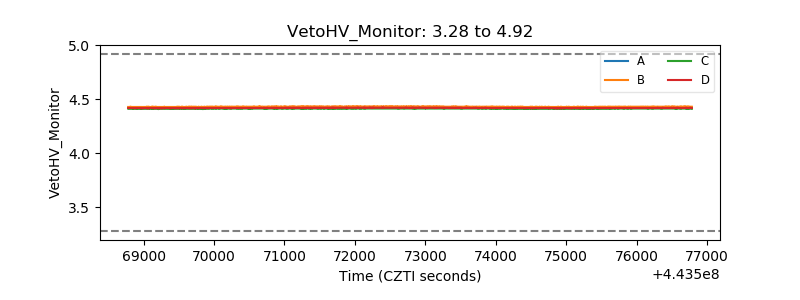 |
| Veto LLD | 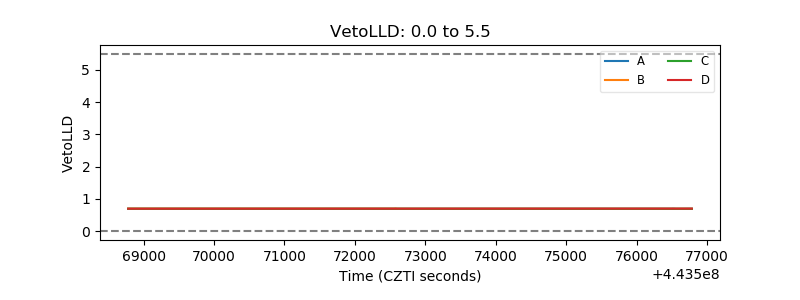 |
| Alpha Counter | 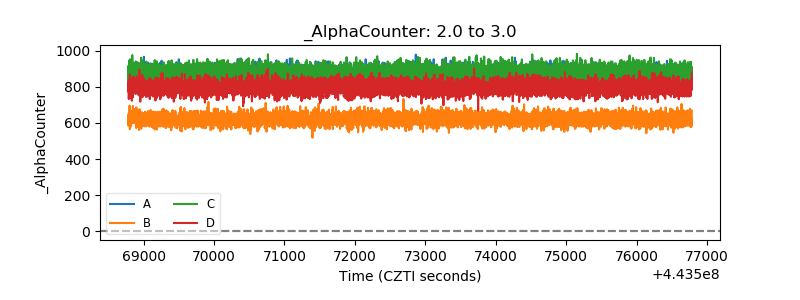 |
| _CPM_Rate | 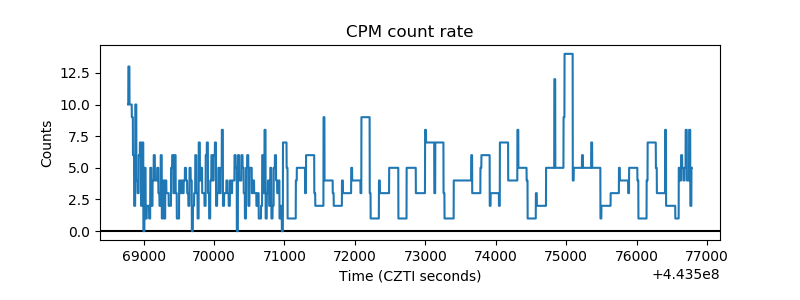 |
| CZT Counter | 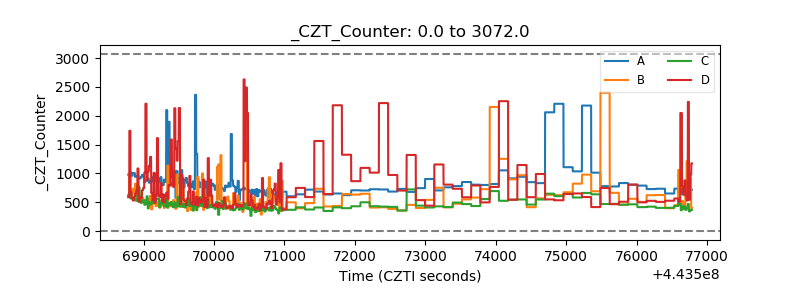 |
| +2.5 Volts monitor | 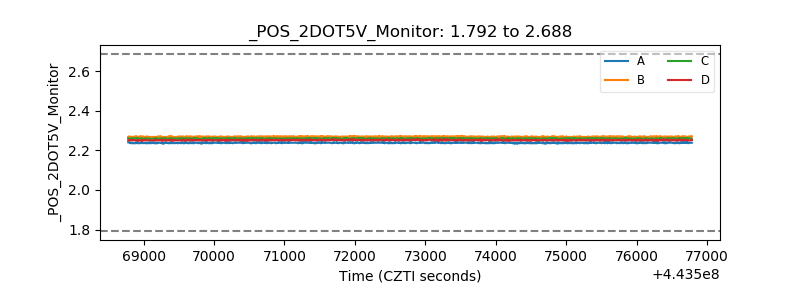 |
| +5 Volts monitor | 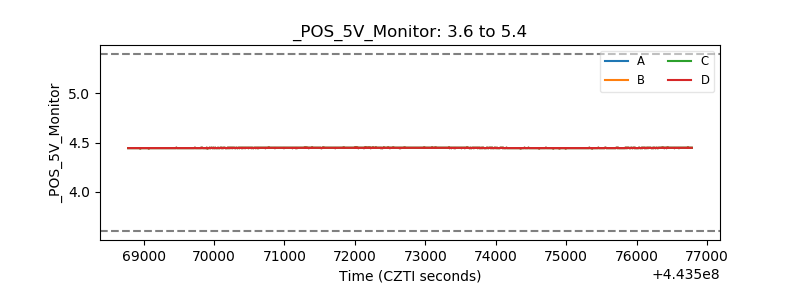 |
| _ROLL_ROT | 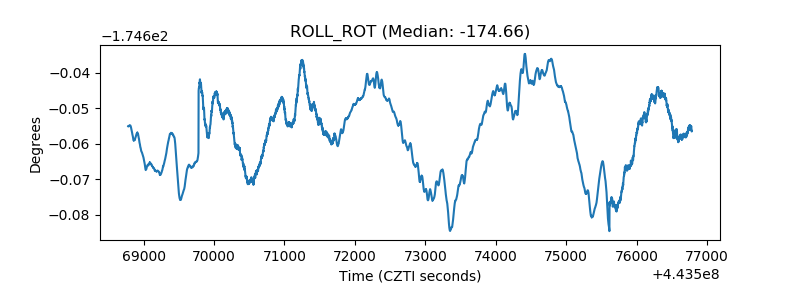 |
| _Roll_DEC | 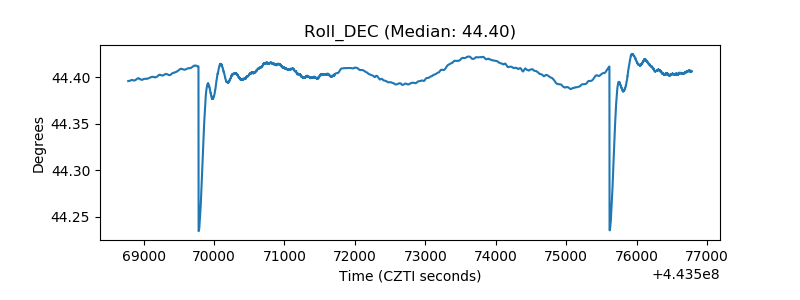 |
| _Roll_RA | 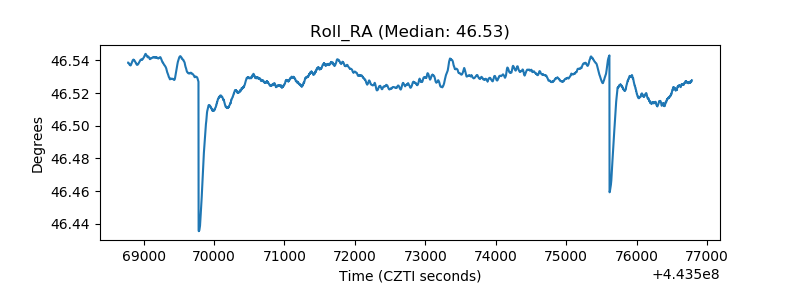 |
| Veto Counter | 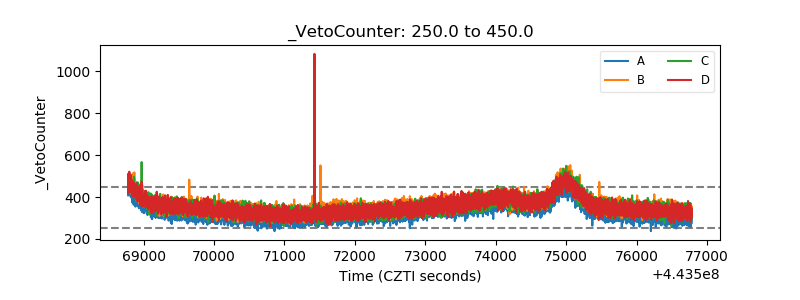 |