| Param | Original file | Final file |
|---|---|---|
| Filename | modeM0/AS1A13_044T01_9000006034_44975cztM0_level2.fits | modeM0/AS1A13_044T01_9000006034_44975cztM0_level2_quad_clean.evt |
| Size (bytes) | 1,640,056,320 | 306,959,040 |
| Size | 1.5 GB | 292.7 MB |
| Events in quadrant A | 15,991,432 | 2,067,677 |
| Events in quadrant B | 13,092,856 | 2,065,783 |
| Events in quadrant C | 9,121,442 | 2,088,654 |
| Events in quadrant D | 20,953,599 | 1,686,731 |
| Mode M9 | |||
|---|---|---|---|
| Quadrant | BADHDUFLAG | Total packets | Discarded packets |
| A | 0 | 11 | 0 |
| B | 0 | 11 | 0 |
| C | 0 | 11 | 0 |
| D | 0 | 11 | 0 |
| Mode M0 | |||
|---|---|---|---|
| Quadrant | BADHDUFLAG | Total packets | Discarded packets |
| A | 0 | 63360 | 3 |
| B | 0 | 52691 | 5 |
| C | 0 | 41746 | 3 |
| D | 0 | 76221 | 3 |
| Mode SS | |||
|---|---|---|---|
| Quadrant | BADHDUFLAG | Total packets | Discarded packets |
| A | 0 | 408 | 0 |
| B | 0 | 408 | 0 |
| C | 0 | 408 | 0 |
| D | 0 | 408 | 0 |
| Quadrant | Total seconds | Saturated seconds | Saturation percentage |
|---|---|---|---|
| A | 20084 | 682 | 3.395738% |
| B | 20083 | 1271 | 6.328736% |
| C | 20084 | 107 | 0.532762% |
| D | 20085 | 2649 | 13.188947% |
Noise dominated data is calculated using 1-second bins in cleaned event files. If a bin has >2000 counts, and if more than 50% of those come from <1% of pixels, then it is considered to be noise-dominated and hence unusable.
| Quadrant | # 1 sec bins | Bins with >0 counts | Bins with >2000 counts | High rate bins dominated by noise | Noise dominated (total time) | Noise dominated (detector-on time) | Marked lightcurve |
|---|---|---|---|---|---|---|---|
| A | 21259 | 20088 | 166 | 166 | 0.78% | 0.83% | 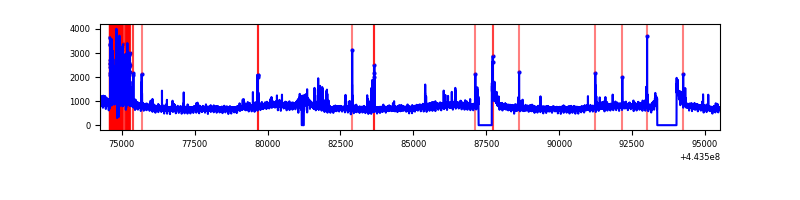 |
| B | 21258 | 20085 | 802 | 802 | 3.77% | 3.99% | 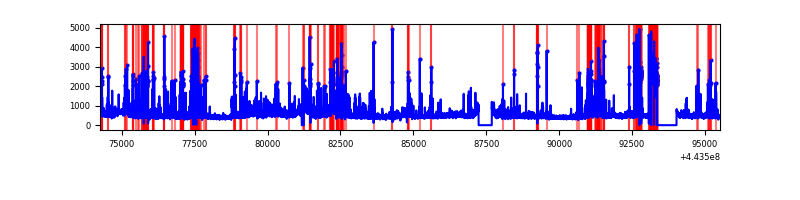 |
| C | 21258 | 20087 | 12 | 12 | 0.06% | 0.06% | 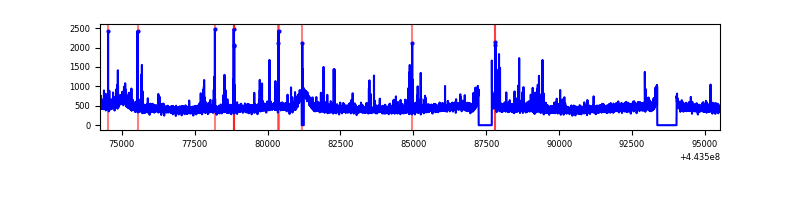 |
| D | 21260 | 20089 | 2449 | 2449 | 11.52% | 12.19% | 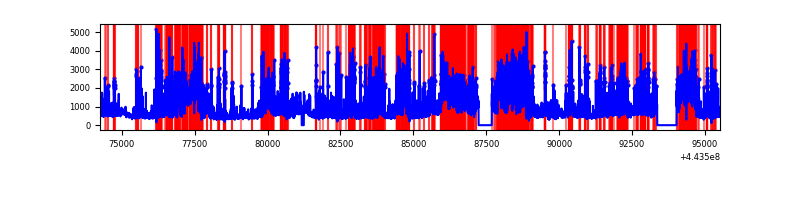 |
Top three noisy pixels from each quadrant. If the there are fewer than three noisy pixels in the level2.evt file, extra rows are filled as -1
| Pixel properties | Quadrant properties | ||||||
|---|---|---|---|---|---|---|---|
| Quadrant | DetID | PixID | Counts | Sigma | Mean | Median | Sigma |
| A | 10 | 83 | 6486908 | 13833.43 | 2251 | 2196 | 468.8 |
| A | 13 | 248 | 668079 | 1420.49 | 2251 | 2196 | 468.8 |
| A | 7 | 3 | 78239 | 162.22 | 2251 | 2196 | 468.8 |
| B | 0 | 189 | 1286555 | 2988.6 | 2195 | 2120 | 429.8 |
| B | 15 | 35 | 1095085 | 2543.09 | 2195 | 2120 | 429.8 |
| B | 0 | 219 | 486852 | 1127.87 | 2195 | 2120 | 429.8 |
| C | 3 | 233 | 111100 | 207.3 | 2241 | 2248 | 525.1 |
| C | 1 | 3 | 80234 | 148.52 | 2241 | 2248 | 525.1 |
| C | 14 | 254 | 73807 | 136.28 | 2241 | 2248 | 525.1 |
| D | 11 | 241 | 3155692 | 5844.74 | 2145 | 2078 | 539.6 |
| D | 13 | 187 | 2966821 | 5494.7 | 2145 | 2078 | 539.6 |
| D | 13 | 249 | 2022319 | 3744.21 | 2145 | 2078 | 539.6 |
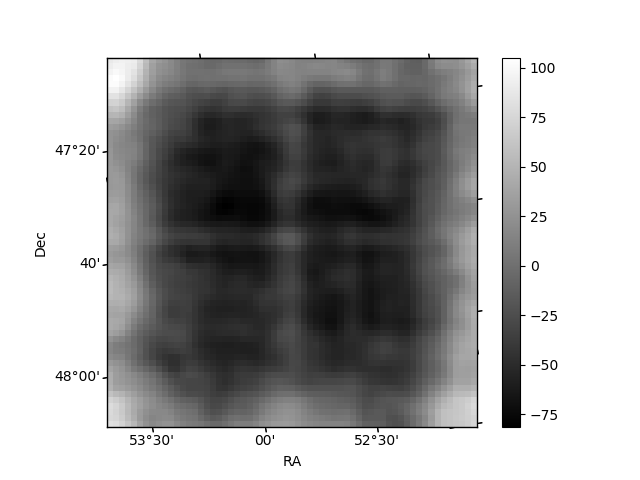
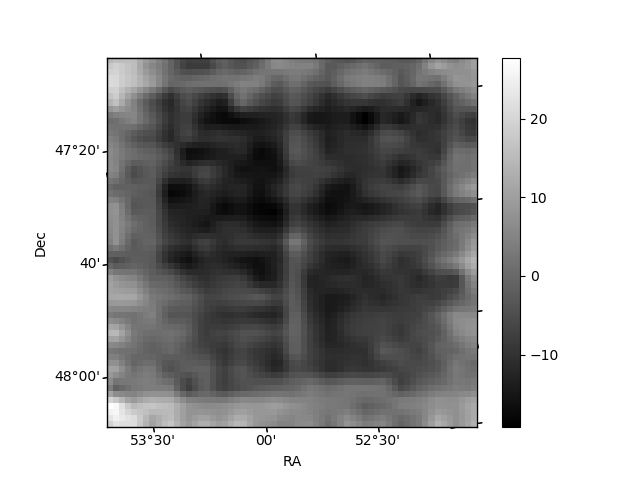
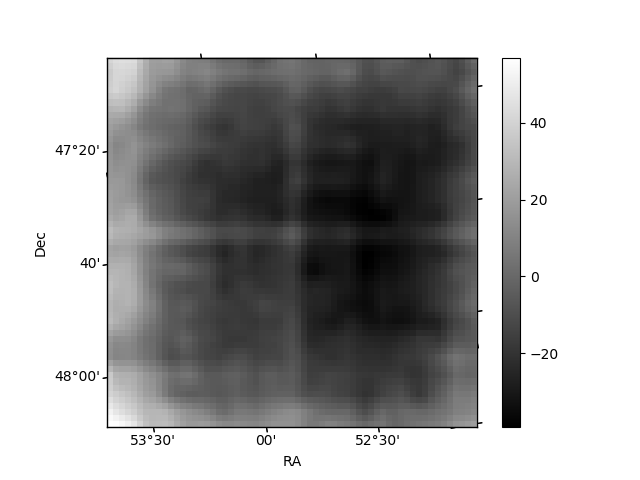
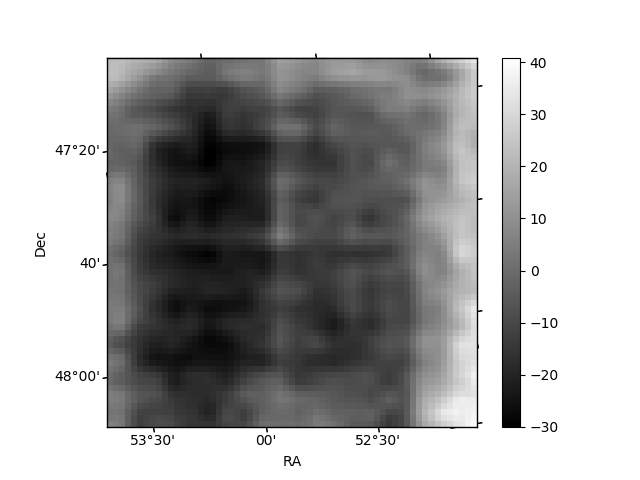
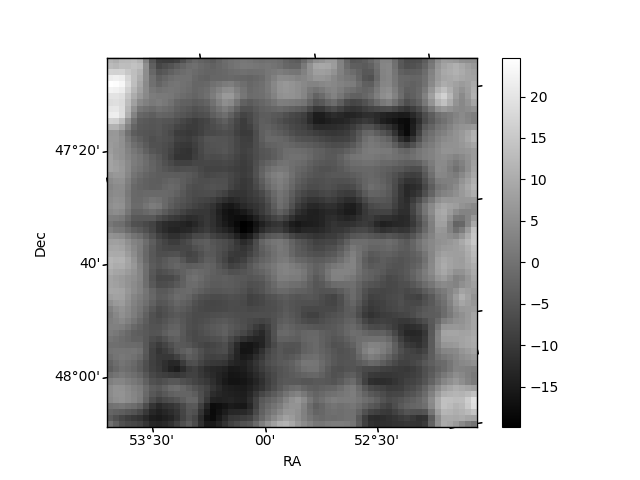
Histogram calculated using DETX and DETY for each event in the final _common_clean file
| Quadrant A | 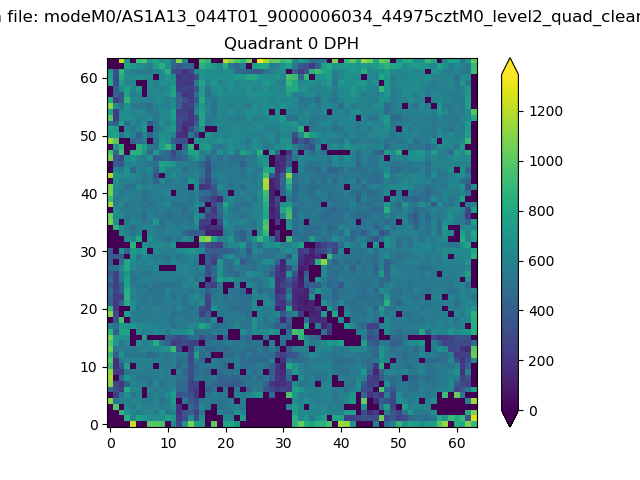 |
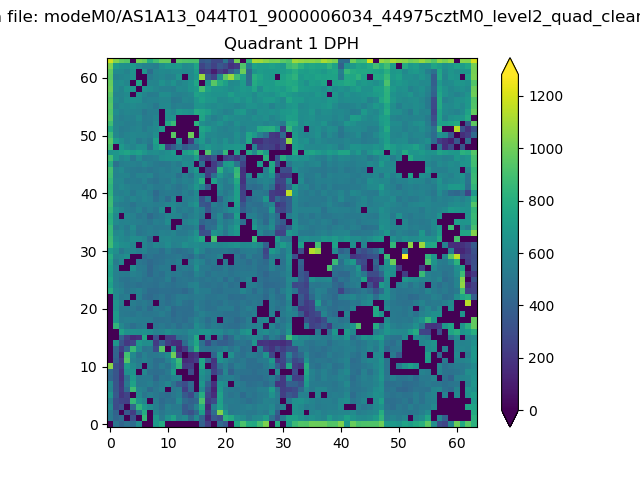 |
Quadrant B |
|---|---|---|---|
| Quadrant D | 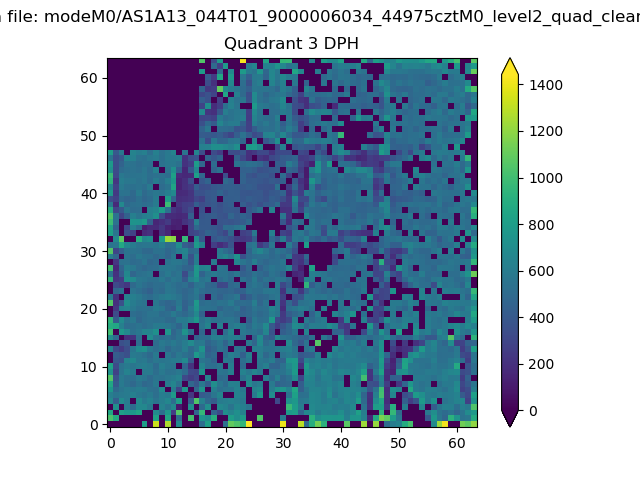 |
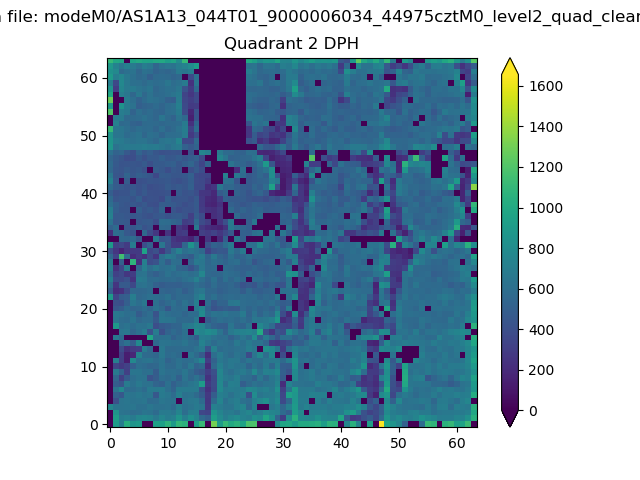 |
Quadrant C |
| Plot type | Count rate plots | Images |
|---|---|---|
| Comparison with Poisson distribution Blue bars denote a histogram of data divided into 1 sec bins. Red curve is a Poisson curve with rate = median count rate of data. |
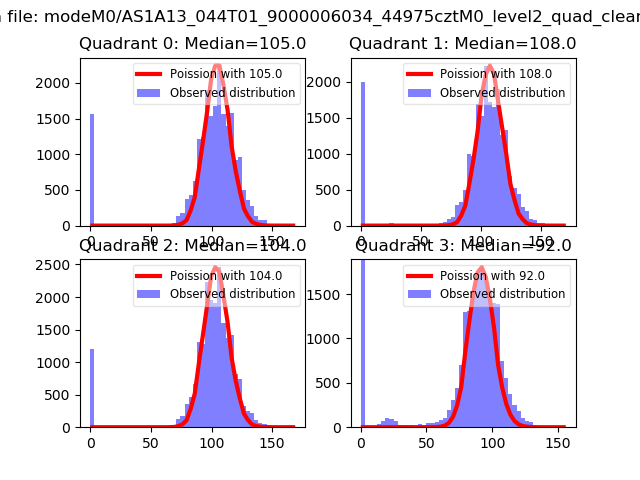 |
 |
| Quadrant-wise count rates Data is divided into 100 sec bins |
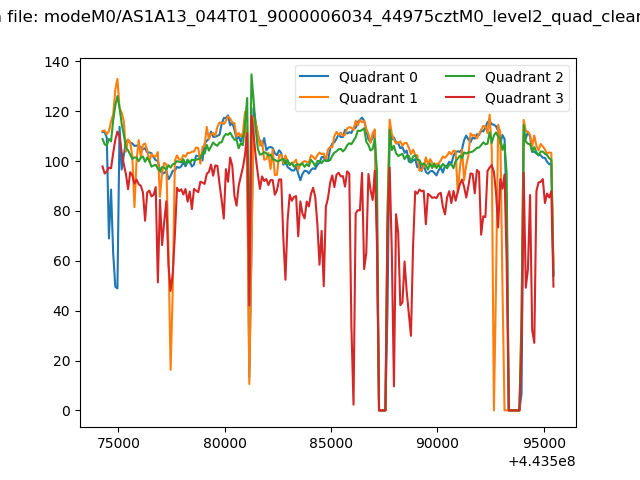 |
|
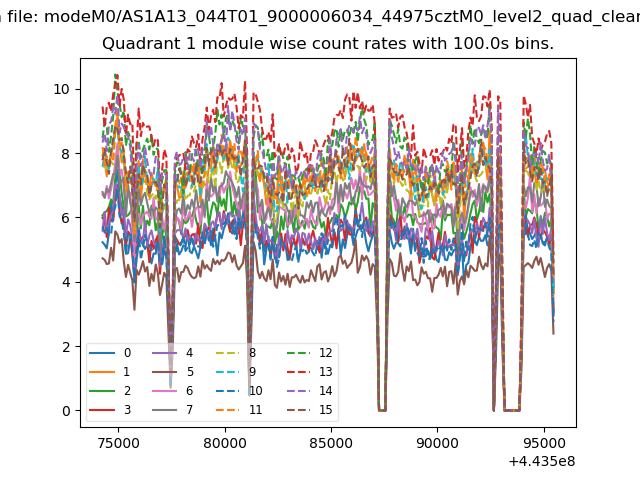
| Module-wise count rates for Quadrant A Data is divided into 100 sec bins |
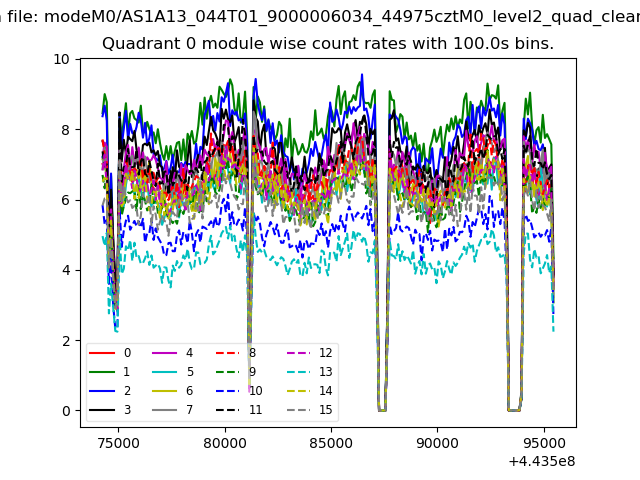 |
 |
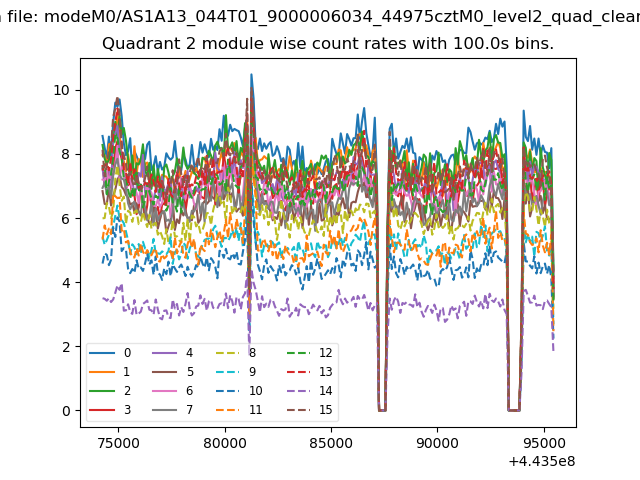
| Module-wise count rates for Quadrant B Data is divided into 100 sec bins |
 |
 |
| Module-wise count rates for Quadrant C Data is divided into 100 sec bins |
 |
 |
| Module-wise count rates for Quadrant D Data is divided into 100 sec bins |
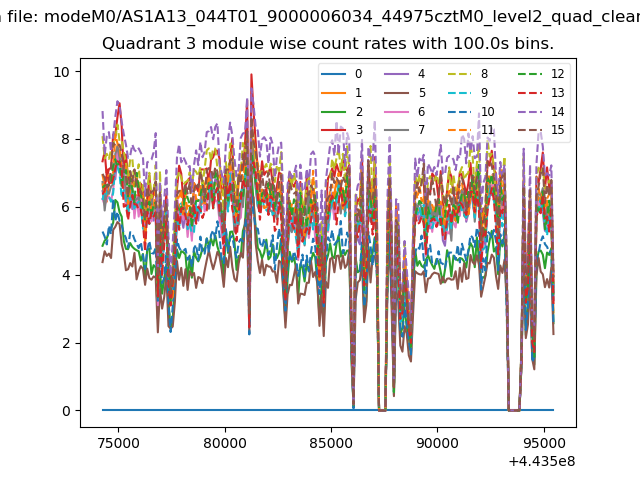 |
 |
| Parameter | Plot |
|---|---|
| CZT HV Monitor | 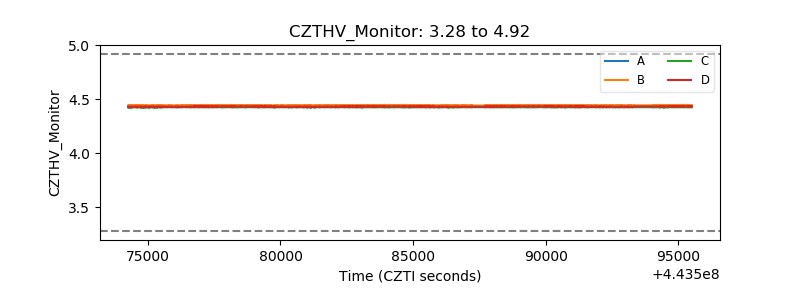 |
| D_VDD | 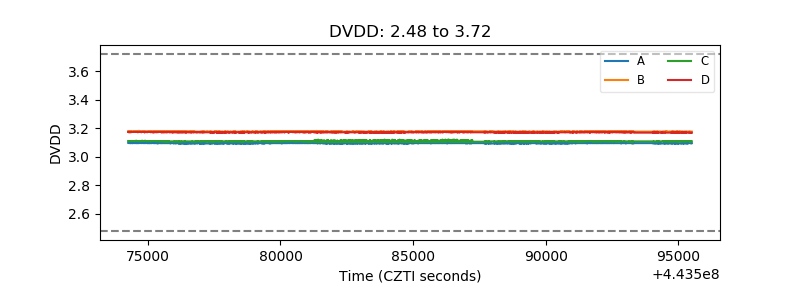 |
| Temperature 1 | 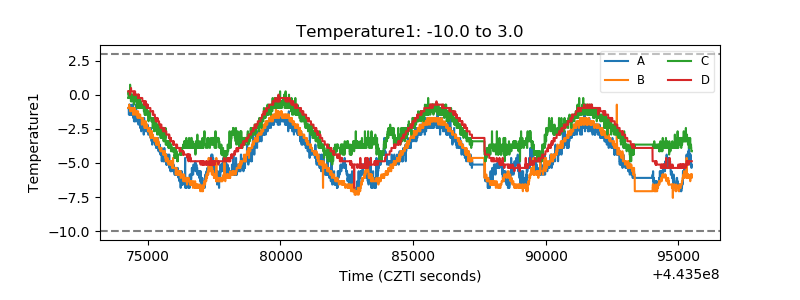 |
| Veto HV Monitor | 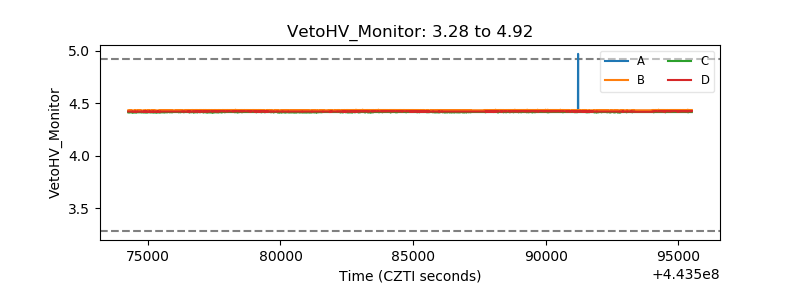 |
| Veto LLD | 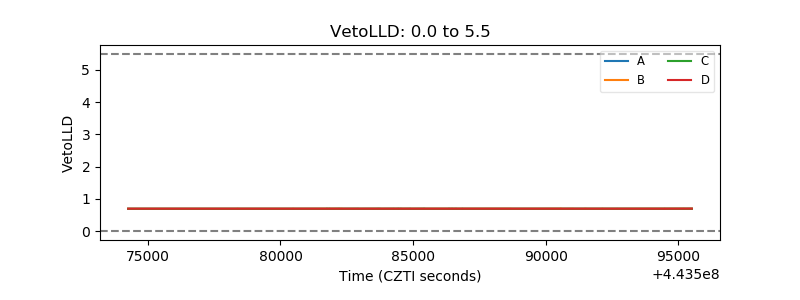 |
| Alpha Counter | 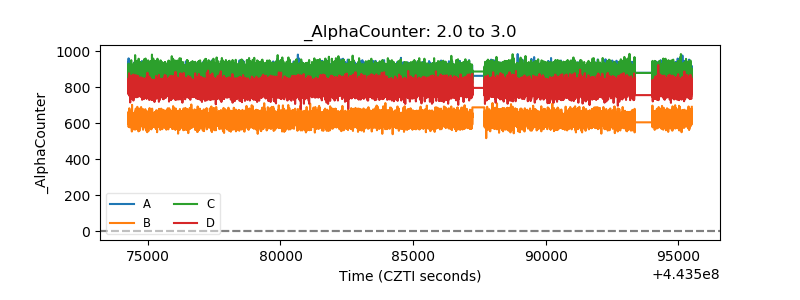 |
| _CPM_Rate | 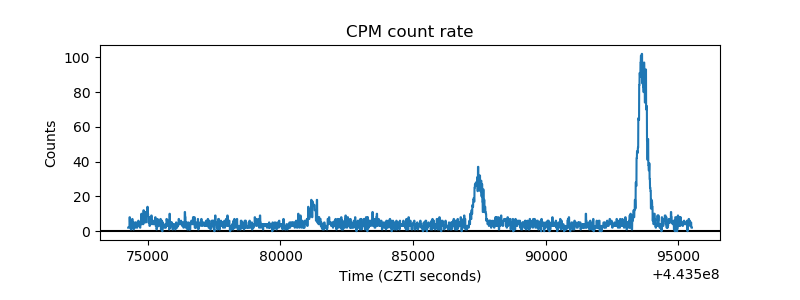 |
| CZT Counter | 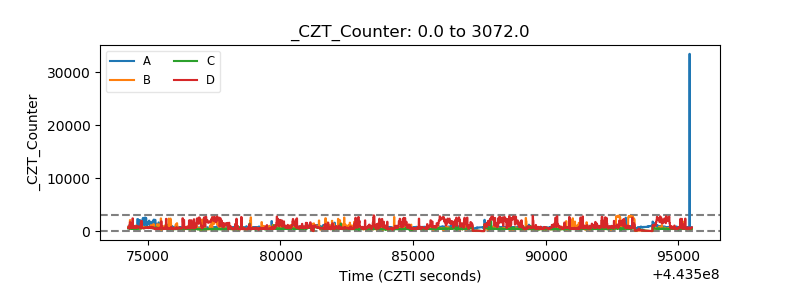 |
| +2.5 Volts monitor | 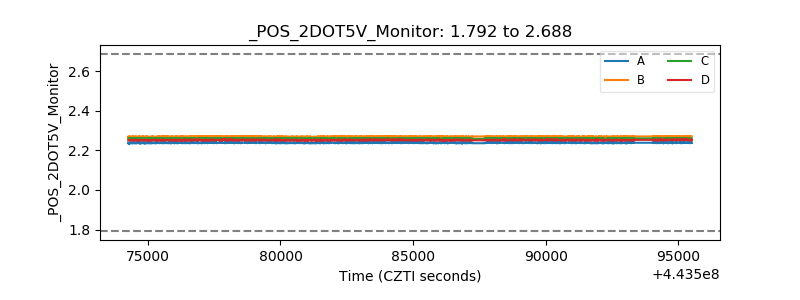 |
| +5 Volts monitor | 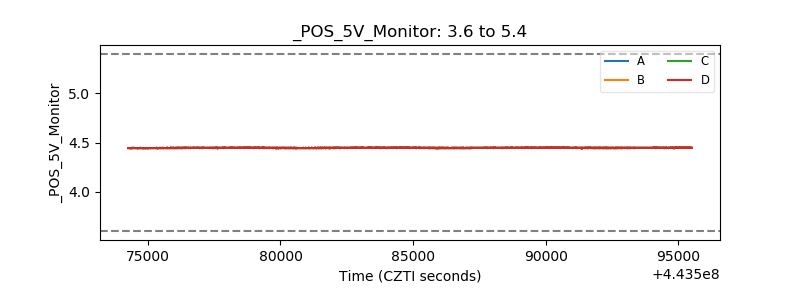 |
| _ROLL_ROT | 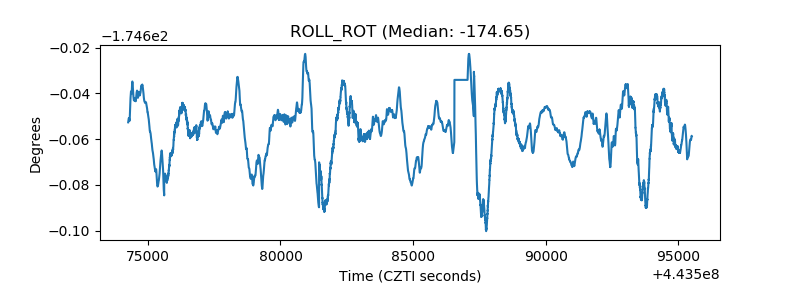 |
| _Roll_DEC | 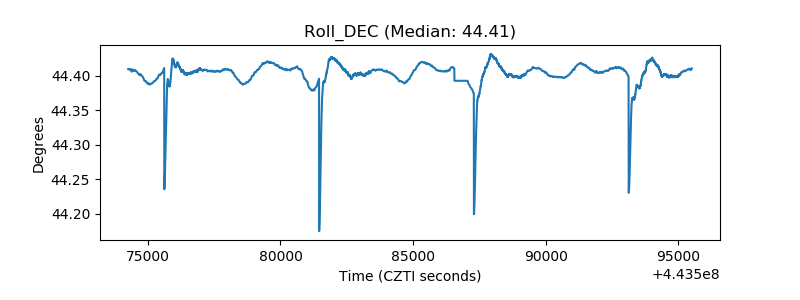 |
| _Roll_RA | 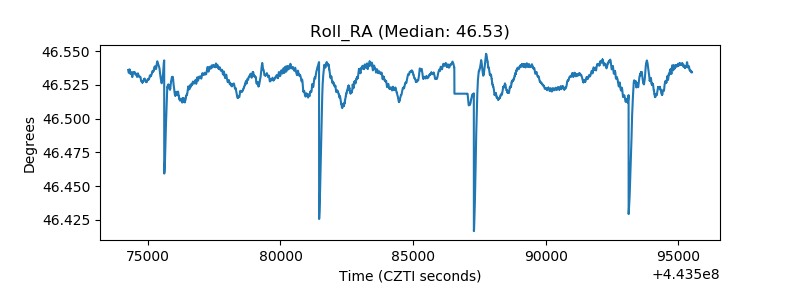 |
| Veto Counter | 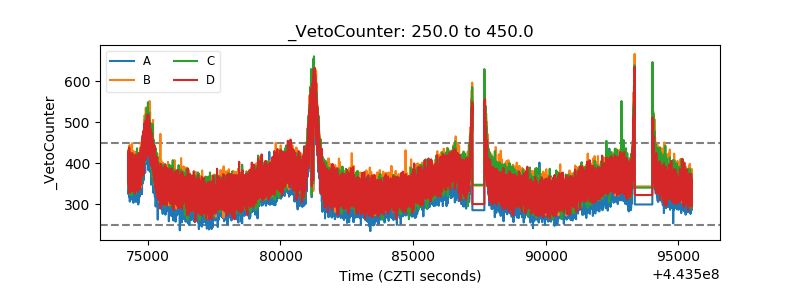 |