| Param | Original file | Final file |
|---|---|---|
| Filename | modeM0/AS1A13_044T01_9000006034_44976cztM0_level2.fits | modeM0/AS1A13_044T01_9000006034_44976cztM0_level2_quad_clean.evt |
| Size (bytes) | 555,583,680 | 112,602,240 |
| Size | 529.8 MB | 107.4 MB |
| Events in quadrant A | 5,680,390 | 755,132 |
| Events in quadrant B | 4,119,384 | 760,315 |
| Events in quadrant C | 3,377,110 | 754,138 |
| Events in quadrant D | 6,831,038 | 638,188 |
| Mode M9 | |||
|---|---|---|---|
| Quadrant | BADHDUFLAG | Total packets | Discarded packets |
| A | 0 | 14 | 0 |
| B | 0 | 14 | 0 |
| C | 0 | 14 | 0 |
| D | 0 | 14 | 0 |
| Mode M0 | |||
|---|---|---|---|
| Quadrant | BADHDUFLAG | Total packets | Discarded packets |
| A | 0 | 22557 | 2 |
| B | 0 | 17052 | 2 |
| C | 0 | 15116 | 2 |
| D | 0 | 25341 | 2 |
| Mode SS | |||
|---|---|---|---|
| Quadrant | BADHDUFLAG | Total packets | Discarded packets |
| A | 0 | 150 | 0 |
| B | 0 | 150 | 0 |
| C | 0 | 150 | 0 |
| D | 0 | 150 | 0 |
| Quadrant | Total seconds | Saturated seconds | Saturation percentage |
|---|---|---|---|
| A | 7194 | 169 | 2.349180% |
| B | 7195 | 341 | 4.739402% |
| C | 7195 | 71 | 0.986796% |
| D | 7195 | 711 | 9.881862% |
Noise dominated data is calculated using 1-second bins in cleaned event files. If a bin has >2000 counts, and if more than 50% of those come from <1% of pixels, then it is considered to be noise-dominated and hence unusable.
| Quadrant | # 1 sec bins | Bins with >0 counts | Bins with >2000 counts | High rate bins dominated by noise | Noise dominated (total time) | Noise dominated (detector-on time) | Marked lightcurve |
|---|---|---|---|---|---|---|---|
| A | 8709 | 7196 | 10 | 10 | 0.11% | 0.14% | 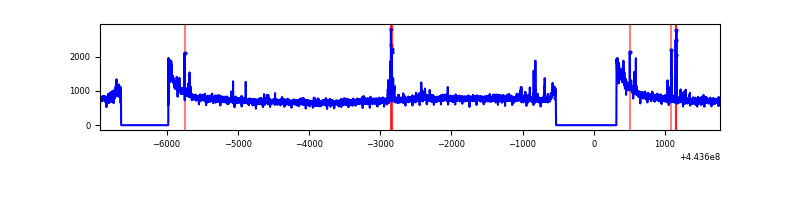 |
| B | 8710 | 7196 | 257 | 257 | 2.95% | 3.57% | 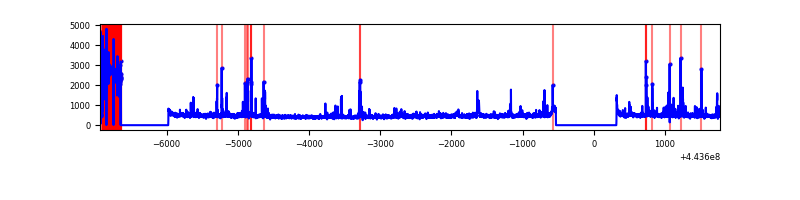 |
| C | 8710 | 7197 | 10 | 10 | 0.11% | 0.14% | 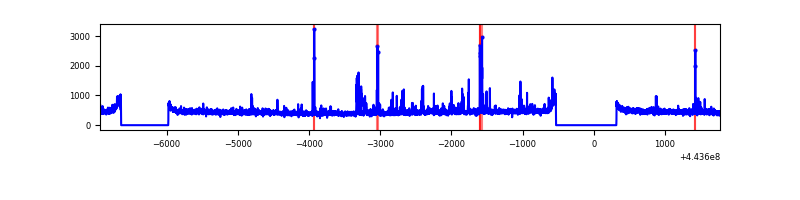 |
| D | 8710 | 7197 | 611 | 611 | 7.01% | 8.49% | 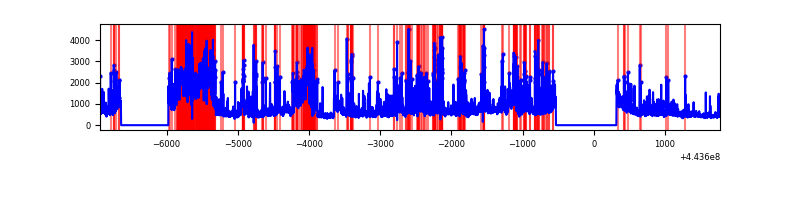 |
Top three noisy pixels from each quadrant. If the there are fewer than three noisy pixels in the level2.evt file, extra rows are filled as -1
| Pixel properties | Quadrant properties | ||||||
|---|---|---|---|---|---|---|---|
| Quadrant | DetID | PixID | Counts | Sigma | Mean | Median | Sigma |
| A | 10 | 83 | 2435027 | 14357.54 | 812 | 793 | 169.5 |
| A | 13 | 248 | 50508 | 293.23 | 812 | 793 | 169.5 |
| A | 7 | 3 | 46572 | 270.01 | 812 | 793 | 169.5 |
| B | 15 | 35 | 655235 | 4239.74 | 784 | 761 | 154.4 |
| B | 4 | 171 | 110512 | 710.98 | 784 | 761 | 154.4 |
| B | 5 | 172 | 87946 | 564.79 | 784 | 761 | 154.4 |
| C | 1 | 3 | 164422 | 869.6 | 803 | 808 | 188.1 |
| C | 11 | 16 | 55730 | 291.91 | 803 | 808 | 188.1 |
| C | 14 | 254 | 16415 | 82.95 | 803 | 808 | 188.1 |
| D | 13 | 187 | 1150392 | 5905.54 | 775 | 752 | 194.7 |
| D | 13 | 249 | 850955 | 4367.38 | 775 | 752 | 194.7 |
| D | 11 | 241 | 706284 | 3624.22 | 775 | 752 | 194.7 |
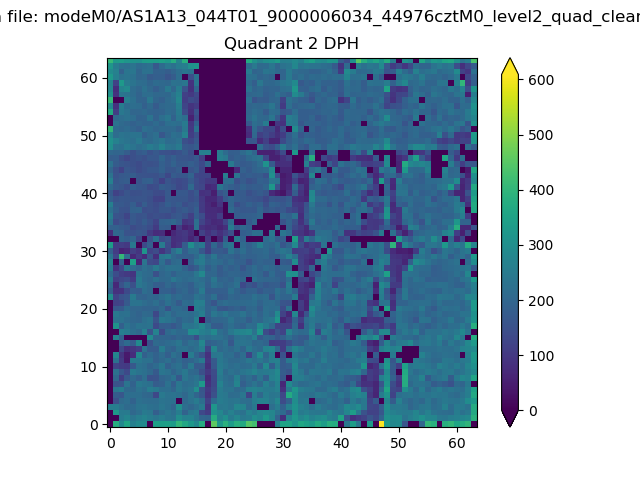
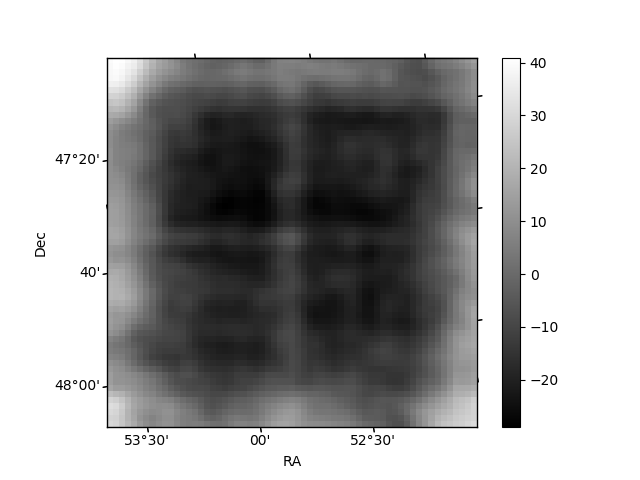
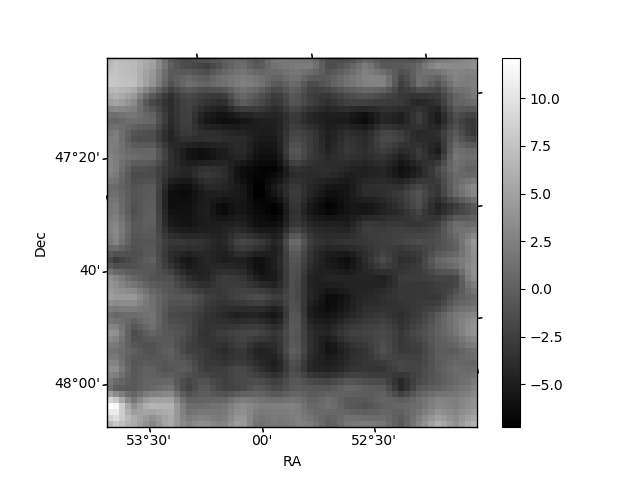
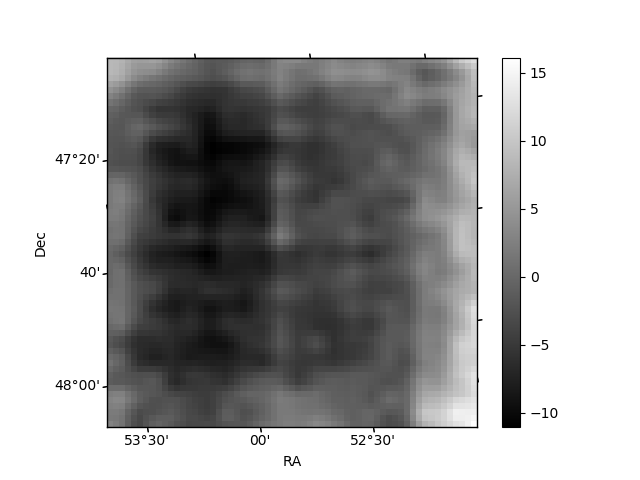
Histogram calculated using DETX and DETY for each event in the final _common_clean file
| Quadrant A | 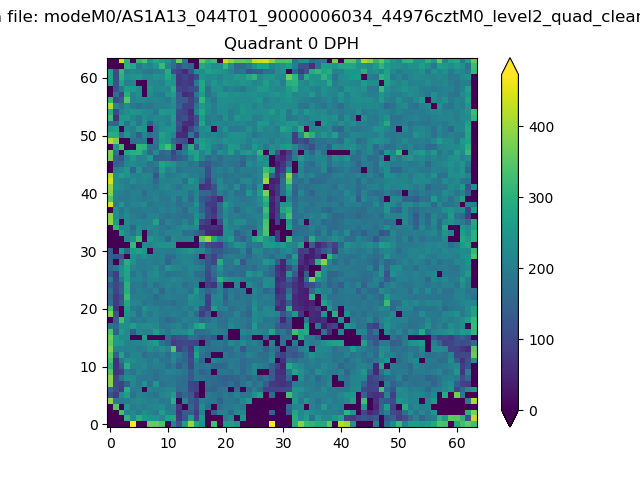 |
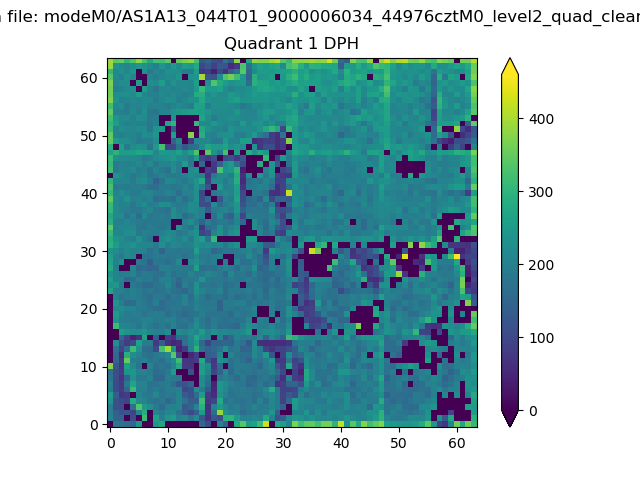 |
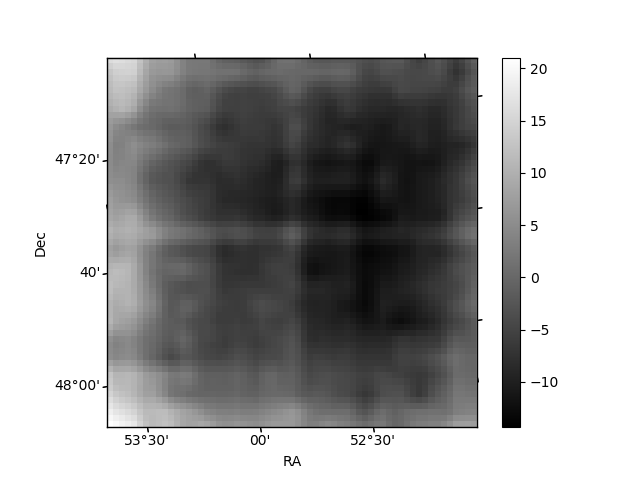
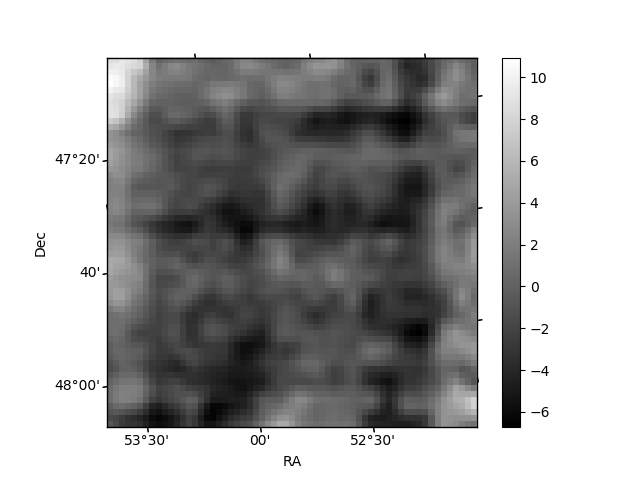
Quadrant B |
|---|---|---|---|
| Quadrant D | 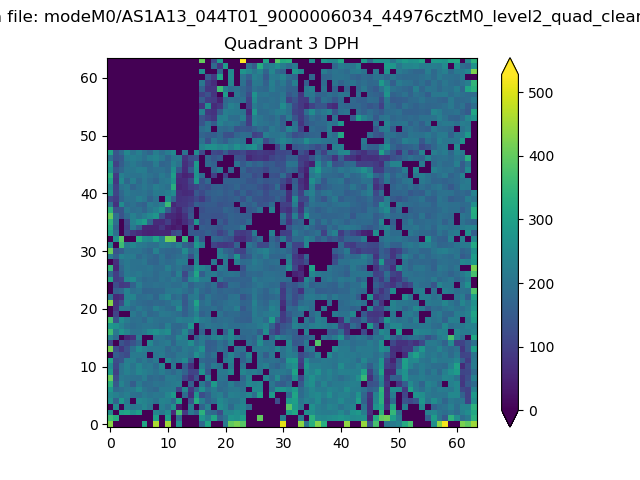 |
 |
Quadrant C |
| Plot type | Count rate plots | Images |
|---|---|---|
| Comparison with Poisson distribution Blue bars denote a histogram of data divided into 1 sec bins. Red curve is a Poisson curve with rate = median count rate of data. |
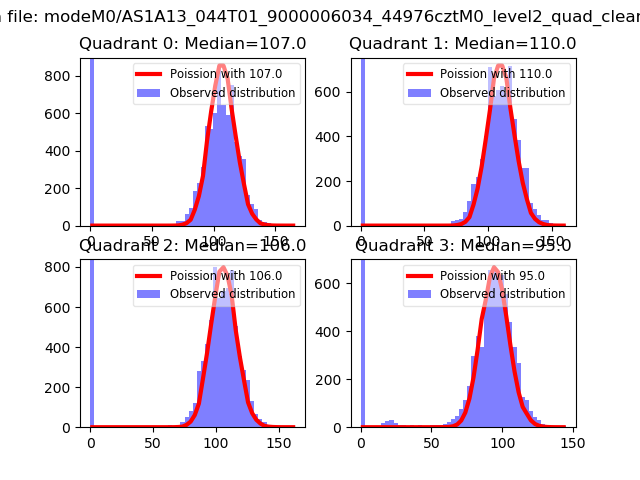 |
 |
| Quadrant-wise count rates Data is divided into 100 sec bins |
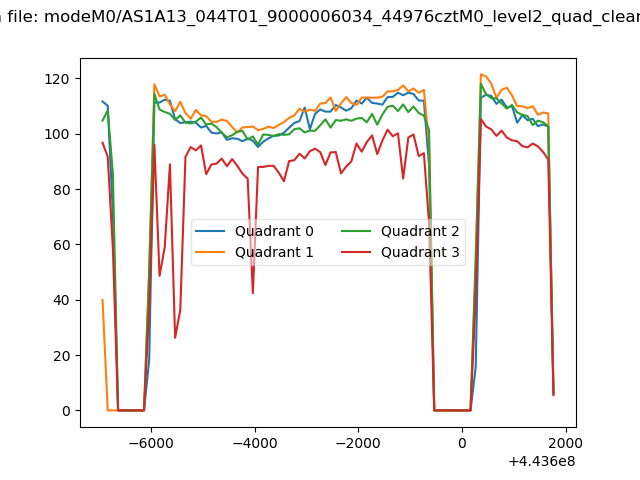 |
|
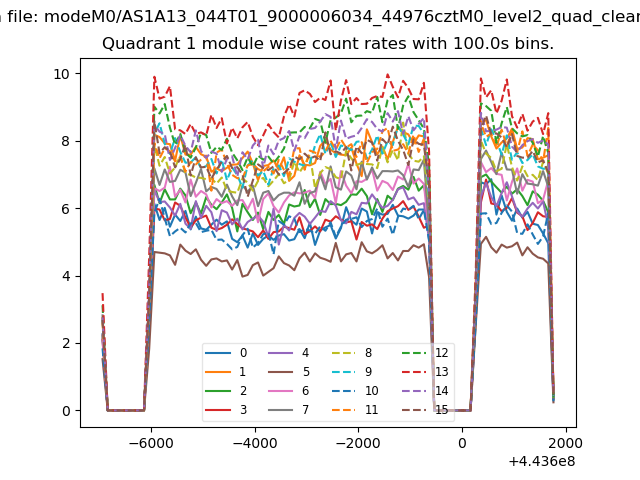
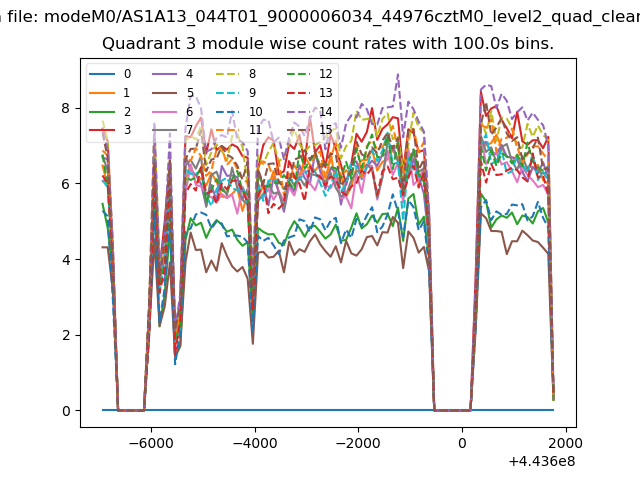
| Module-wise count rates for Quadrant A Data is divided into 100 sec bins |
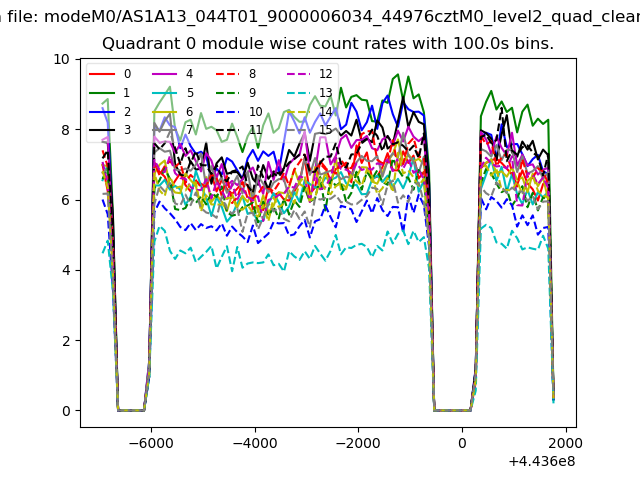 |
 |
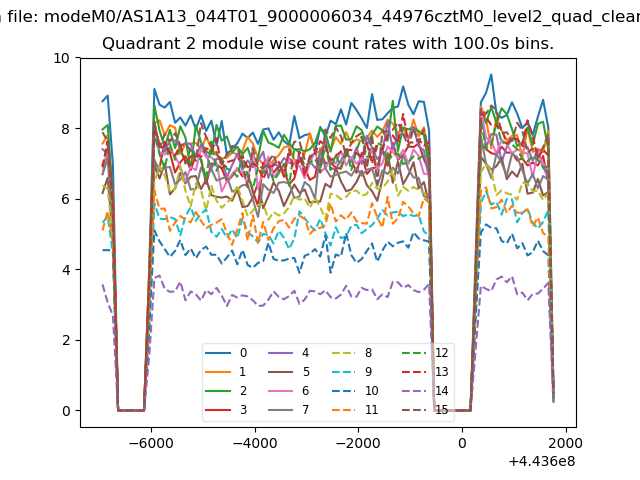
| Module-wise count rates for Quadrant B Data is divided into 100 sec bins |
 |
 |
| Module-wise count rates for Quadrant C Data is divided into 100 sec bins |
 |
 |
| Module-wise count rates for Quadrant D Data is divided into 100 sec bins |
 |
 |
| Parameter | Plot |
|---|---|
| CZT HV Monitor |  |
| D_VDD | 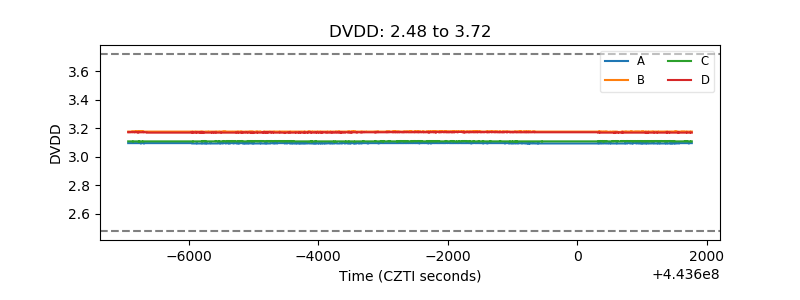 |
| Temperature 1 | 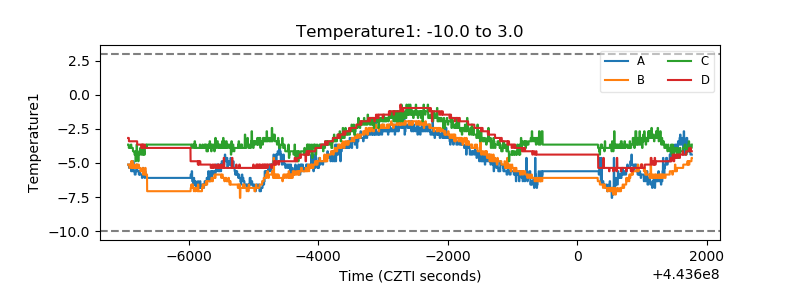 |
| Veto HV Monitor | 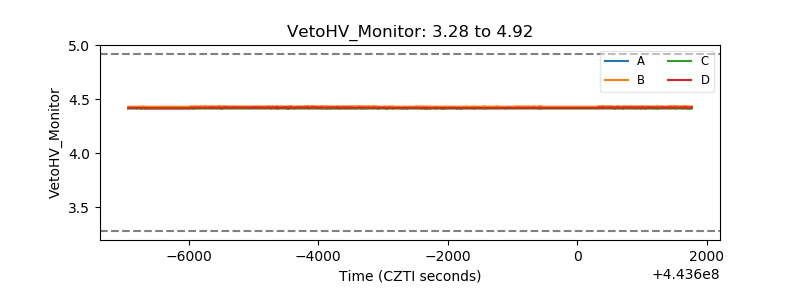 |
| Veto LLD | 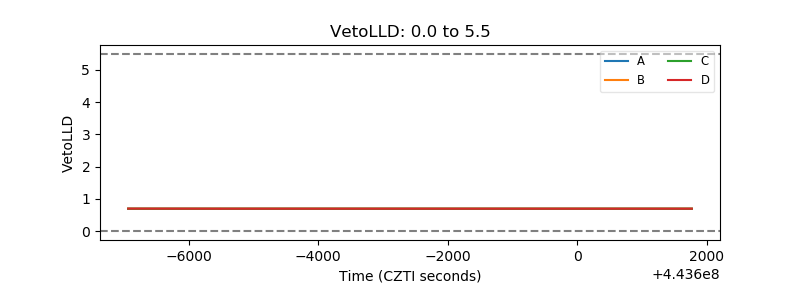 |
| Alpha Counter | 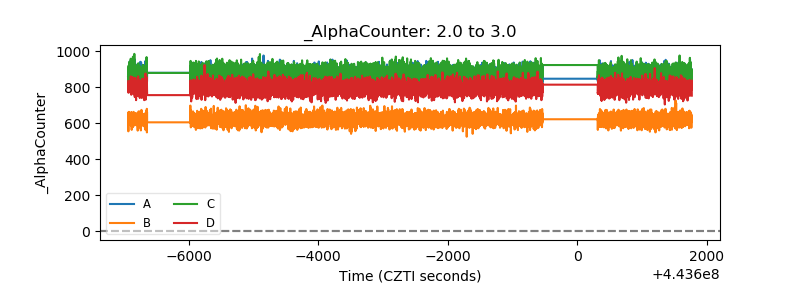 |
| _CPM_Rate | 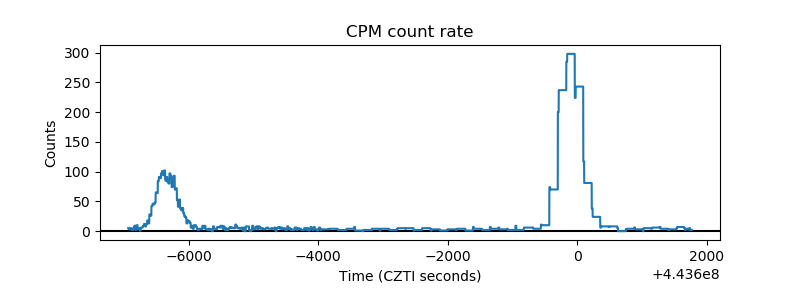 |
| CZT Counter | 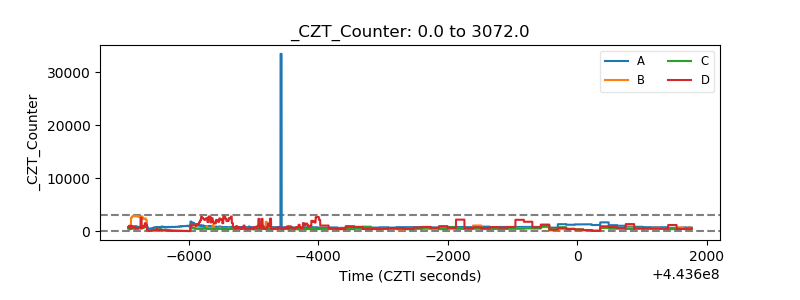 |
| +2.5 Volts monitor | 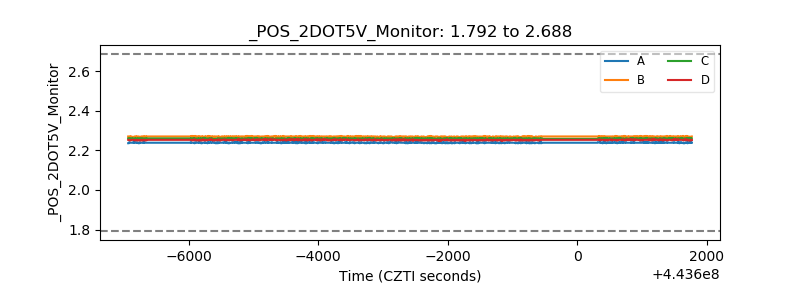 |
| +5 Volts monitor | 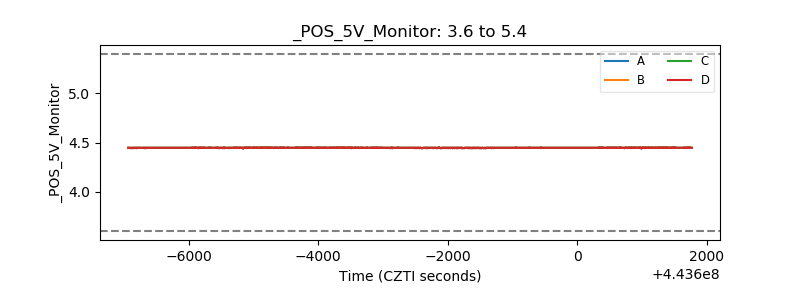 |
| _ROLL_ROT | 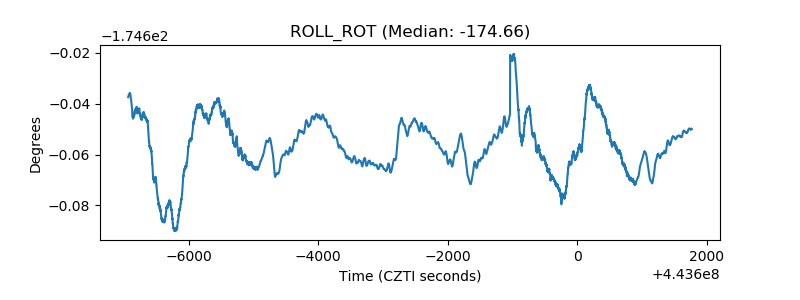 |
| _Roll_DEC | 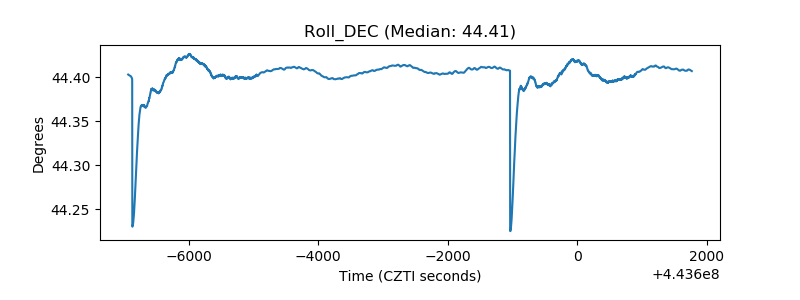 |
| _Roll_RA | 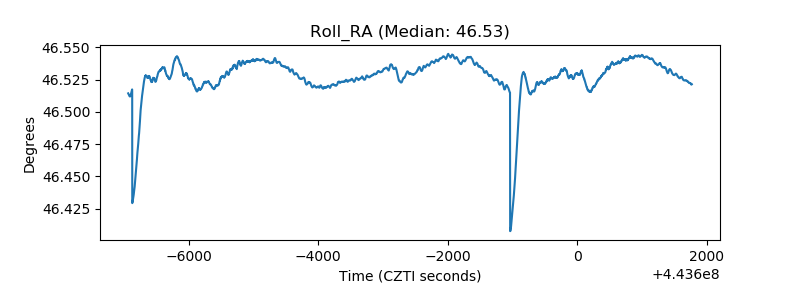 |
| Veto Counter | 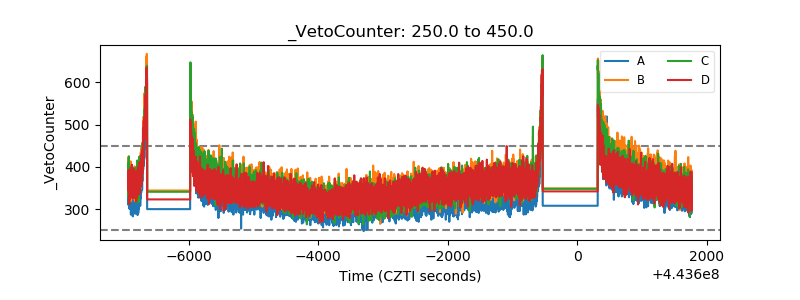 |