| Param | Original file | Final file |
|---|---|---|
| Filename | modeM0/AS1A13_044T01_9000006034_44977cztM0_level2.fits | modeM0/AS1A13_044T01_9000006034_44977cztM0_level2_quad_clean.evt |
| Size (bytes) | 477,146,880 | 108,368,640 |
| Size | 455.0 MB | 103.3 MB |
| Events in quadrant A | 5,351,531 | 721,883 |
| Events in quadrant B | 3,683,084 | 742,676 |
| Events in quadrant C | 2,993,804 | 715,148 |
| Events in quadrant D | 5,118,796 | 638,859 |
| Mode M9 | |||
|---|---|---|---|
| Quadrant | BADHDUFLAG | Total packets | Discarded packets |
| A | 0 | 10 | 0 |
| B | 0 | 10 | 0 |
| C | 0 | 10 | 0 |
| D | 0 | 10 | 0 |
| Mode M0 | |||
|---|---|---|---|
| Quadrant | BADHDUFLAG | Total packets | Discarded packets |
| A | 0 | 20893 | 1 |
| B | 0 | 15285 | 1 |
| C | 0 | 13590 | 2 |
| D | 0 | 19798 | 1 |
| Mode SS | |||
|---|---|---|---|
| Quadrant | BADHDUFLAG | Total packets | Discarded packets |
| A | 0 | 134 | 0 |
| B | 0 | 134 | 0 |
| C | 0 | 134 | 0 |
| D | 0 | 134 | 0 |
| Quadrant | Total seconds | Saturated seconds | Saturation percentage |
|---|---|---|---|
| A | 6640 | 133 | 2.003012% |
| B | 6641 | 171 | 2.574913% |
| C | 6640 | 36 | 0.542169% |
| D | 6640 | 286 | 4.307229% |
Noise dominated data is calculated using 1-second bins in cleaned event files. If a bin has >2000 counts, and if more than 50% of those come from <1% of pixels, then it is considered to be noise-dominated and hence unusable.
| Quadrant | # 1 sec bins | Bins with >0 counts | Bins with >2000 counts | High rate bins dominated by noise | Noise dominated (total time) | Noise dominated (detector-on time) | Marked lightcurve |
|---|---|---|---|---|---|---|---|
| A | 7630 | 6641 | 11 | 11 | 0.14% | 0.17% | 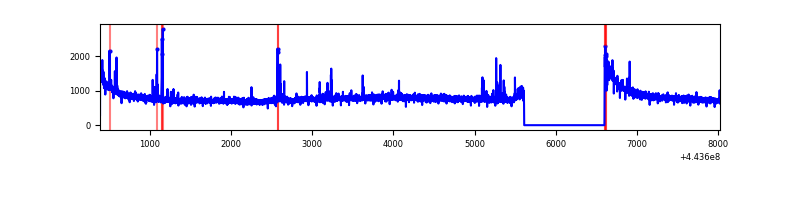 |
| B | 7631 | 6642 | 60 | 60 | 0.79% | 0.90% | 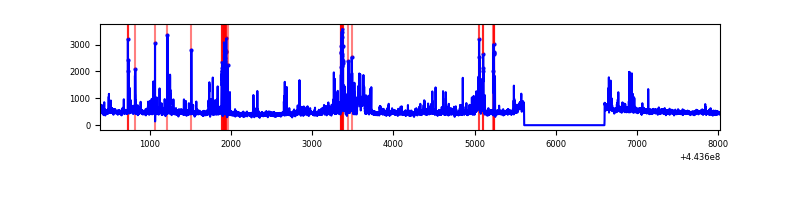 |
| C | 7630 | 6641 | 3 | 3 | 0.04% | 0.05% | 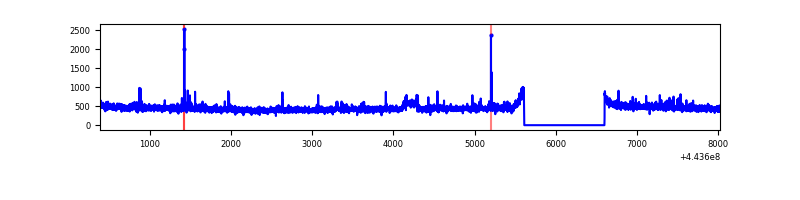 |
| D | 7630 | 6641 | 215 | 215 | 2.82% | 3.24% | 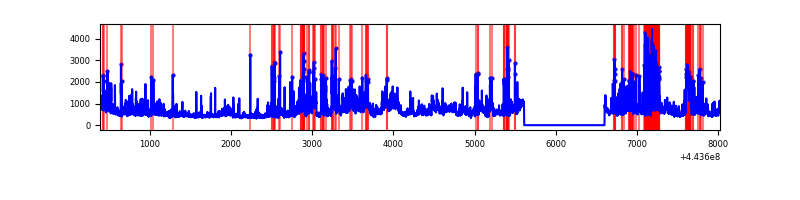 |
Top three noisy pixels from each quadrant. If the there are fewer than three noisy pixels in the level2.evt file, extra rows are filled as -1
| Pixel properties | Quadrant properties | ||||||
|---|---|---|---|---|---|---|---|
| Quadrant | DetID | PixID | Counts | Sigma | Mean | Median | Sigma |
| A | 10 | 83 | 2320847 | 14792.56 | 756 | 739 | 156.8 |
| A | 7 | 3 | 54331 | 341.69 | 756 | 739 | 156.8 |
| A | 13 | 248 | 37032 | 231.4 | 756 | 739 | 156.8 |
| B | 5 | 255 | 391586 | 2611.18 | 754 | 729 | 149.7 |
| B | 4 | 171 | 118675 | 787.96 | 754 | 729 | 149.7 |
| B | 0 | 183 | 37233 | 243.87 | 754 | 729 | 149.7 |
| C | 1 | 3 | 50723 | 287.06 | 742 | 745 | 174.1 |
| C | 14 | 254 | 14997 | 81.86 | 742 | 745 | 174.1 |
| C | 3 | 233 | 11206 | 60.09 | 742 | 745 | 174.1 |
| D | 11 | 241 | 1020836 | 5605.03 | 730 | 708 | 182.0 |
| D | 13 | 249 | 538081 | 2952.56 | 730 | 708 | 182.0 |
| D | 5 | 171 | 275354 | 1509.02 | 730 | 708 | 182.0 |
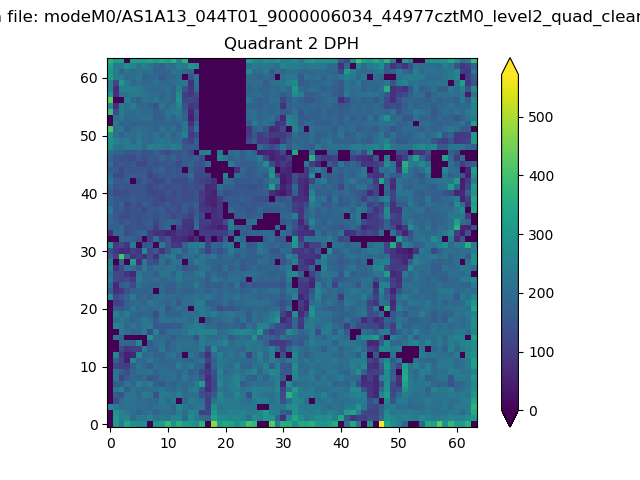
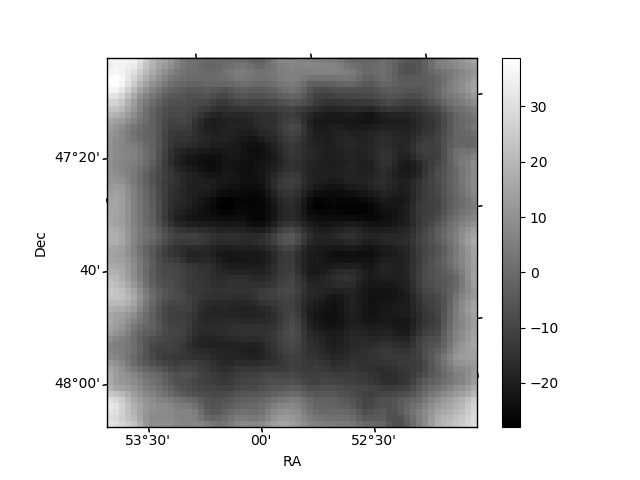
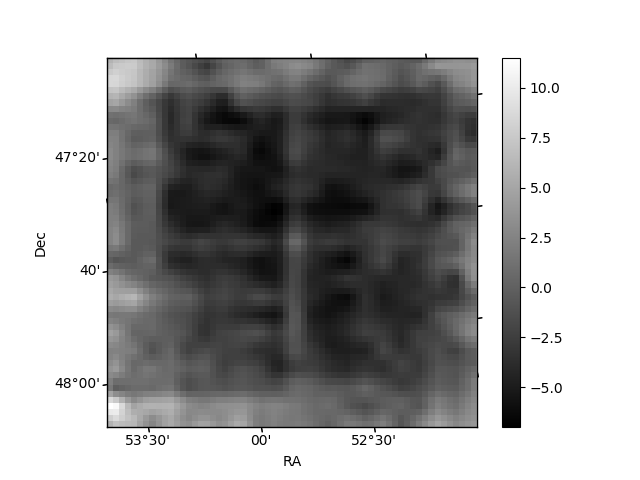
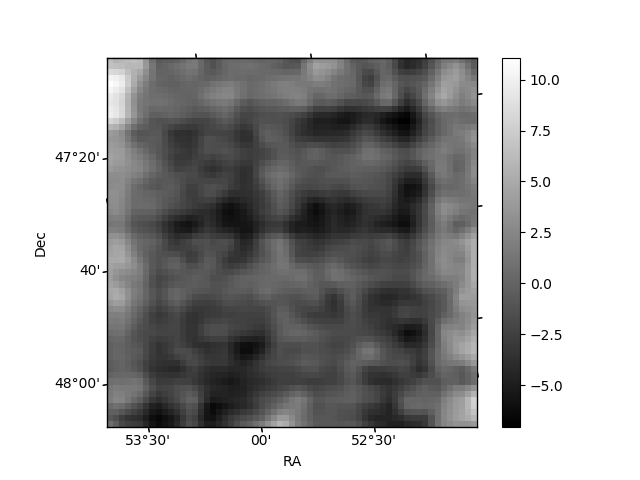
Histogram calculated using DETX and DETY for each event in the final _common_clean file
| Quadrant A | 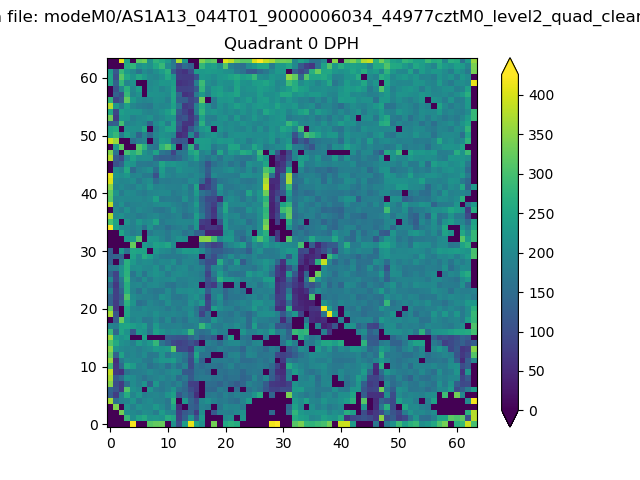 |
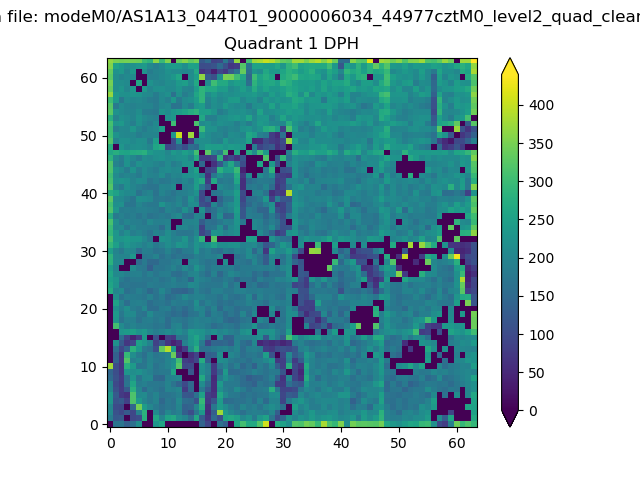 |
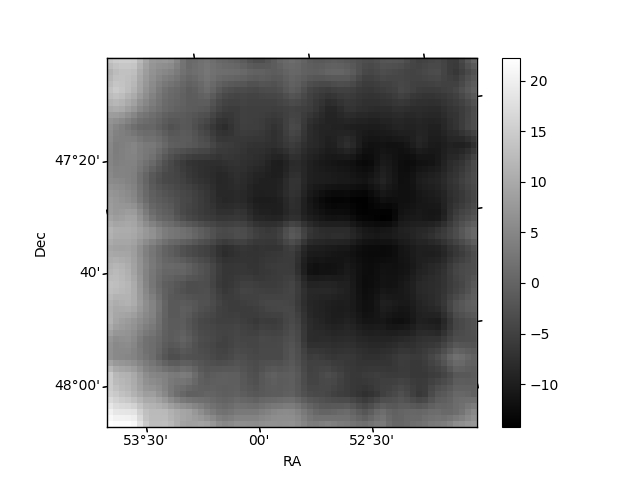
Quadrant B |
|---|---|---|---|
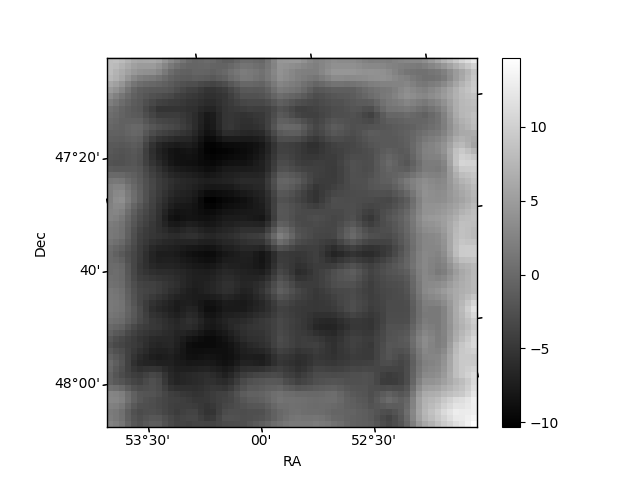
| Quadrant D | 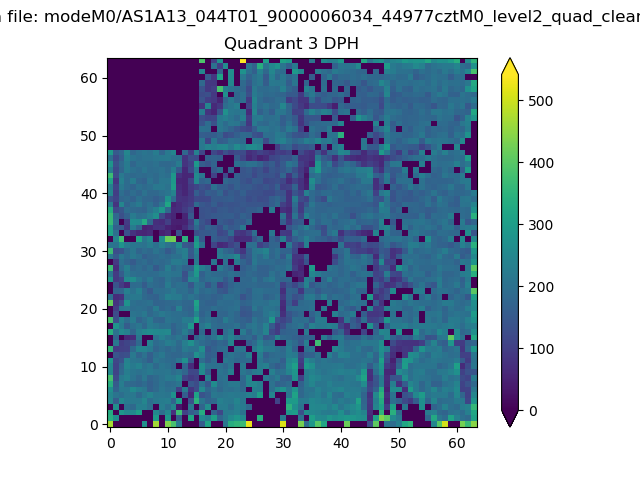 |
 |
Quadrant C |
| Plot type | Count rate plots | Images |
|---|---|---|
| Comparison with Poisson distribution Blue bars denote a histogram of data divided into 1 sec bins. Red curve is a Poisson curve with rate = median count rate of data. |
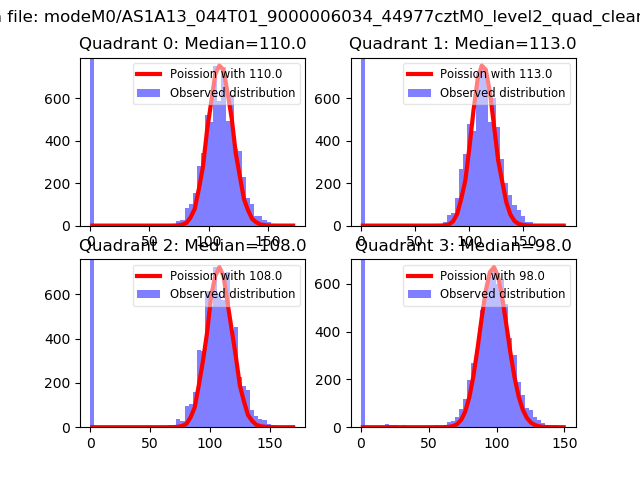 |
 |
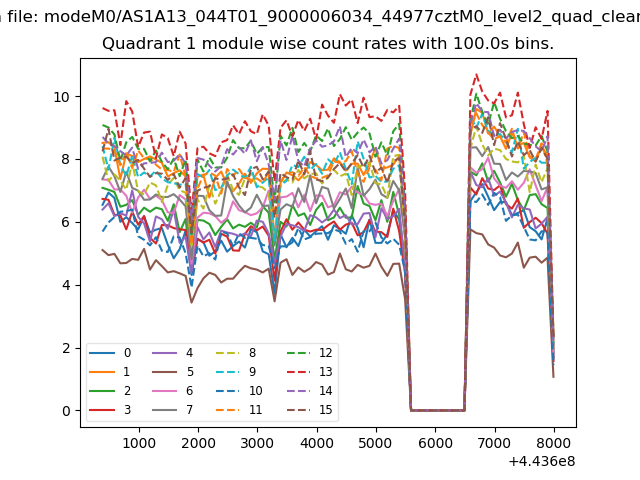
| Quadrant-wise count rates Data is divided into 100 sec bins |
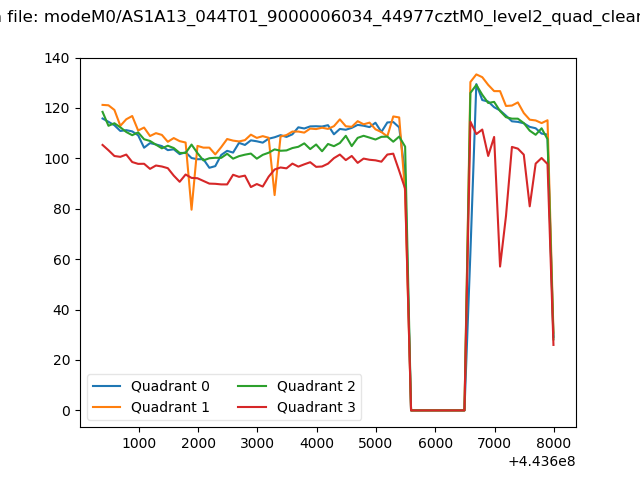 |
|
| Module-wise count rates for Quadrant A Data is divided into 100 sec bins |
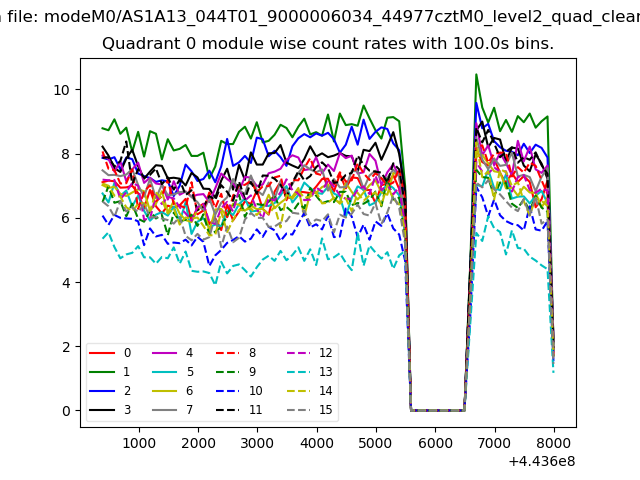 |
 |
| Module-wise count rates for Quadrant B Data is divided into 100 sec bins |
 |
 |
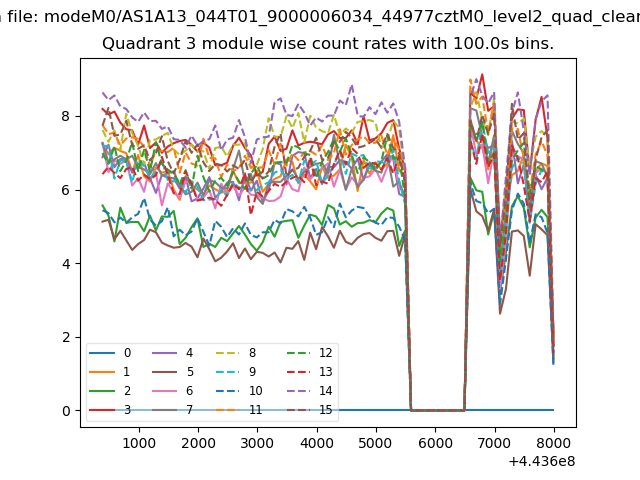
| Module-wise count rates for Quadrant C Data is divided into 100 sec bins |
 |
 |
| Module-wise count rates for Quadrant D Data is divided into 100 sec bins |
 |
 |
| Parameter | Plot |
|---|---|
| CZT HV Monitor | 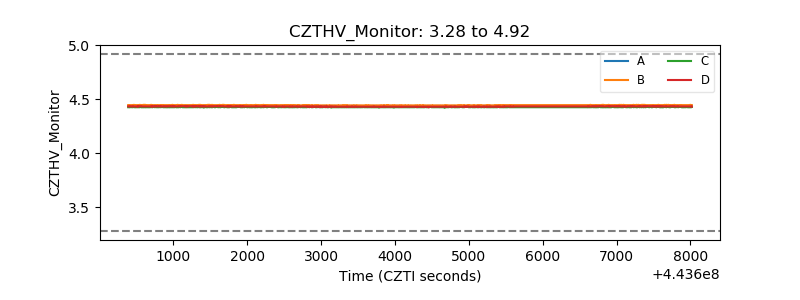 |
| D_VDD | 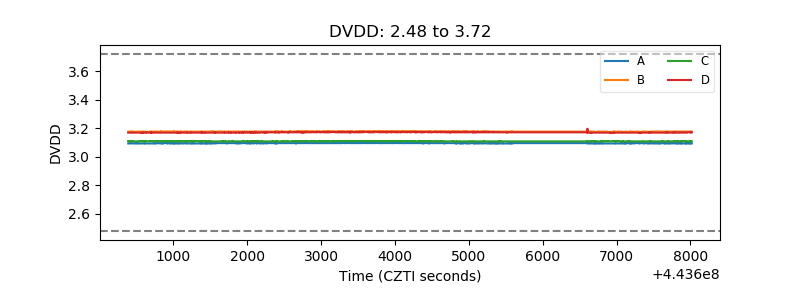 |
| Temperature 1 | 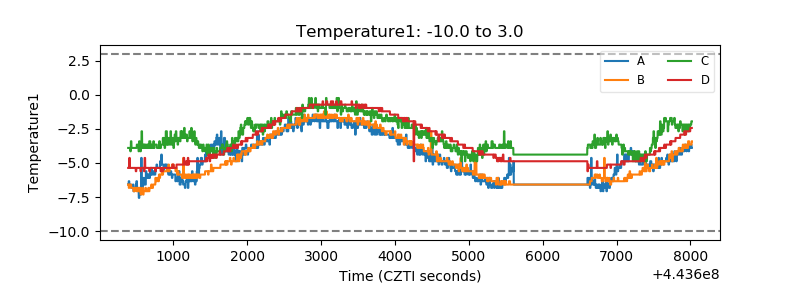 |
| Veto HV Monitor | 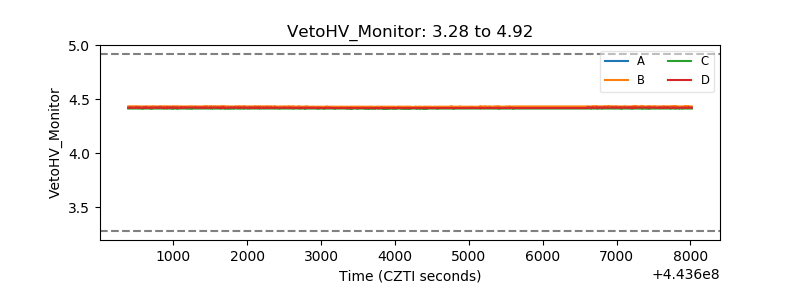 |
| Veto LLD | 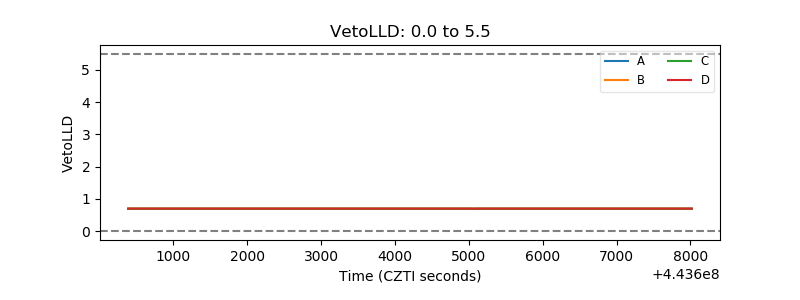 |
| Alpha Counter | 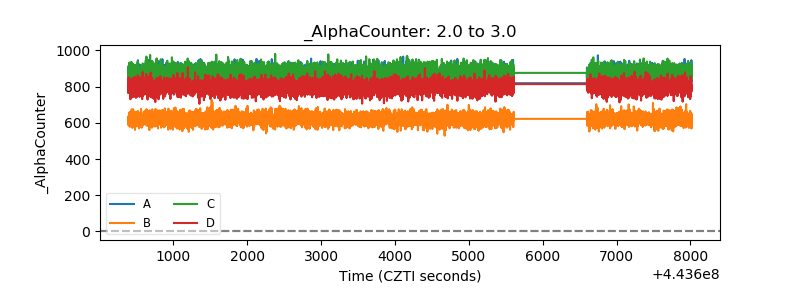 |
| _CPM_Rate | 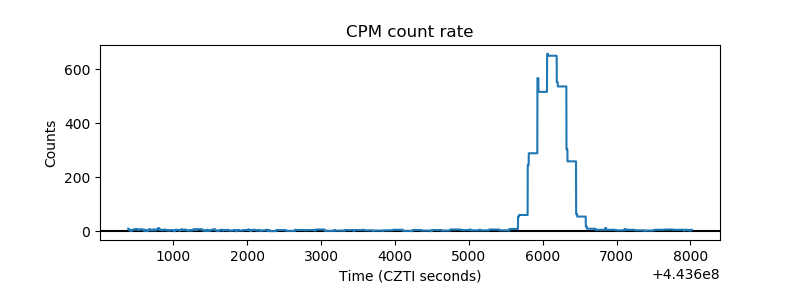 |
| CZT Counter | 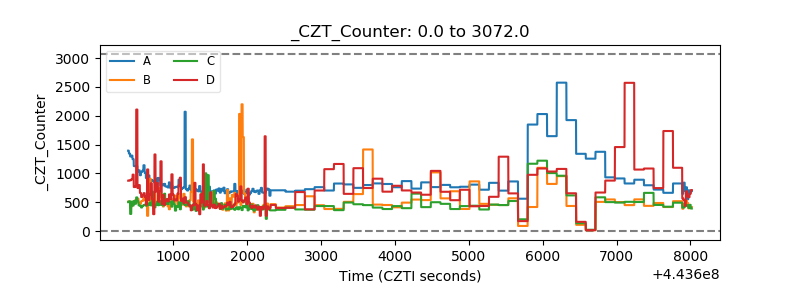 |
| +2.5 Volts monitor | 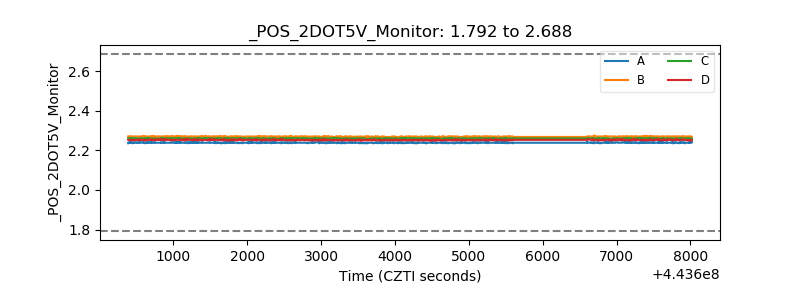 |
| +5 Volts monitor | 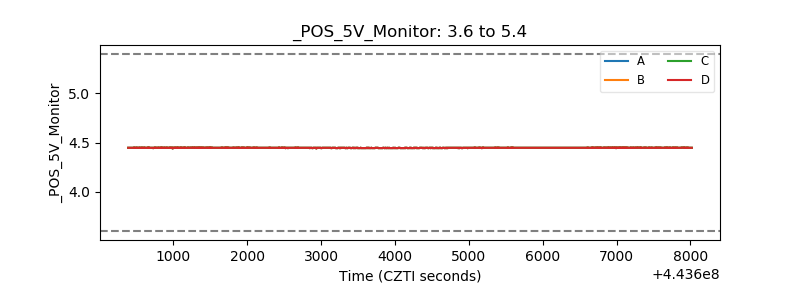 |
| _ROLL_ROT | 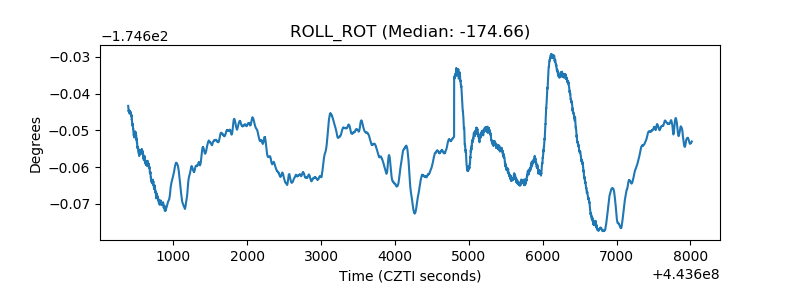 |
| _Roll_DEC | 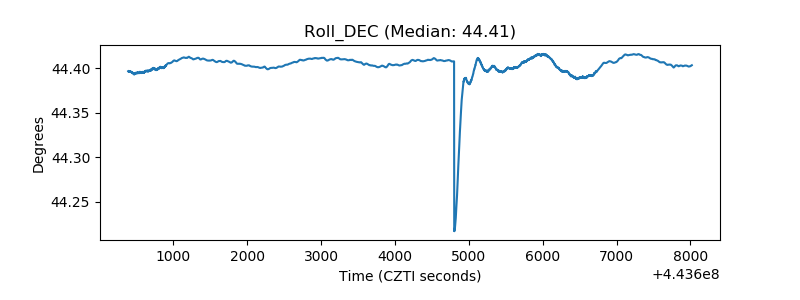 |
| _Roll_RA | 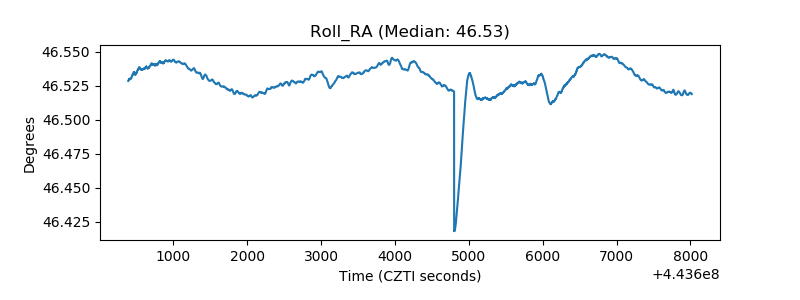 |
| Veto Counter | 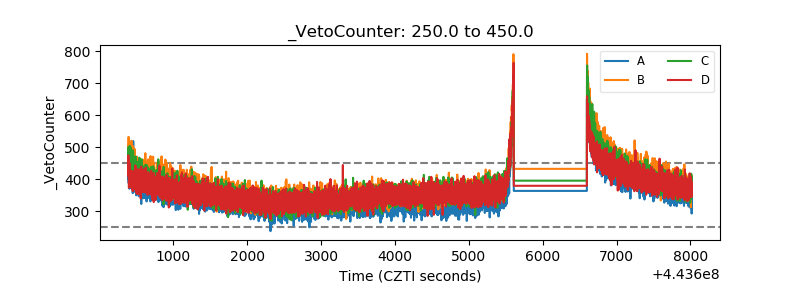 |