| Param | Original file | Final file |
|---|---|---|
| Filename | modeM0/AS1A13_044T01_9000006034_44979cztM0_level2.fits | modeM0/AS1A13_044T01_9000006034_44979cztM0_level2_quad_clean.evt |
| Size (bytes) | 537,966,720 | 110,338,560 |
| Size | 513.0 MB | 105.2 MB |
| Events in quadrant A | 5,455,434 | 746,502 |
| Events in quadrant B | 3,650,506 | 778,842 |
| Events in quadrant C | 3,065,020 | 736,155 |
| Events in quadrant D | 7,236,170 | 623,637 |
| Mode M9 | |||
|---|---|---|---|
| Quadrant | BADHDUFLAG | Total packets | Discarded packets |
| A | 0 | 16 | 0 |
| B | 0 | 17 | 0 |
| C | 0 | 17 | 0 |
| D | 0 | 17 | 0 |
| Mode M0 | |||
|---|---|---|---|
| Quadrant | BADHDUFLAG | Total packets | Discarded packets |
| A | 0 | 20941 | 2 |
| B | 0 | 15053 | 2 |
| C | 0 | 13608 | 2 |
| D | 0 | 26127 | 2 |
| Mode SS | |||
|---|---|---|---|
| Quadrant | BADHDUFLAG | Total packets | Discarded packets |
| A | 0 | 132 | 0 |
| B | 0 | 132 | 0 |
| C | 0 | 132 | 0 |
| D | 0 | 132 | 0 |
| Quadrant | Total seconds | Saturated seconds | Saturation percentage |
|---|---|---|---|
| A | 6538 | 198 | 3.028449% |
| B | 6538 | 153 | 2.340165% |
| C | 6538 | 43 | 0.657693% |
| D | 6537 | 717 | 10.968334% |
Noise dominated data is calculated using 1-second bins in cleaned event files. If a bin has >2000 counts, and if more than 50% of those come from <1% of pixels, then it is considered to be noise-dominated and hence unusable.
| Quadrant | # 1 sec bins | Bins with >0 counts | Bins with >2000 counts | High rate bins dominated by noise | Noise dominated (total time) | Noise dominated (detector-on time) | Marked lightcurve |
|---|---|---|---|---|---|---|---|
| A | 7643 | 6539 | 6 | 6 | 0.08% | 0.09% | 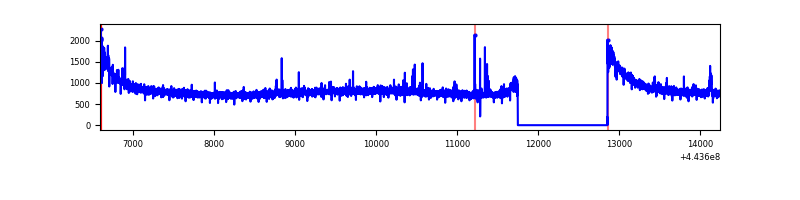 |
| B | 7643 | 6538 | 37 | 37 | 0.48% | 0.57% | 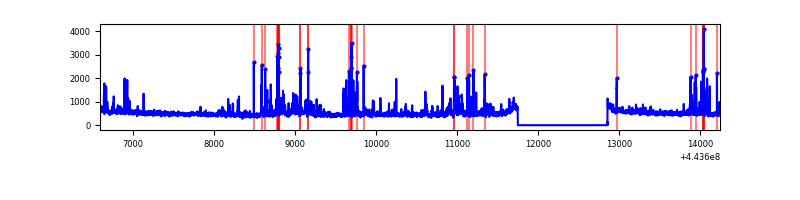 |
| C | 7643 | 6538 | 4 | 4 | 0.05% | 0.06% | 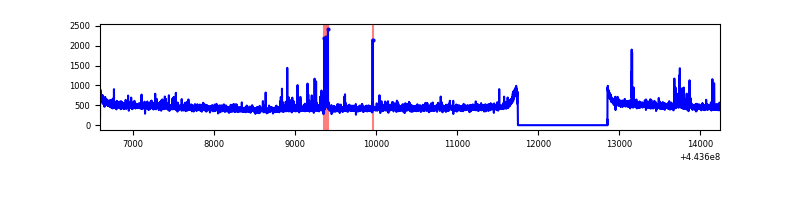 |
| D | 7642 | 6538 | 598 | 598 | 7.83% | 9.15% | 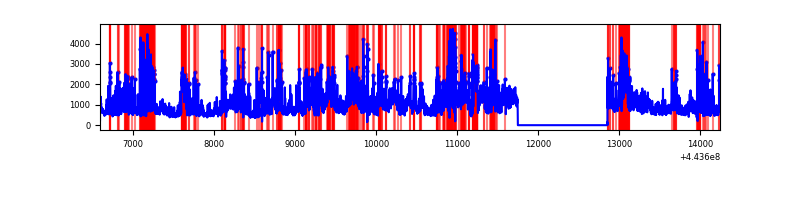 |
Top three noisy pixels from each quadrant. If the there are fewer than three noisy pixels in the level2.evt file, extra rows are filled as -1
| Pixel properties | Quadrant properties | ||||||
|---|---|---|---|---|---|---|---|
| Quadrant | DetID | PixID | Counts | Sigma | Mean | Median | Sigma |
| A | 10 | 83 | 2386853 | 14862.83 | 774 | 758 | 160.5 |
| A | 7 | 3 | 30623 | 186.03 | 774 | 758 | 160.5 |
| A | 2 | 79 | 19280 | 115.37 | 774 | 758 | 160.5 |
| B | 5 | 255 | 213884 | 1399.91 | 768 | 745 | 152.3 |
| B | 4 | 171 | 119912 | 782.7 | 768 | 745 | 152.3 |
| B | 5 | 172 | 46661 | 301.58 | 768 | 745 | 152.3 |
| C | 15 | 208 | 44472 | 248.02 | 751 | 755 | 176.3 |
| C | 1 | 3 | 29860 | 165.12 | 751 | 755 | 176.3 |
| C | 12 | 249 | 27896 | 153.98 | 751 | 755 | 176.3 |
| D | 11 | 241 | 1885039 | 10323.69 | 726 | 702 | 182.5 |
| D | 13 | 249 | 1016863 | 5567.23 | 726 | 702 | 182.5 |
| D | 13 | 187 | 629932 | 3447.35 | 726 | 702 | 182.5 |
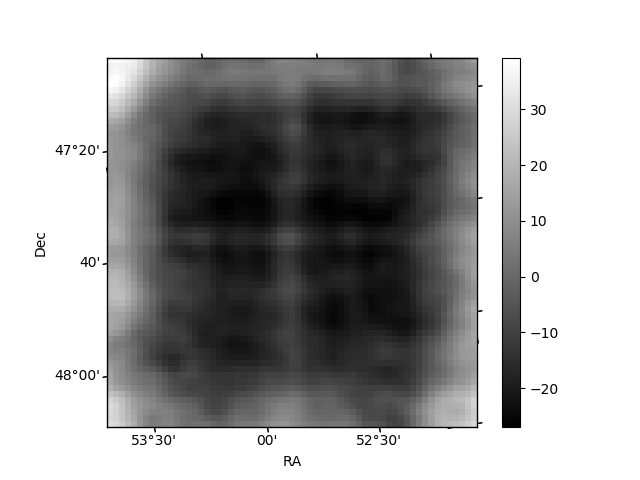
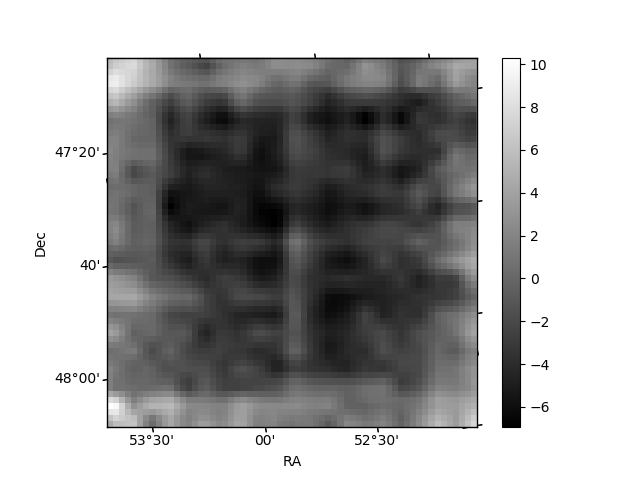
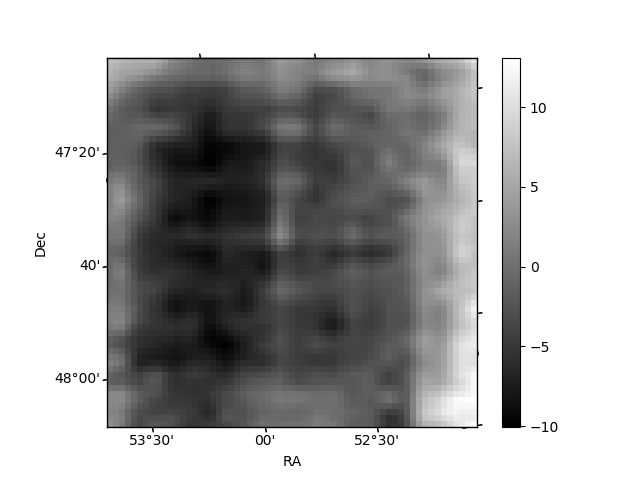
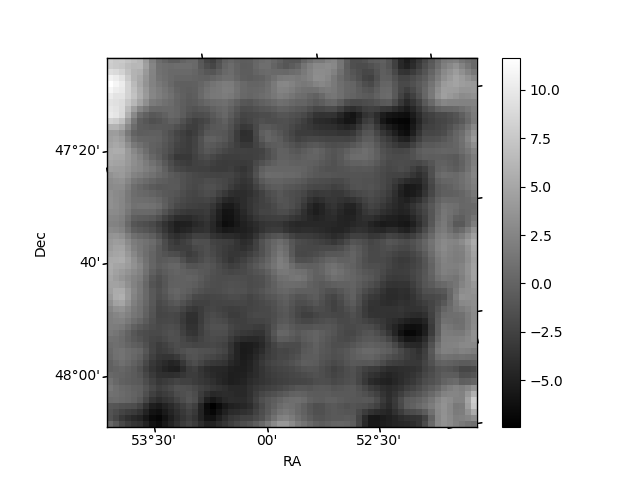
Histogram calculated using DETX and DETY for each event in the final _common_clean file
| Quadrant A | 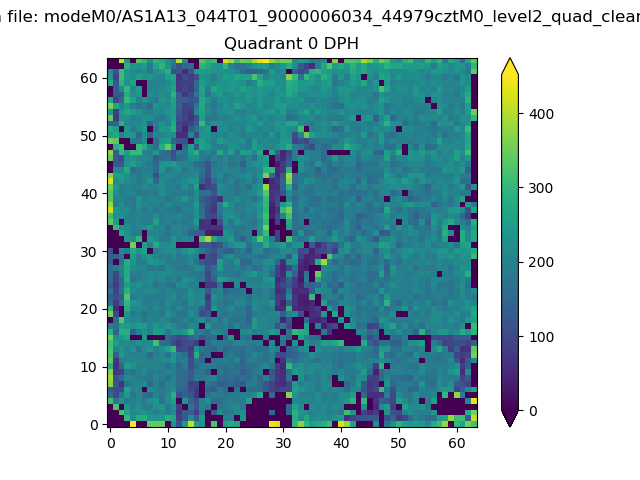 |
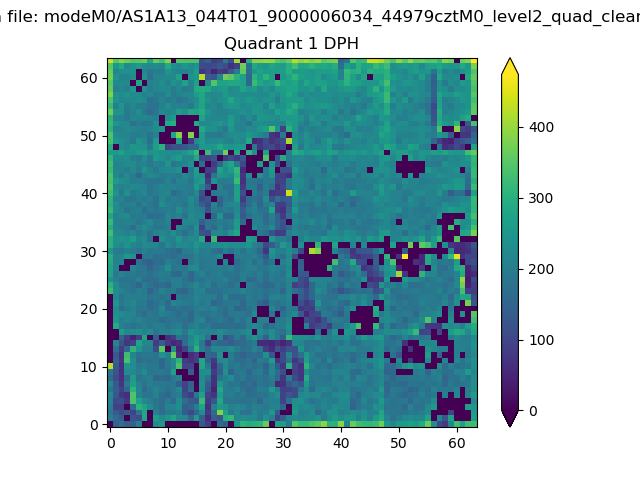 |
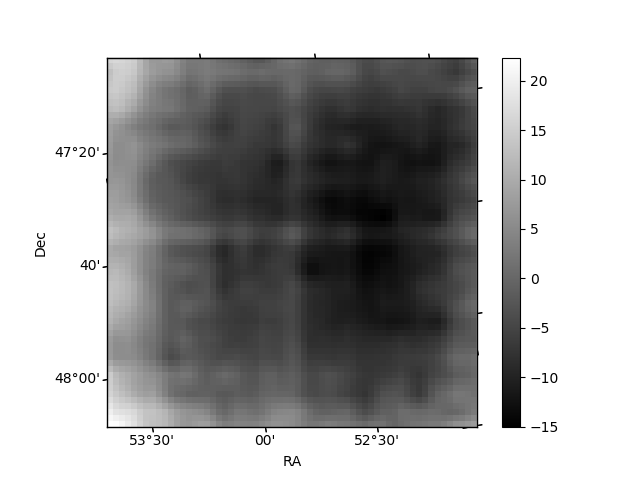
Quadrant B |
|---|---|---|---|
| Quadrant D | 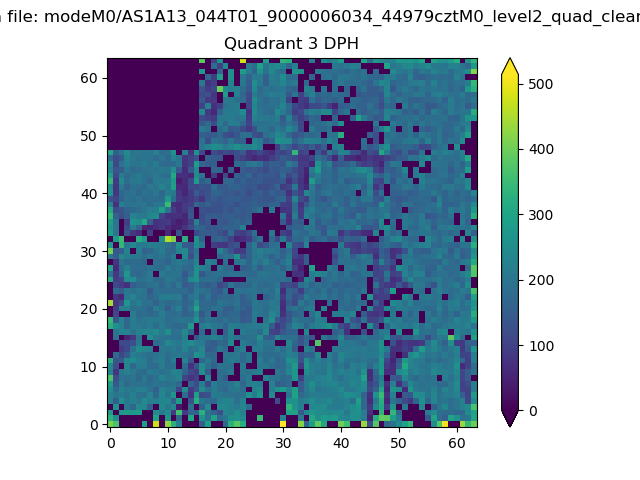 |
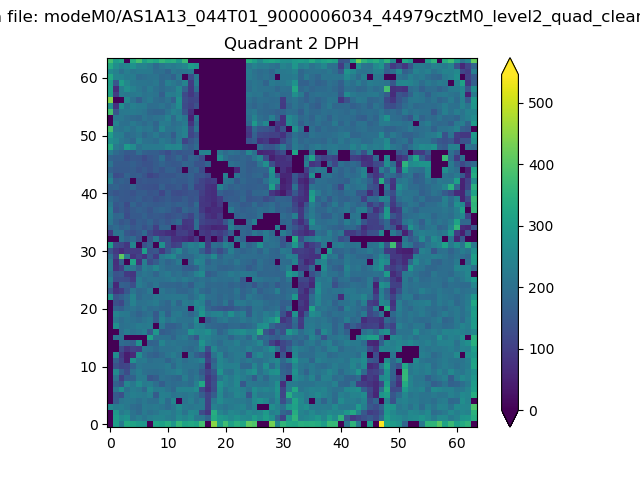 |
Quadrant C |
| Plot type | Count rate plots | Images |
|---|---|---|
| Comparison with Poisson distribution Blue bars denote a histogram of data divided into 1 sec bins. Red curve is a Poisson curve with rate = median count rate of data. |
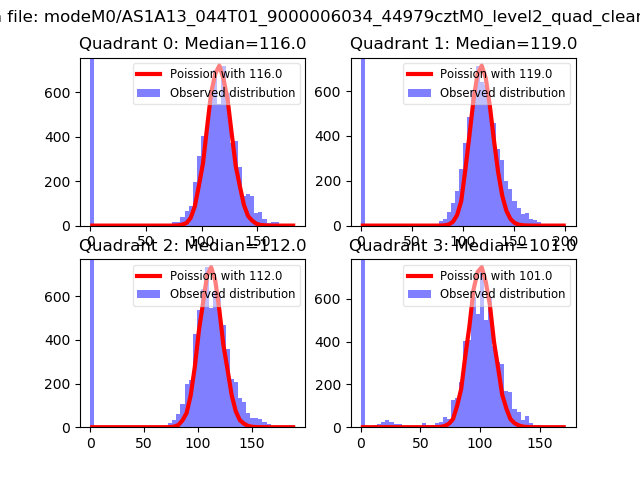 |
 |
| Quadrant-wise count rates Data is divided into 100 sec bins |
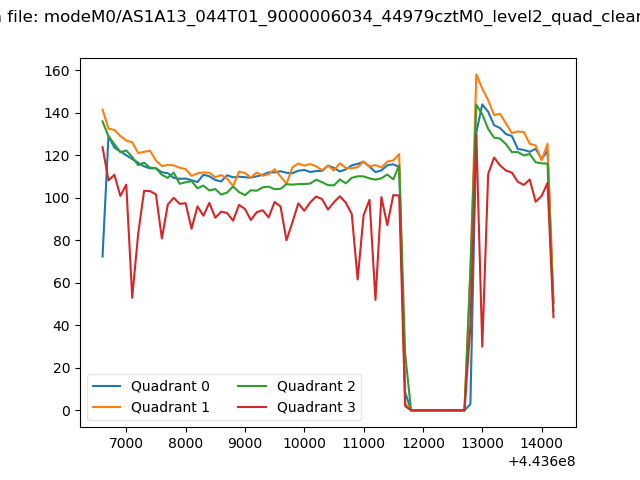 |
|
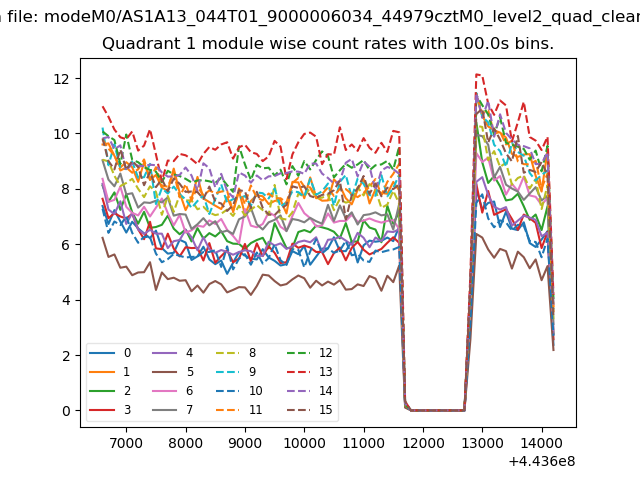
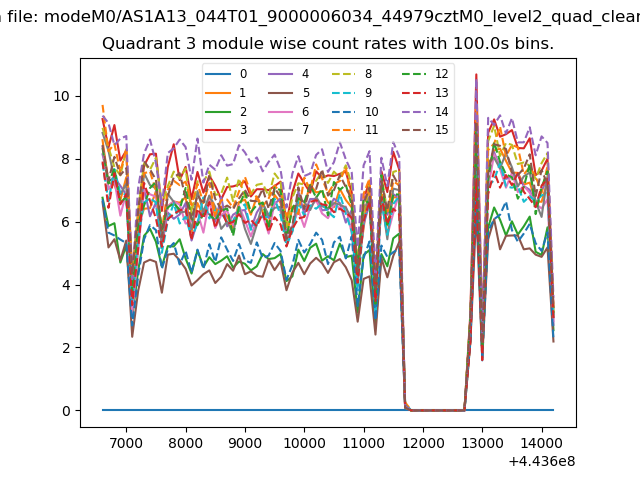
| Module-wise count rates for Quadrant A Data is divided into 100 sec bins |
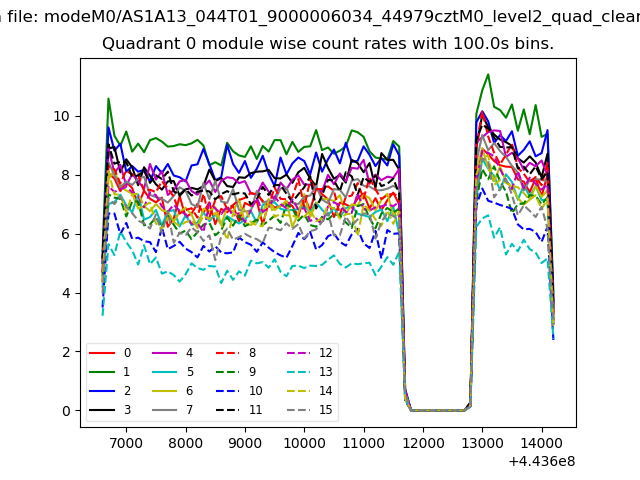 |
 |
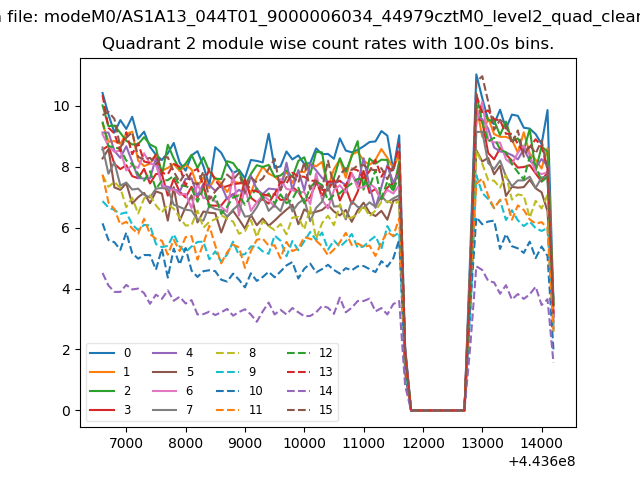
| Module-wise count rates for Quadrant B Data is divided into 100 sec bins |
 |
 |
| Module-wise count rates for Quadrant C Data is divided into 100 sec bins |
 |
 |
| Module-wise count rates for Quadrant D Data is divided into 100 sec bins |
 |
 |
| Parameter | Plot |
|---|---|
| CZT HV Monitor | 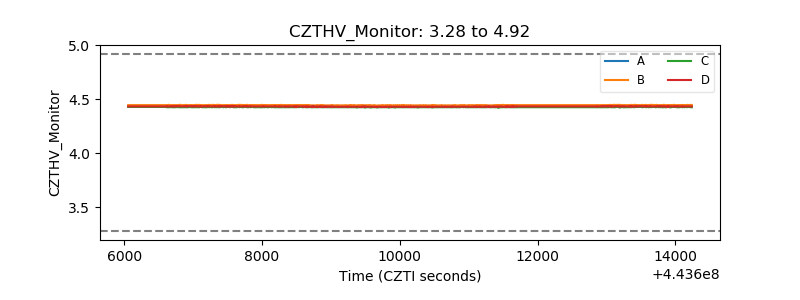 |
| D_VDD | 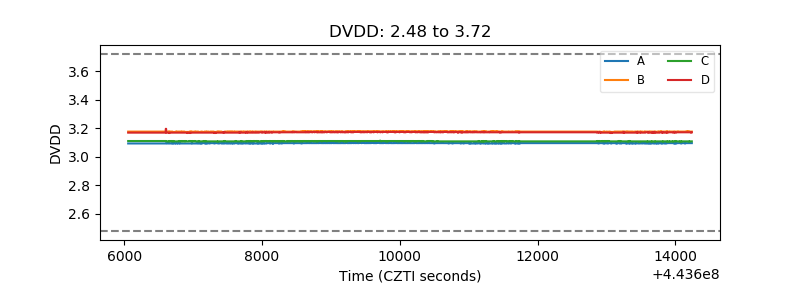 |
| Temperature 1 | 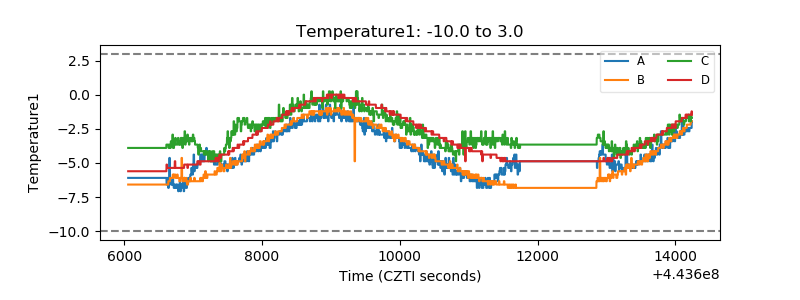 |
| Veto HV Monitor | 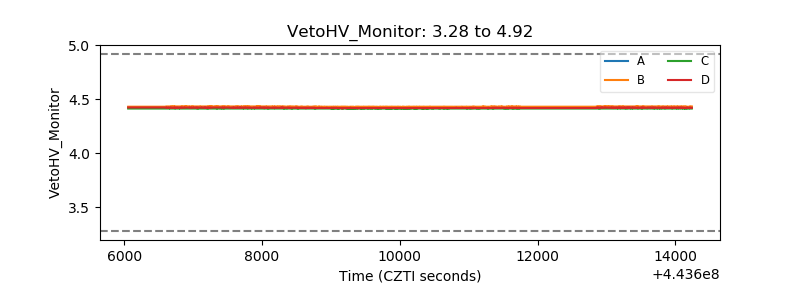 |
| Veto LLD | 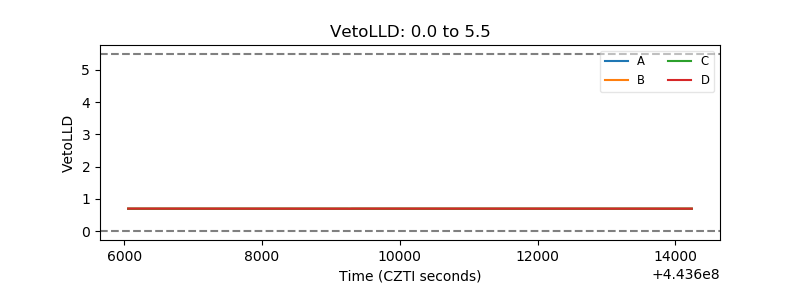 |
| Alpha Counter | 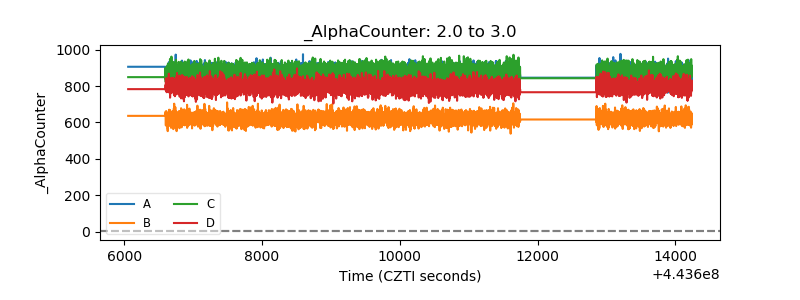 |
| _CPM_Rate | 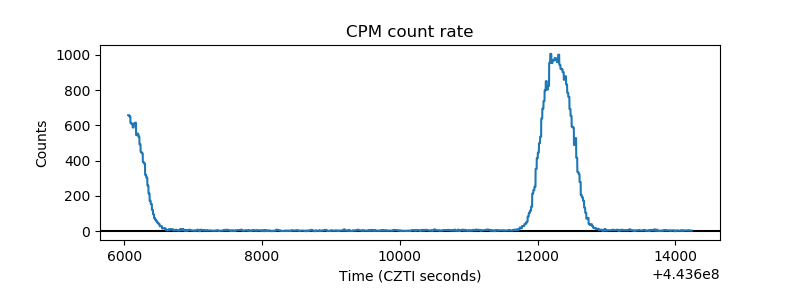 |
| CZT Counter | 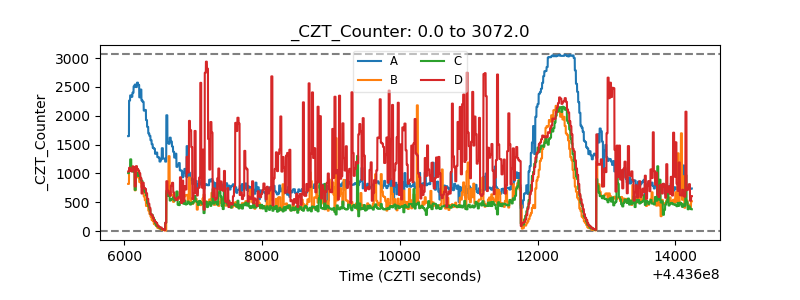 |
| +2.5 Volts monitor | 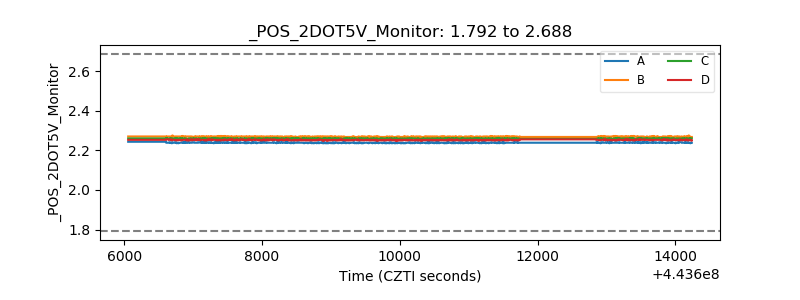 |
| +5 Volts monitor | 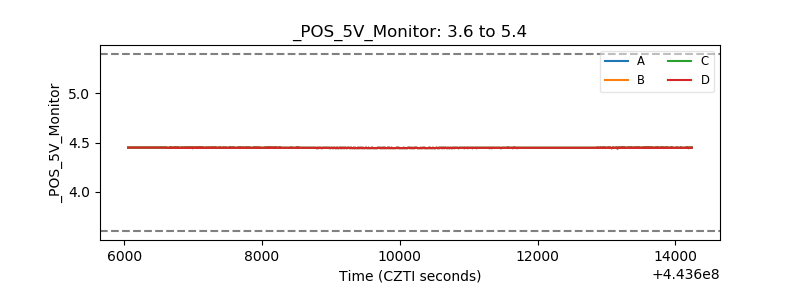 |
| _ROLL_ROT | 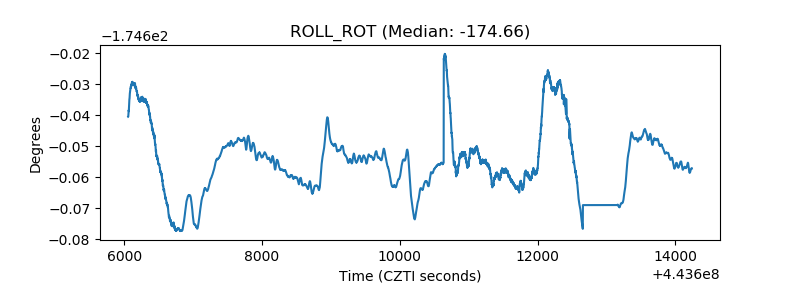 |
| _Roll_DEC | 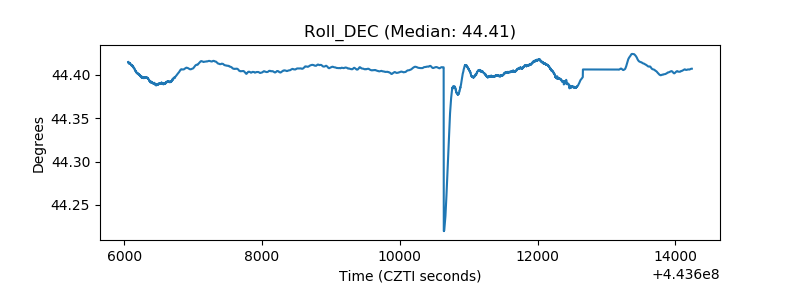 |
| _Roll_RA | 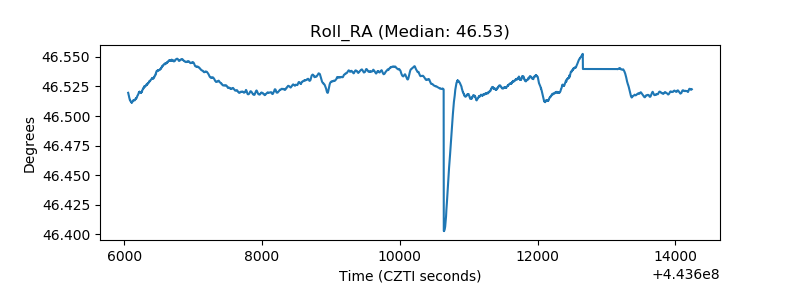 |
| Veto Counter | 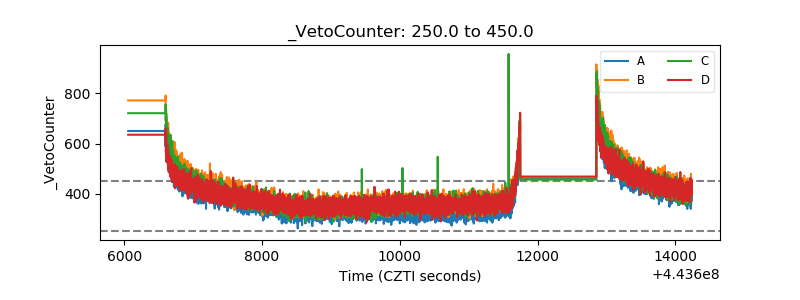 |