| Param | Original file | Final file |
|---|---|---|
| Filename | modeM0/AS1A13_044T01_9000006034_44981cztM0_level2.fits | modeM0/AS1A13_044T01_9000006034_44981cztM0_level2_quad_clean.evt |
| Size (bytes) | 535,916,160 | 112,717,440 |
| Size | 511.1 MB | 107.5 MB |
| Events in quadrant A | 5,572,414 | 778,214 |
| Events in quadrant B | 3,686,923 | 807,659 |
| Events in quadrant C | 3,102,557 | 756,569 |
| Events in quadrant D | 6,986,350 | 629,174 |
| Mode M9 | |||
|---|---|---|---|
| Quadrant | BADHDUFLAG | Total packets | Discarded packets |
| A | 0 | 17 | 0 |
| B | 0 | 18 | 0 |
| C | 0 | 18 | 0 |
| D | 0 | 18 | 0 |
| Mode M0 | |||
|---|---|---|---|
| Quadrant | BADHDUFLAG | Total packets | Discarded packets |
| A | 0 | 20590 | 2 |
| B | 0 | 15066 | 2 |
| C | 0 | 13429 | 2 |
| D | 0 | 25327 | 2 |
| Mode SS | |||
|---|---|---|---|
| Quadrant | BADHDUFLAG | Total packets | Discarded packets |
| A | 0 | 130 | 0 |
| B | 0 | 130 | 0 |
| C | 0 | 130 | 0 |
| D | 0 | 130 | 0 |
| Quadrant | Total seconds | Saturated seconds | Saturation percentage |
|---|---|---|---|
| A | 6320 | 266 | 4.208861% |
| B | 6320 | 168 | 2.658228% |
| C | 6320 | 60 | 0.949367% |
| D | 6320 | 833 | 13.180380% |
Noise dominated data is calculated using 1-second bins in cleaned event files. If a bin has >2000 counts, and if more than 50% of those come from <1% of pixels, then it is considered to be noise-dominated and hence unusable.
| Quadrant | # 1 sec bins | Bins with >0 counts | Bins with >2000 counts | High rate bins dominated by noise | Noise dominated (total time) | Noise dominated (detector-on time) | Marked lightcurve |
|---|---|---|---|---|---|---|---|
| A | 7545 | 6321 | 13 | 13 | 0.17% | 0.21% | 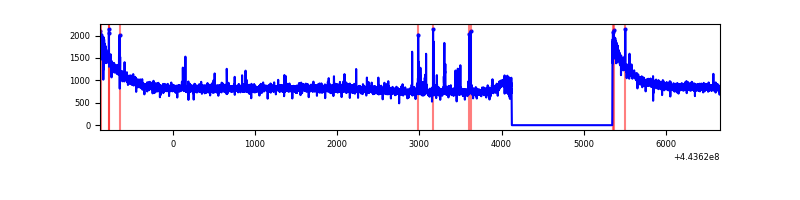 |
| B | 7545 | 6321 | 41 | 41 | 0.54% | 0.65% | 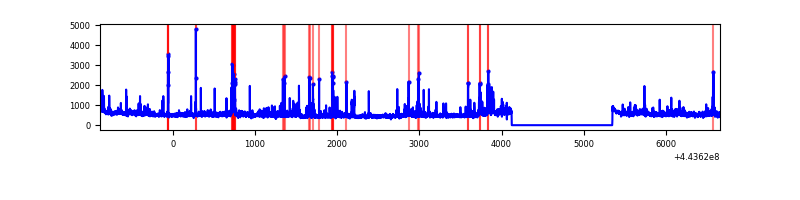 |
| C | 7545 | 6321 | 10 | 10 | 0.13% | 0.16% | 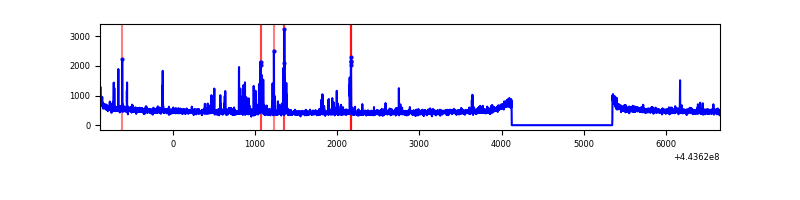 |
| D | 7545 | 6321 | 615 | 615 | 8.15% | 9.73% | 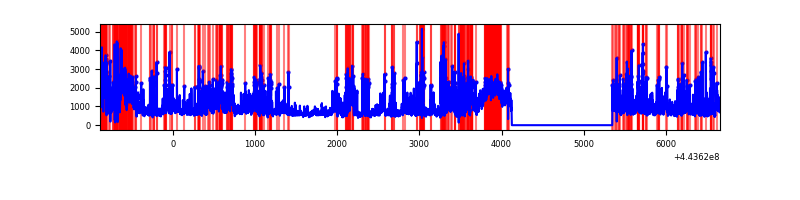 |
Top three noisy pixels from each quadrant. If the there are fewer than three noisy pixels in the level2.evt file, extra rows are filled as -1
| Pixel properties | Quadrant properties | ||||||
|---|---|---|---|---|---|---|---|
| Quadrant | DetID | PixID | Counts | Sigma | Mean | Median | Sigma |
| A | 10 | 83 | 2469972 | 15402.41 | 779 | 763 | 160.3 |
| A | 7 | 3 | 37978 | 232.14 | 779 | 763 | 160.3 |
| A | 13 | 248 | 21861 | 131.6 | 779 | 763 | 160.3 |
| B | 5 | 255 | 211266 | 1411.84 | 770 | 750 | 149.1 |
| B | 0 | 168 | 81712 | 542.98 | 770 | 750 | 149.1 |
| B | 0 | 155 | 67593 | 448.29 | 770 | 750 | 149.1 |
| C | 14 | 254 | 68547 | 390.21 | 750 | 755 | 173.7 |
| C | 15 | 208 | 40414 | 228.28 | 750 | 755 | 173.7 |
| C | 12 | 249 | 16687 | 91.71 | 750 | 755 | 173.7 |
| D | 13 | 187 | 1031618 | 5603.65 | 725 | 700 | 184.0 |
| D | 11 | 241 | 946121 | 5138.92 | 725 | 700 | 184.0 |
| D | 13 | 249 | 810249 | 4400.38 | 725 | 700 | 184.0 |
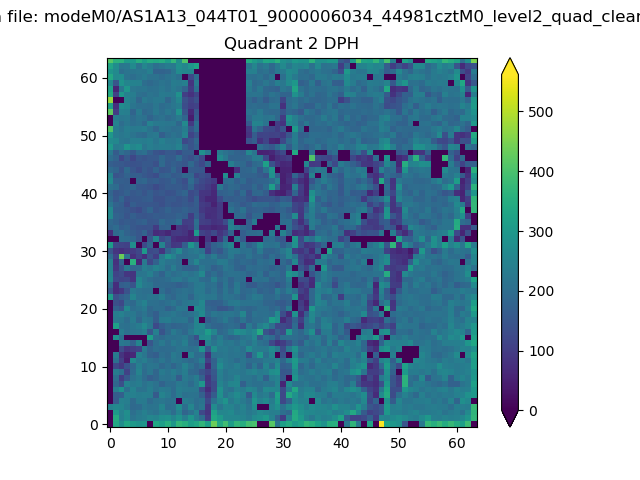
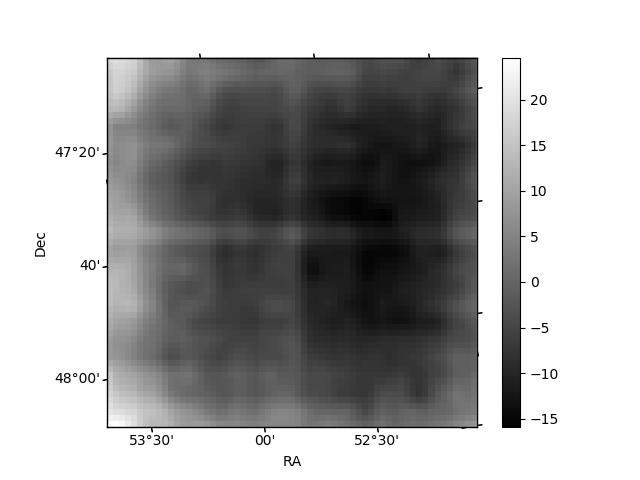
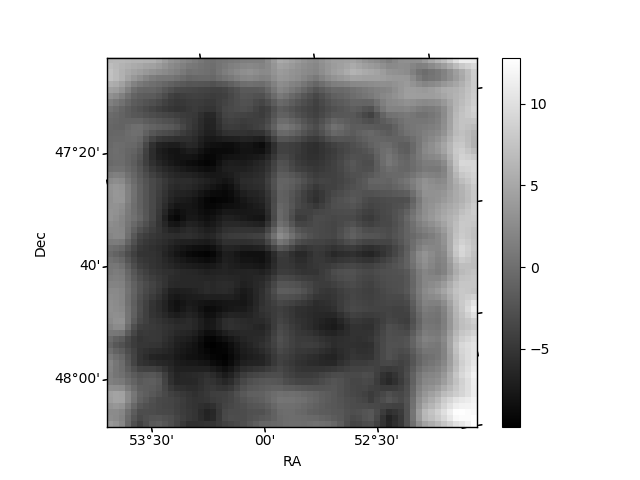
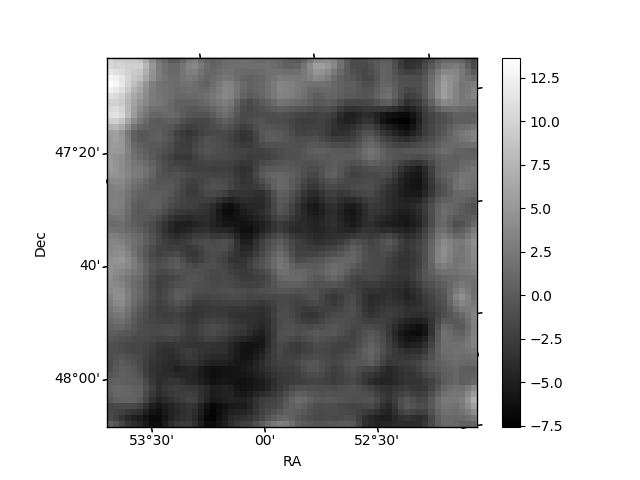
Histogram calculated using DETX and DETY for each event in the final _common_clean file
| Quadrant A | 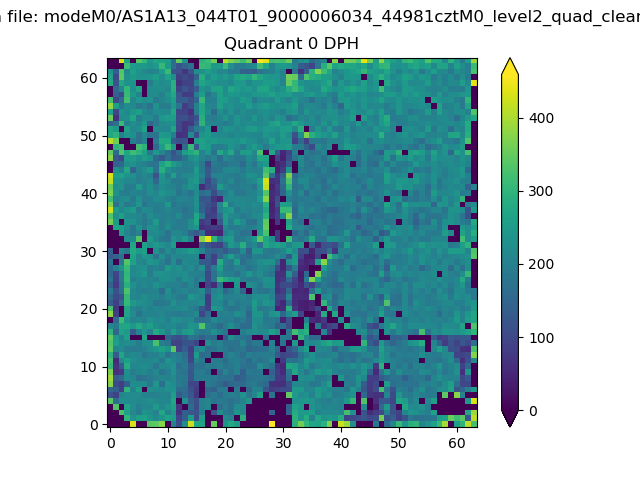 |
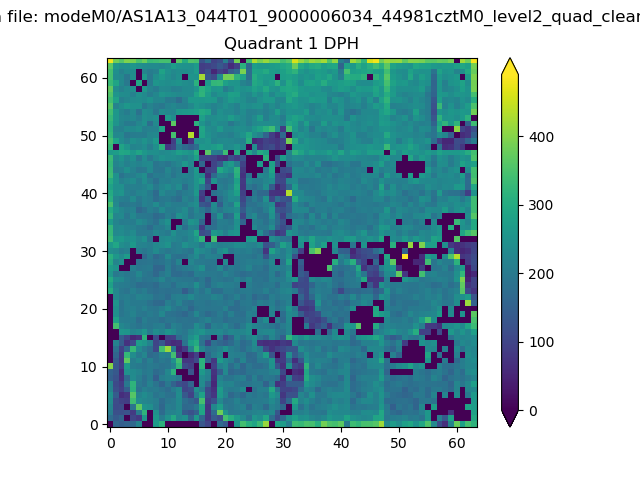 |
Quadrant B |
|---|---|---|---|
| Quadrant D | 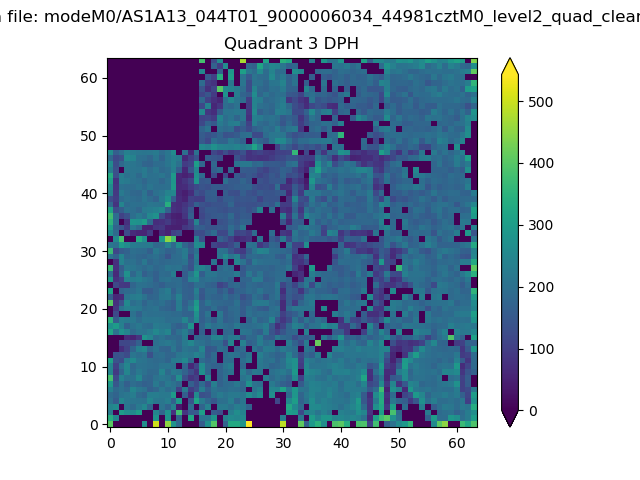 |
 |
Quadrant C |
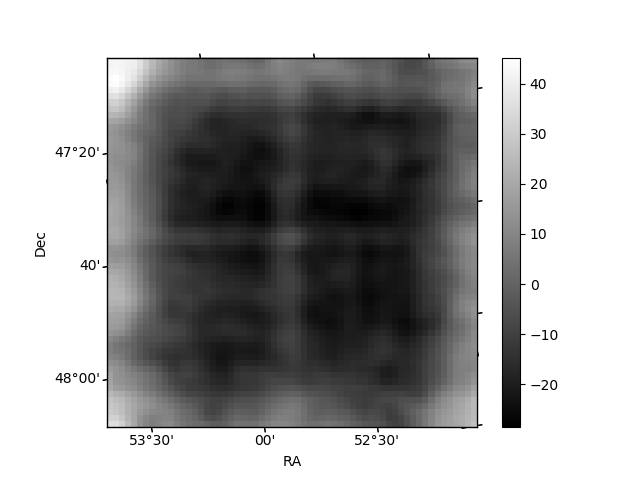
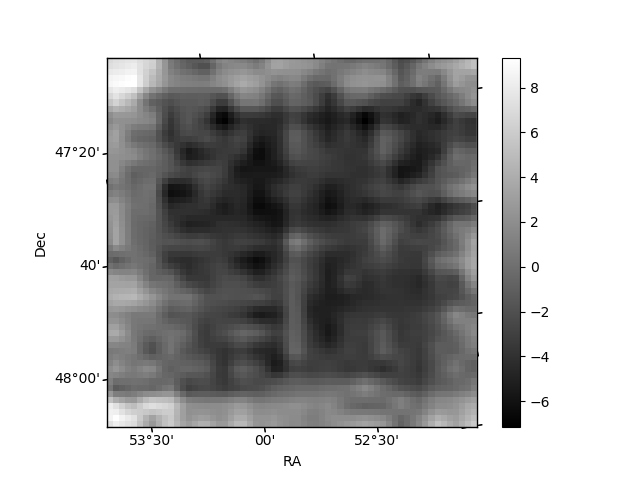
| Plot type | Count rate plots | Images |
|---|---|---|
| Comparison with Poisson distribution Blue bars denote a histogram of data divided into 1 sec bins. Red curve is a Poisson curve with rate = median count rate of data. |
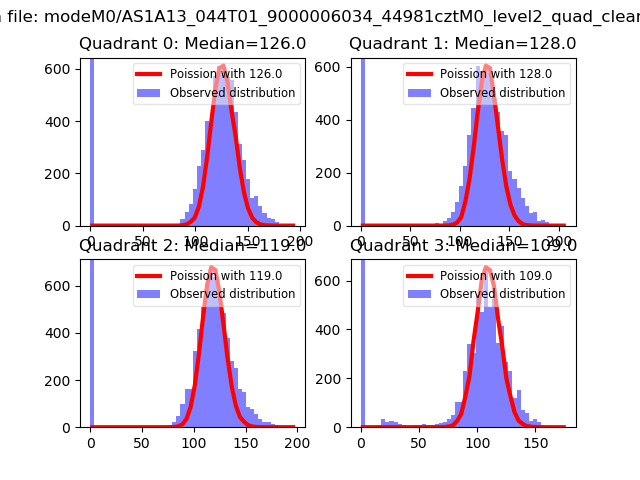 |
 |
| Quadrant-wise count rates Data is divided into 100 sec bins |
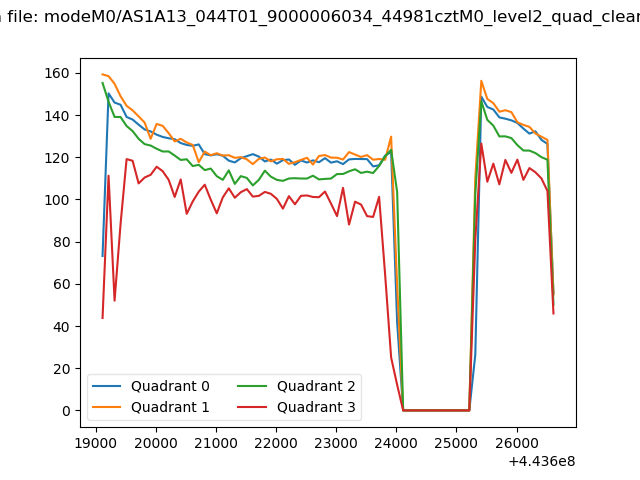 |
|
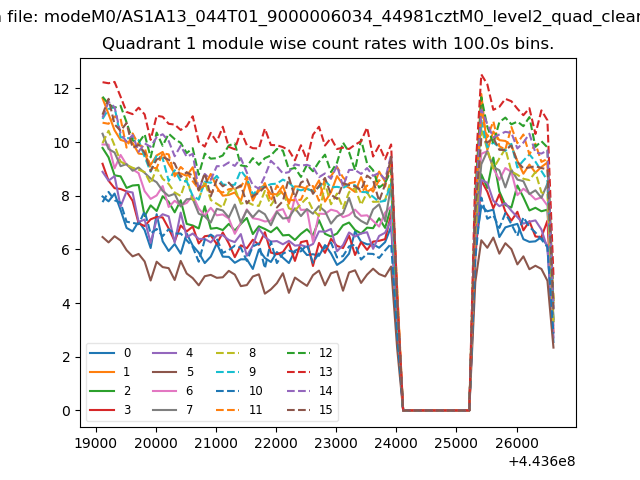
| Module-wise count rates for Quadrant A Data is divided into 100 sec bins |
 |
 |
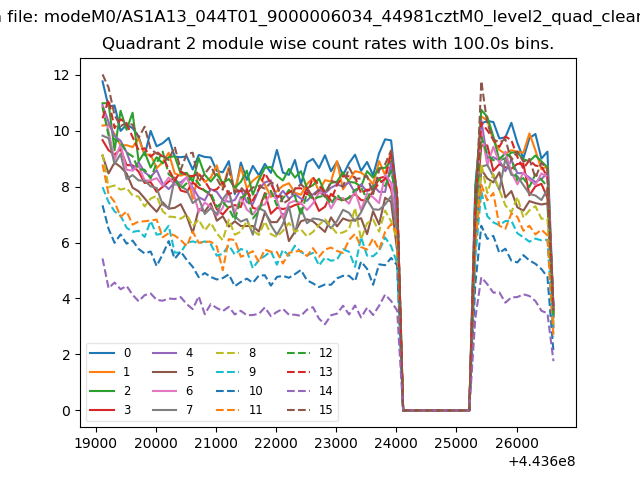
| Module-wise count rates for Quadrant B Data is divided into 100 sec bins |
 |
 |
| Module-wise count rates for Quadrant C Data is divided into 100 sec bins |
 |
 |
| Module-wise count rates for Quadrant D Data is divided into 100 sec bins |
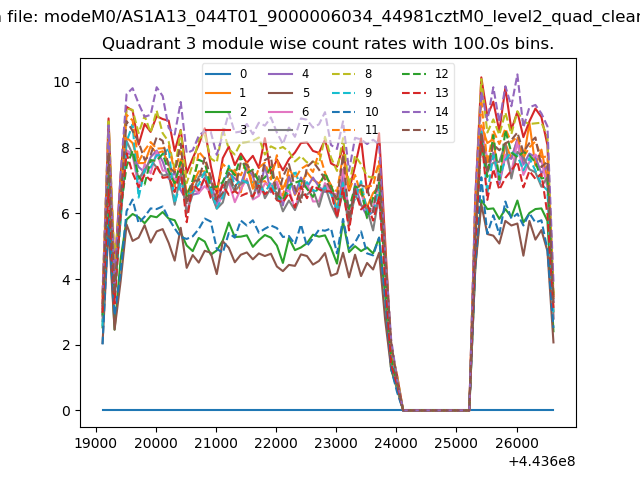 |
 |
| Parameter | Plot |
|---|---|
| CZT HV Monitor | 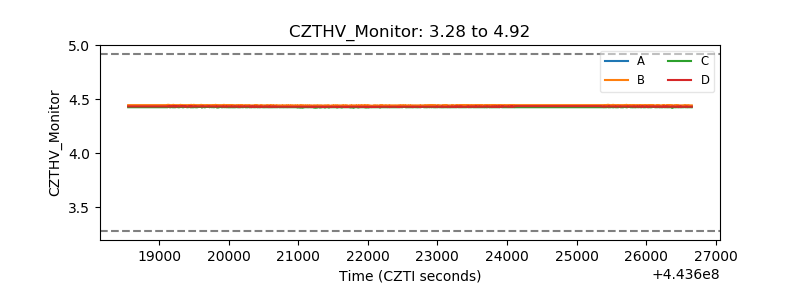 |
| D_VDD | 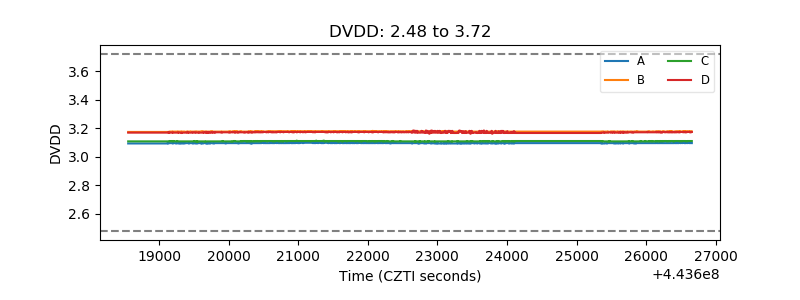 |
| Temperature 1 | 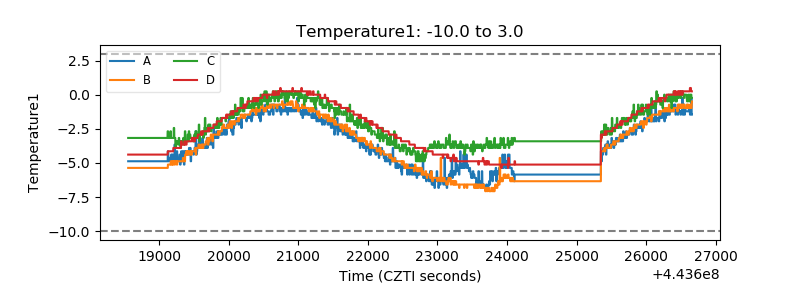 |
| Veto HV Monitor | 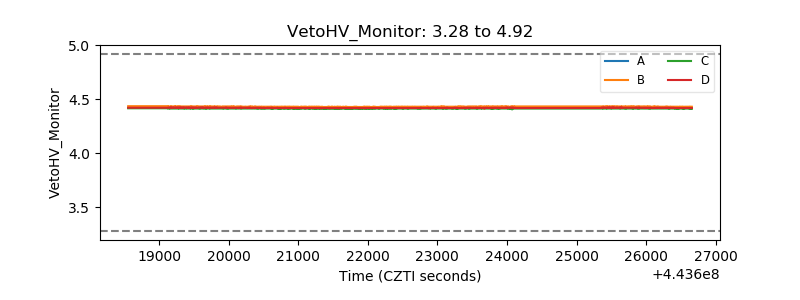 |
| Veto LLD | 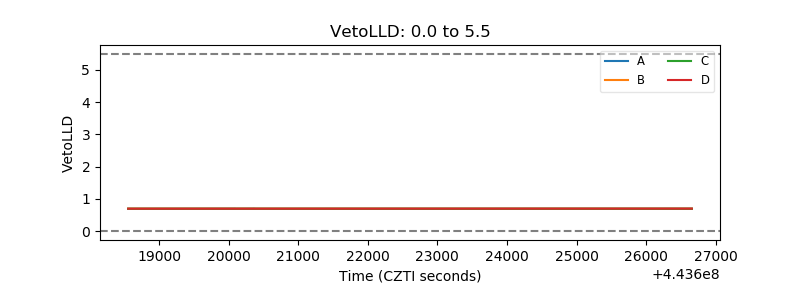 |
| Alpha Counter | 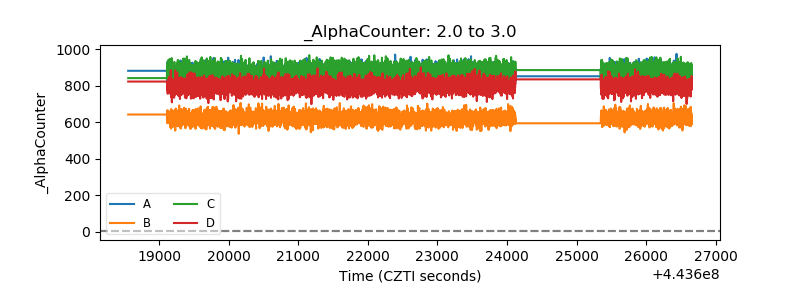 |
| _CPM_Rate | 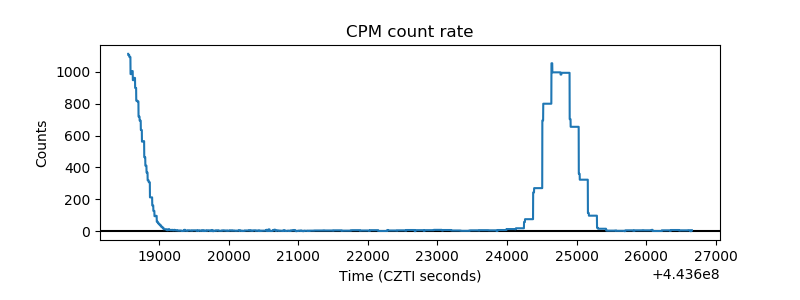 |
| CZT Counter | 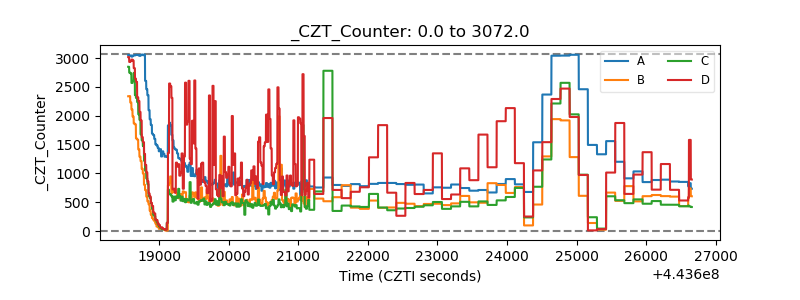 |
| +2.5 Volts monitor | 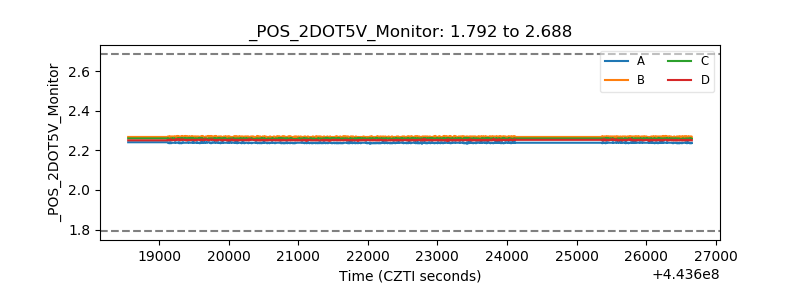 |
| +5 Volts monitor | 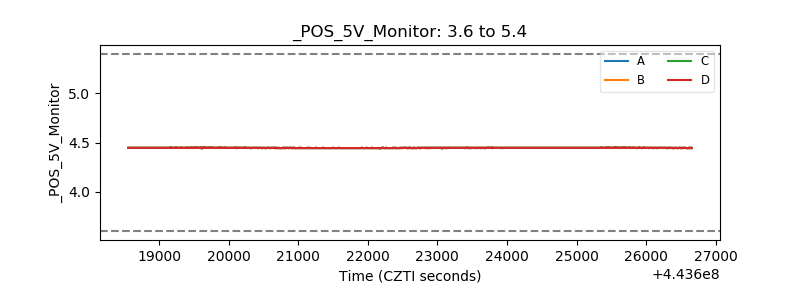 |
| _ROLL_ROT | 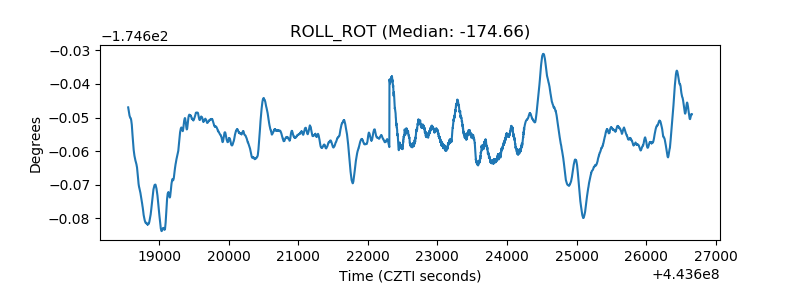 |
| _Roll_DEC | 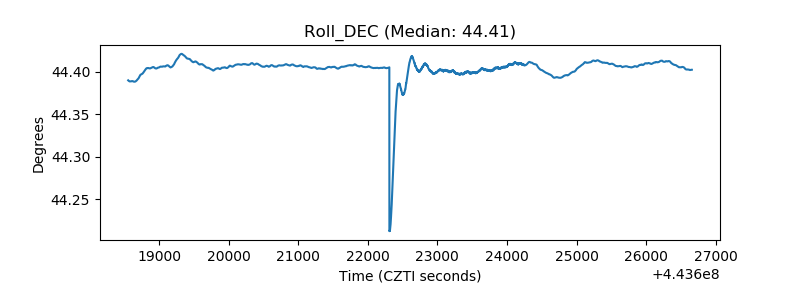 |
| _Roll_RA | 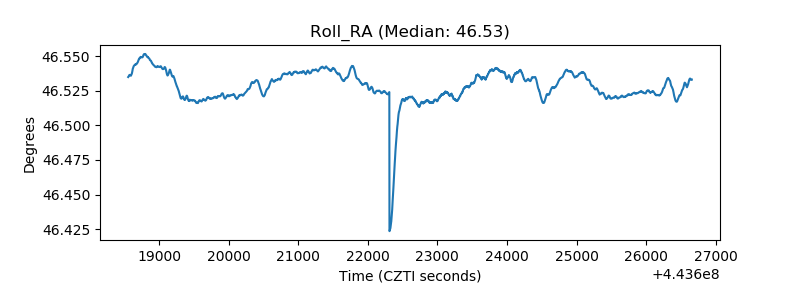 |
| Veto Counter | 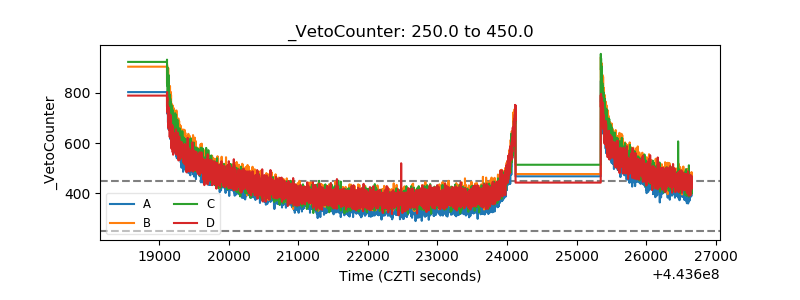 |