| Param | Original file | Final file |
|---|---|---|
| Filename | modeM0/AS1A13_044T01_9000006034_44982cztM0_level2.fits | modeM0/AS1A13_044T01_9000006034_44982cztM0_level2_quad_clean.evt |
| Size (bytes) | 248,423,040 | 52,272,000 |
| Size | 236.9 MB | 49.9 MB |
| Events in quadrant A | 2,454,237 | 367,211 |
| Events in quadrant B | 1,495,351 | 368,631 |
| Events in quadrant C | 1,364,490 | 341,182 |
| Events in quadrant D | 3,652,082 | 296,147 |
| Mode M0 | |||
|---|---|---|---|
| Quadrant | BADHDUFLAG | Total packets | Discarded packets |
| A | 0 | 9070 | 0 |
| B | 0 | 6352 | 0 |
| C | 0 | 6103 | 0 |
| D | 0 | 12945 | 0 |
| Mode SS | |||
|---|---|---|---|
| Quadrant | BADHDUFLAG | Total packets | Discarded packets |
| A | 0 | 60 | 0 |
| B | 0 | 60 | 0 |
| C | 0 | 60 | 0 |
| D | 0 | 60 | 0 |
| Quadrant | Total seconds | Saturated seconds | Saturation percentage |
|---|---|---|---|
| A | 2937 | 5 | 0.170242% |
| B | 2937 | 7 | 0.238338% |
| C | 2937 | 6 | 0.204290% |
| D | 2938 | 350 | 11.912866% |
Noise dominated data is calculated using 1-second bins in cleaned event files. If a bin has >2000 counts, and if more than 50% of those come from <1% of pixels, then it is considered to be noise-dominated and hence unusable.
| Quadrant | # 1 sec bins | Bins with >0 counts | Bins with >2000 counts | High rate bins dominated by noise | Noise dominated (total time) | Noise dominated (detector-on time) | Marked lightcurve |
|---|---|---|---|---|---|---|---|
| A | 2937 | 2937 | 2 | 2 | 0.07% | 0.07% | 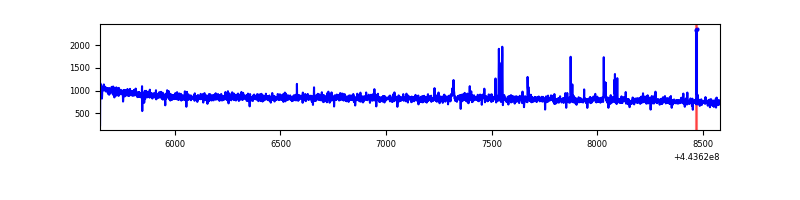 |
| B | 2937 | 2937 | 3 | 3 | 0.10% | 0.10% | 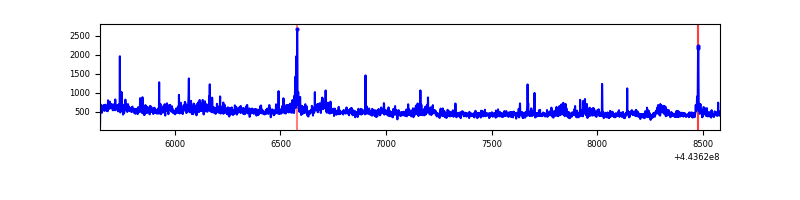 |
| C | 2937 | 2937 | 10 | 10 | 0.34% | 0.34% | 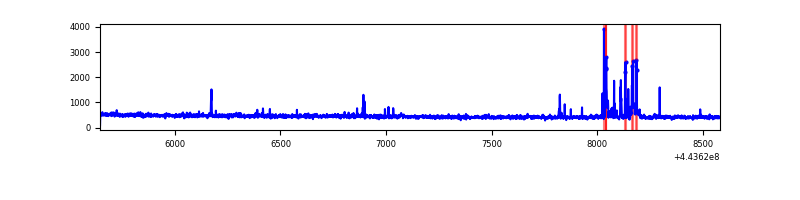 |
| D | 2938 | 2938 | 424 | 424 | 14.43% | 14.43% | 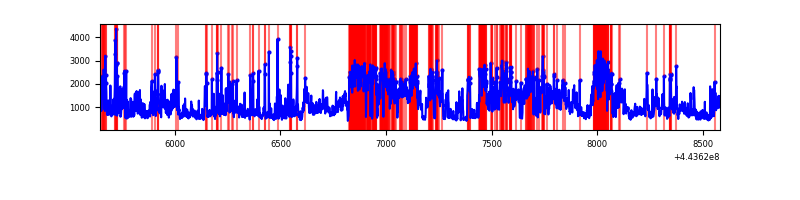 |
Top three noisy pixels from each quadrant. If the there are fewer than three noisy pixels in the level2.evt file, extra rows are filled as -1
| Pixel properties | Quadrant properties | ||||||
|---|---|---|---|---|---|---|---|
| Quadrant | DetID | PixID | Counts | Sigma | Mean | Median | Sigma |
| A | 10 | 83 | 1100933 | 15466.51 | 340 | 333 | 71.2 |
| A | 13 | 248 | 17160 | 236.46 | 340 | 333 | 71.2 |
| A | 2 | 79 | 10818 | 147.34 | 340 | 333 | 71.2 |
| B | 0 | 155 | 44624 | 671.72 | 334 | 324 | 66.0 |
| B | 0 | 168 | 33917 | 509.37 | 334 | 324 | 66.0 |
| B | 0 | 183 | 19729 | 294.24 | 334 | 324 | 66.0 |
| C | 1 | 3 | 44829 | 582.29 | 325 | 328 | 76.4 |
| C | 12 | 2 | 26739 | 345.59 | 325 | 328 | 76.4 |
| C | 14 | 254 | 13020 | 166.07 | 325 | 328 | 76.4 |
| D | 1 | 52 | 1428251 | 17142.9 | 323 | 311 | 83.3 |
| D | 11 | 241 | 258325 | 3097.55 | 323 | 311 | 83.3 |
| D | 12 | 33 | 249541 | 2992.09 | 323 | 311 | 83.3 |
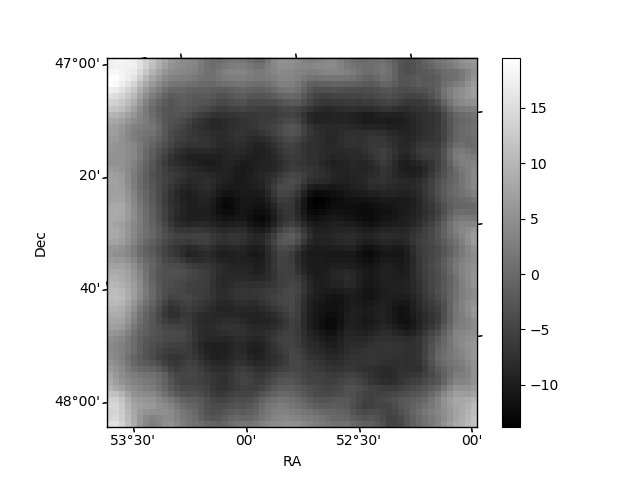
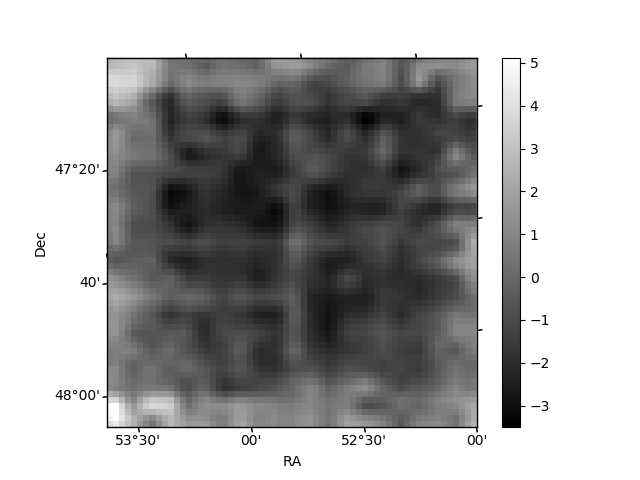
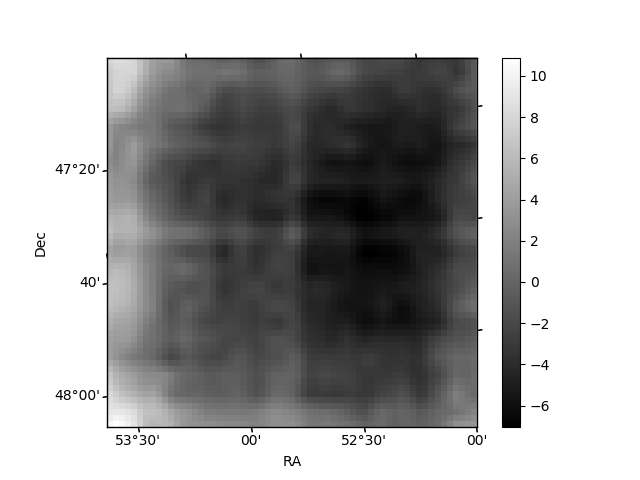
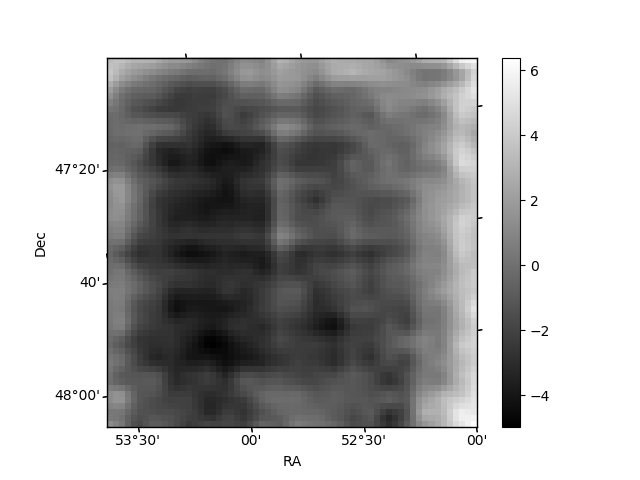
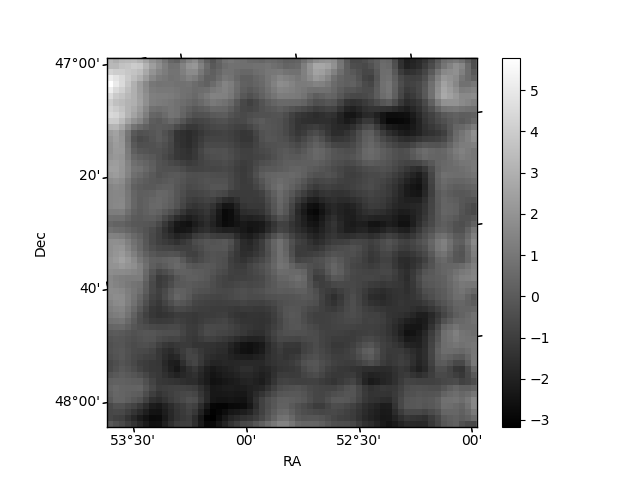
Histogram calculated using DETX and DETY for each event in the final _common_clean file
| Quadrant A | 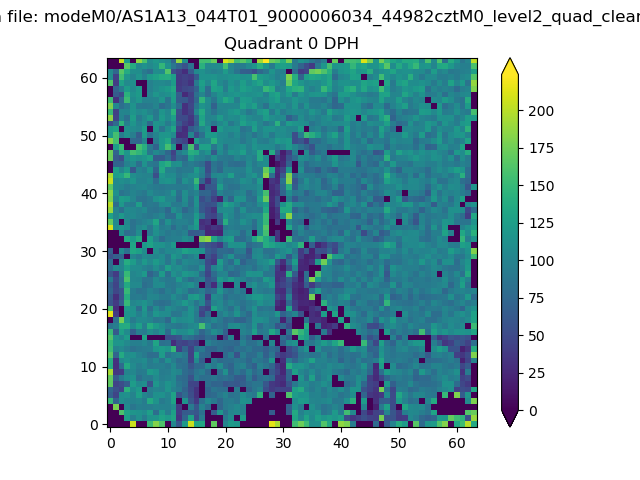 |
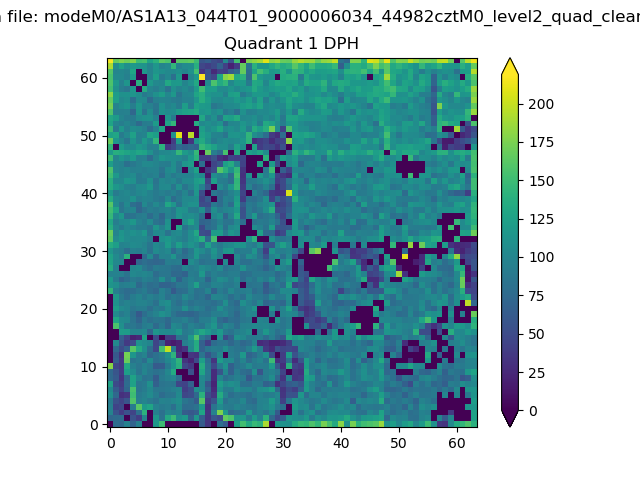 |
Quadrant B |
|---|---|---|---|
| Quadrant D | 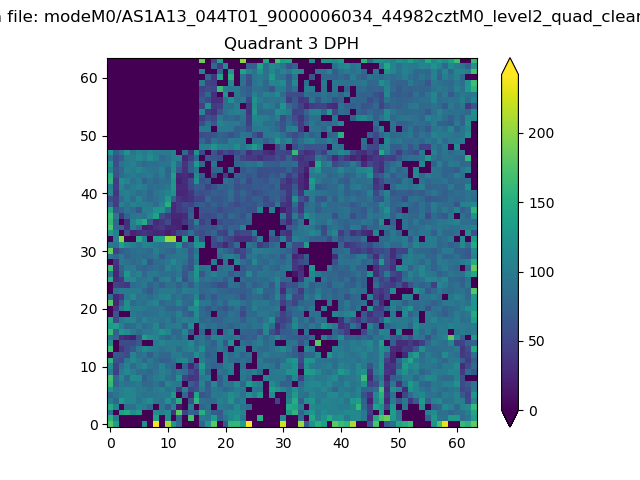 |
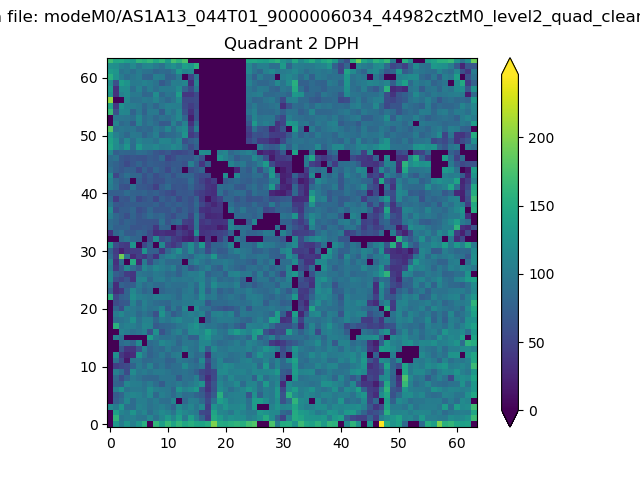 |
Quadrant C |
| Plot type | Count rate plots | Images |
|---|---|---|
| Comparison with Poisson distribution Blue bars denote a histogram of data divided into 1 sec bins. Red curve is a Poisson curve with rate = median count rate of data. |
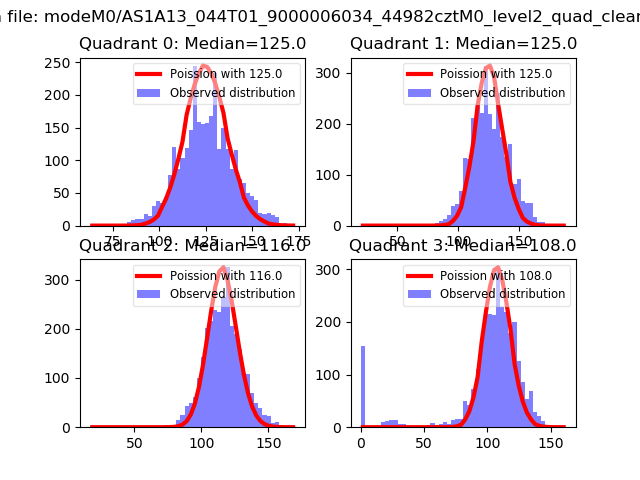 |
 |
| Quadrant-wise count rates Data is divided into 100 sec bins |
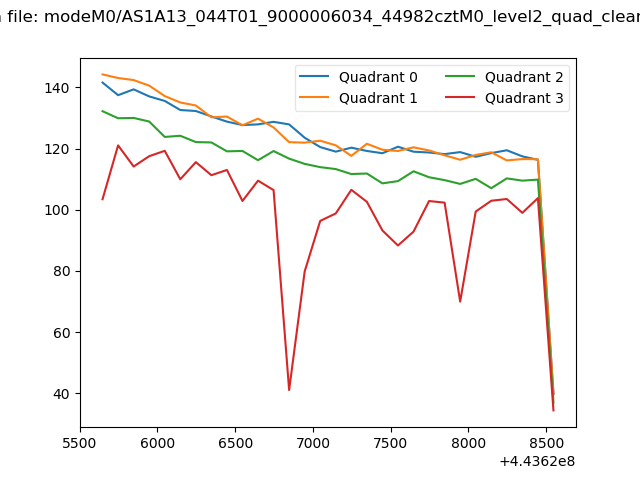 |
|
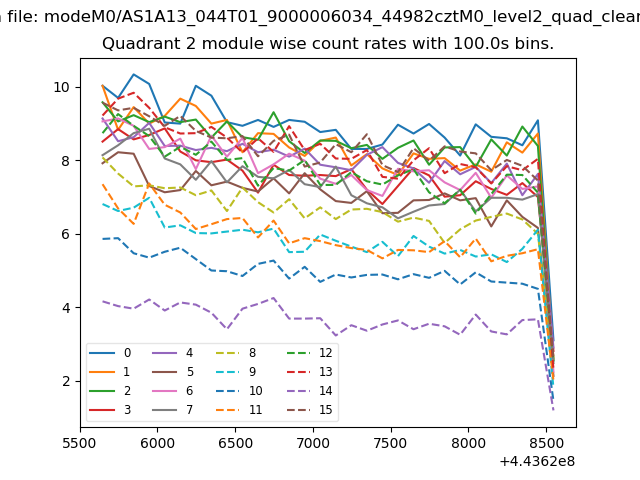
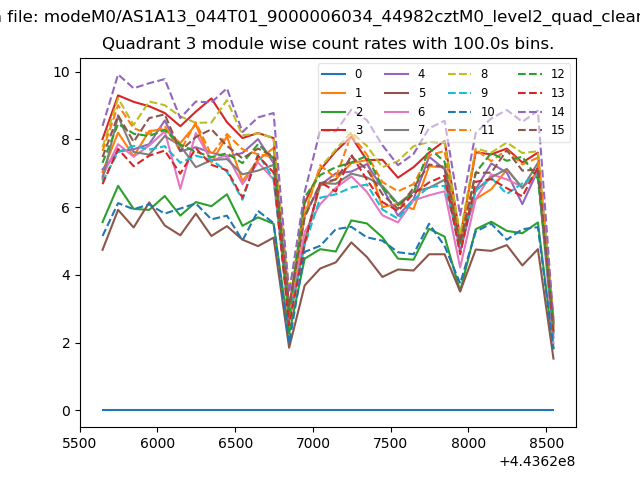
| Module-wise count rates for Quadrant A Data is divided into 100 sec bins |
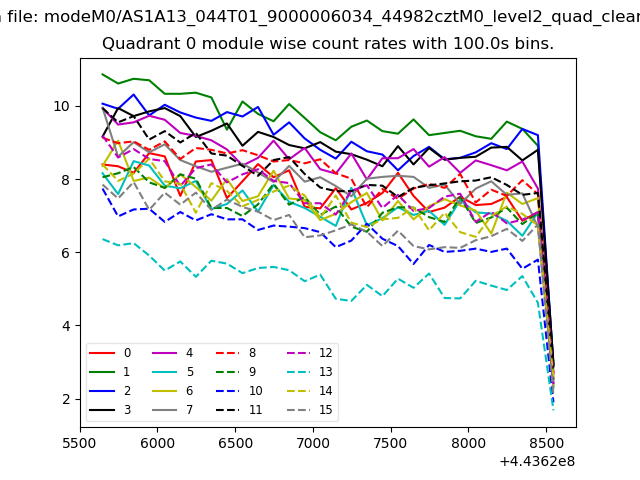 |
 |
| Module-wise count rates for Quadrant B Data is divided into 100 sec bins |
 |
 |
| Module-wise count rates for Quadrant C Data is divided into 100 sec bins |
 |
 |
| Module-wise count rates for Quadrant D Data is divided into 100 sec bins |
 |
 |
| Parameter | Plot |
|---|---|
| CZT HV Monitor |  |
| D_VDD | 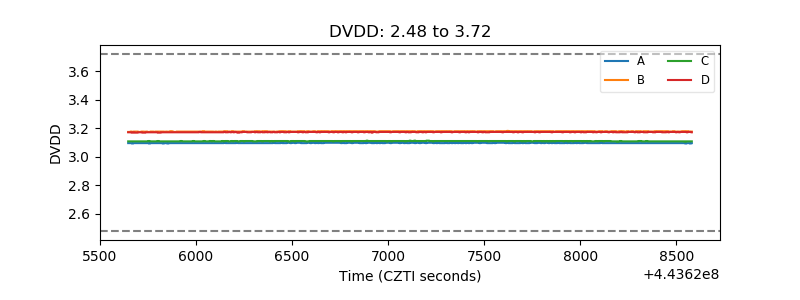 |
| Temperature 1 | 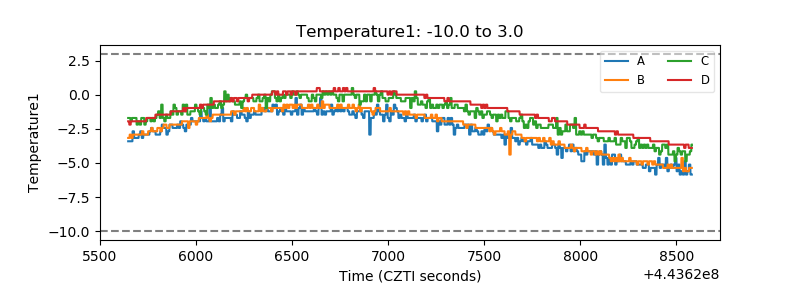 |
| Veto HV Monitor | 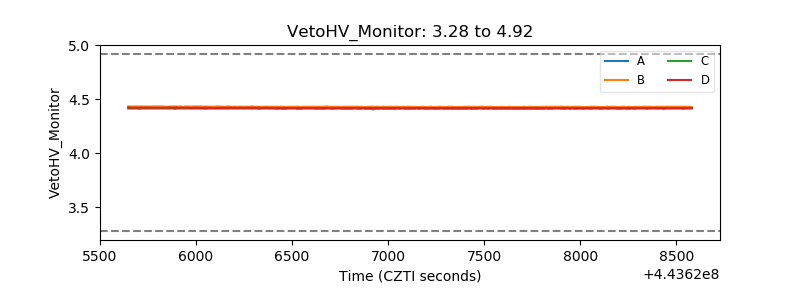 |
| Veto LLD | 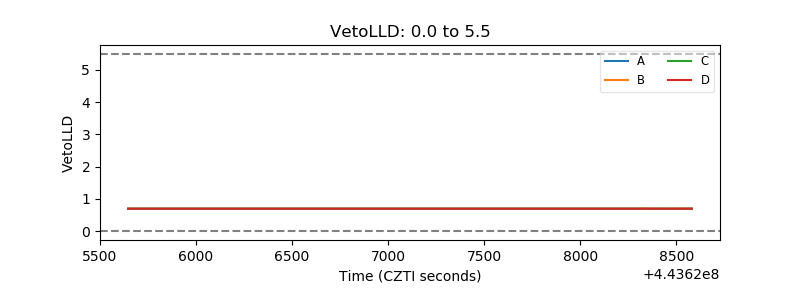 |
| Alpha Counter | 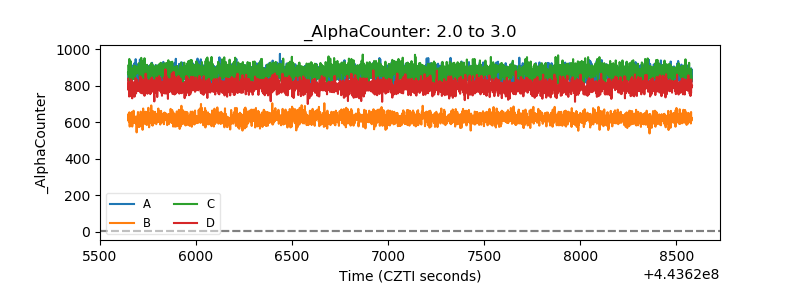 |
| _CPM_Rate | 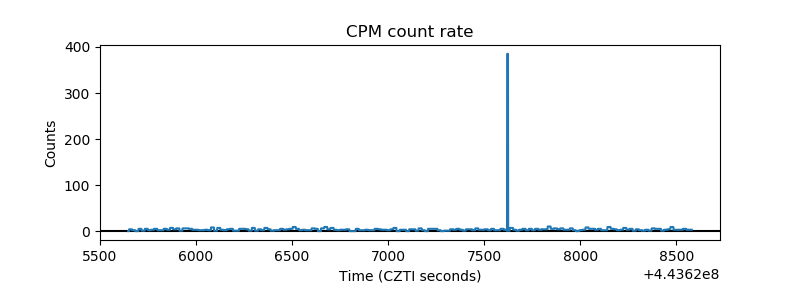 |
| CZT Counter | 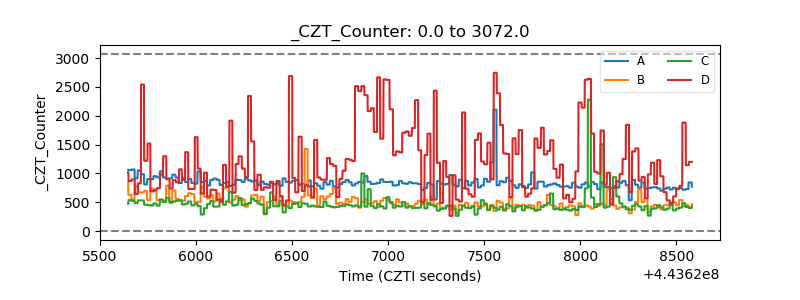 |
| +2.5 Volts monitor | 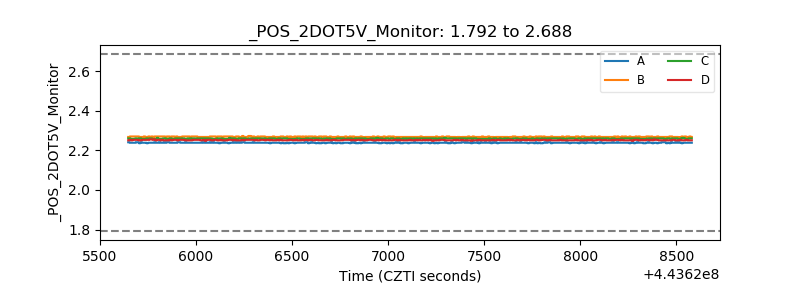 |
| +5 Volts monitor | 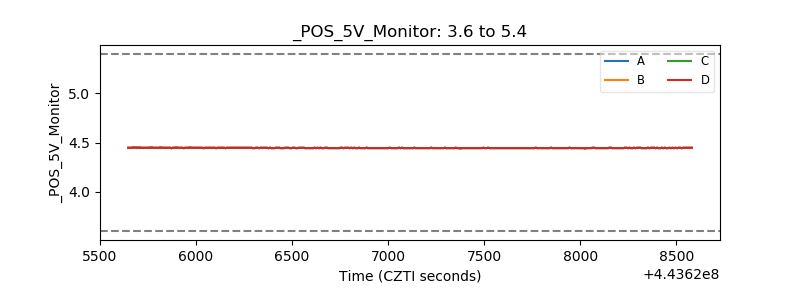 |
| _ROLL_ROT | 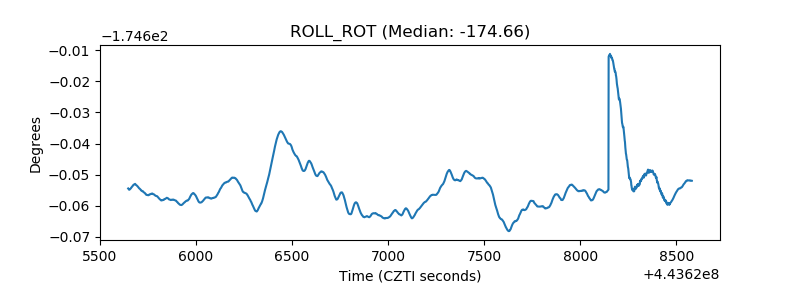 |
| _Roll_DEC | 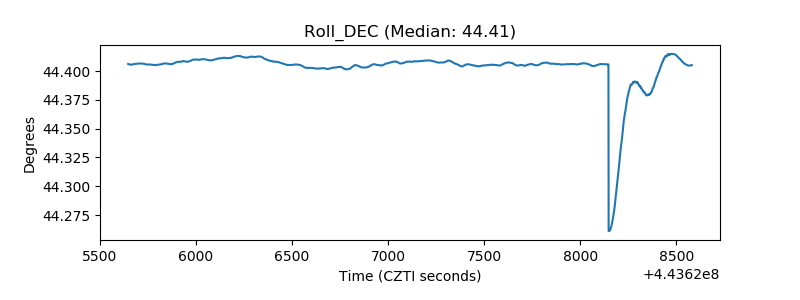 |
| _Roll_RA | 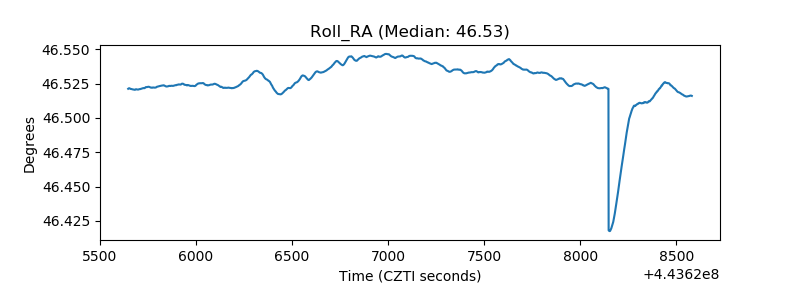 |
| Veto Counter | 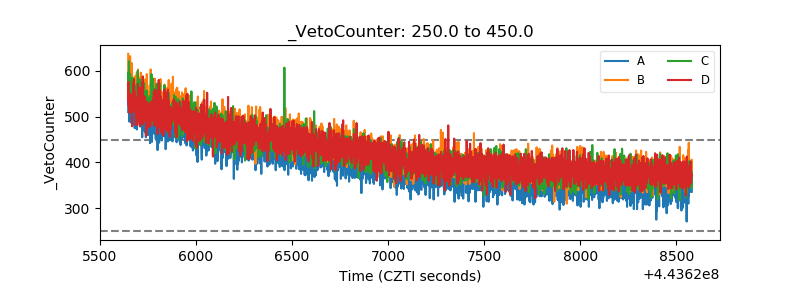 |