| Param | Original file | Final file |
|---|---|---|
| Filename | modeM0/AS1A13_044T02_9000006038_44984cztM0_level2.fits | modeM0/AS1A13_044T02_9000006038_44984cztM0_level2_quad_clean.evt |
| Size (bytes) | 262,673,280 | 40,161,600 |
| Size | 250.5 MB | 38.3 MB |
| Events in quadrant A | 2,311,577 | 282,517 |
| Events in quadrant B | 1,647,012 | 299,947 |
| Events in quadrant C | 1,289,231 | 287,273 |
| Events in quadrant D | 4,273,764 | 162,178 |
| Mode SS | |||
|---|---|---|---|
| Quadrant | BADHDUFLAG | Total packets | Discarded packets |
| A | 0 | 52 | 0 |
| B | 0 | 52 | 0 |
| C | 0 | 52 | 0 |
| D | 0 | 52 | 0 |
| Mode M9 | |||
|---|---|---|---|
| Quadrant | BADHDUFLAG | Total packets | Discarded packets |
| A | 0 | 8 | 0 |
| B | 0 | 8 | 0 |
| C | 0 | 8 | 0 |
| D | 0 | 8 | 0 |
| Mode M0 | |||
|---|---|---|---|
| Quadrant | BADHDUFLAG | Total packets | Discarded packets |
| A | 0 | 8593 | 1 |
| B | 0 | 6596 | 1 |
| C | 0 | 5542 | 1 |
| D | 0 | 14485 | 2 |
| Quadrant | Total seconds | Saturated seconds | Saturation percentage |
|---|---|---|---|
| A | 2574 | 168 | 6.526807% |
| B | 2574 | 98 | 3.807304% |
| C | 2574 | 30 | 1.165501% |
| D | 2573 | 1161 | 45.122425% |
Noise dominated data is calculated using 1-second bins in cleaned event files. If a bin has >2000 counts, and if more than 50% of those come from <1% of pixels, then it is considered to be noise-dominated and hence unusable.
| Quadrant | # 1 sec bins | Bins with >0 counts | Bins with >2000 counts | High rate bins dominated by noise | Noise dominated (total time) | Noise dominated (detector-on time) | Marked lightcurve |
|---|---|---|---|---|---|---|---|
| A | 3334 | 2575 | 1 | 1 | 0.03% | 0.04% | 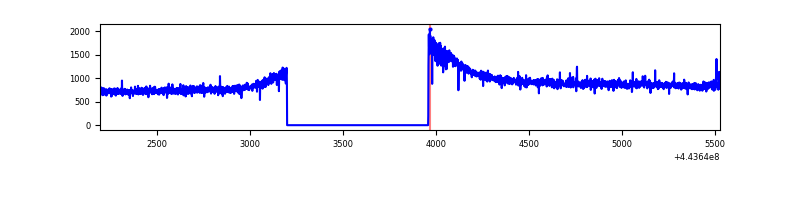 |
| B | 3334 | 2575 | 12 | 12 | 0.36% | 0.47% | 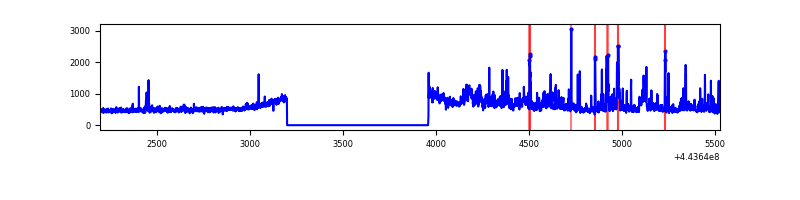 |
| C | 3334 | 2575 | 1 | 1 | 0.03% | 0.04% | 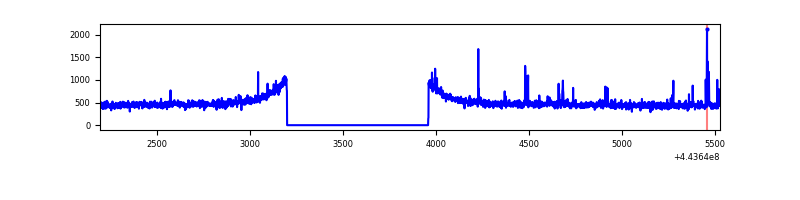 |
| D | 3333 | 2574 | 1005 | 1005 | 30.15% | 39.04% | 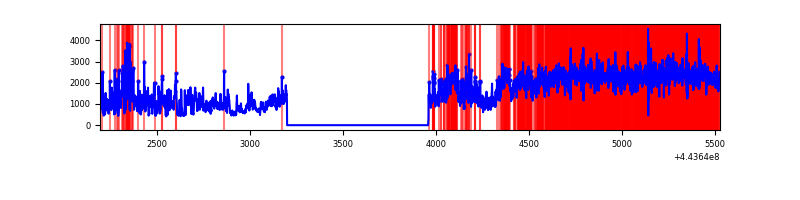 |
Top three noisy pixels from each quadrant. If the there are fewer than three noisy pixels in the level2.evt file, extra rows are filled as -1
| Pixel properties | Quadrant properties | ||||||
|---|---|---|---|---|---|---|---|
| Quadrant | DetID | PixID | Counts | Sigma | Mean | Median | Sigma |
| A | 10 | 83 | 1061297 | 15528.66 | 320 | 312 | 68.3 |
| A | 0 | 243 | 6843 | 95.59 | 320 | 312 | 68.3 |
| A | 13 | 248 | 3812 | 51.23 | 320 | 312 | 68.3 |
| B | 15 | 201 | 65030 | 993.7 | 321 | 311 | 65.1 |
| B | 0 | 168 | 56212 | 858.31 | 321 | 311 | 65.1 |
| B | 0 | 183 | 43988 | 670.62 | 321 | 311 | 65.1 |
| C | 12 | 2 | 22398 | 288.09 | 318 | 319 | 76.6 |
| C | 15 | 208 | 5014 | 61.26 | 318 | 319 | 76.6 |
| C | 12 | 249 | 4772 | 58.1 | 318 | 319 | 76.6 |
| D | 11 | 241 | 914951 | 12478.74 | 283 | 272 | 73.3 |
| D | 12 | 33 | 883717 | 12052.62 | 283 | 272 | 73.3 |
| D | 13 | 187 | 357325 | 4871.19 | 283 | 272 | 73.3 |
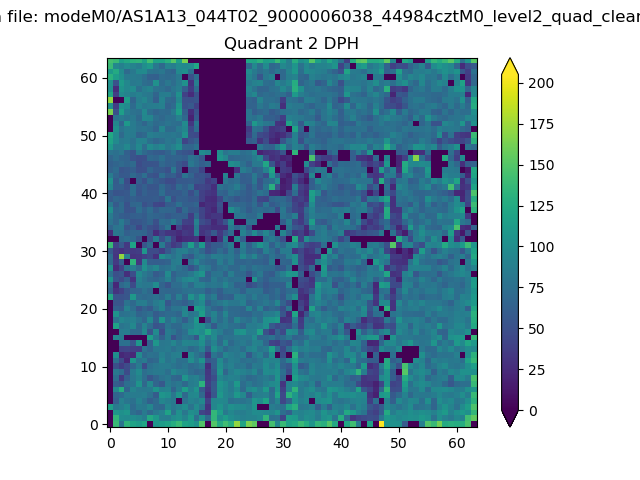
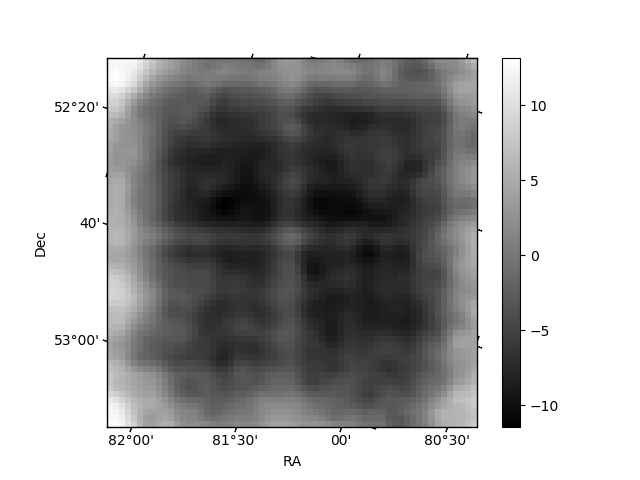
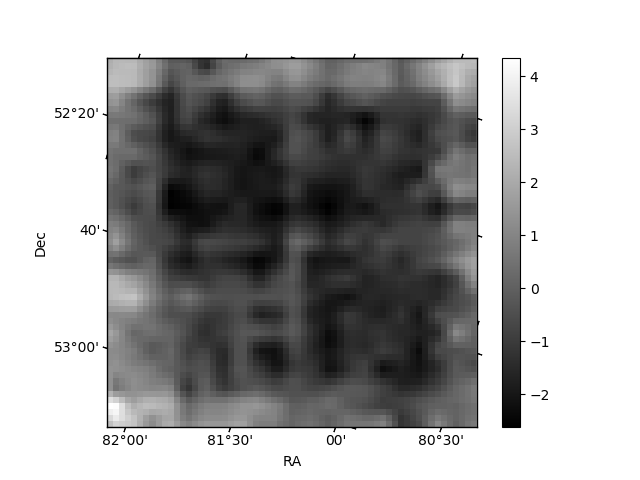
Histogram calculated using DETX and DETY for each event in the final _common_clean file
| Quadrant A | 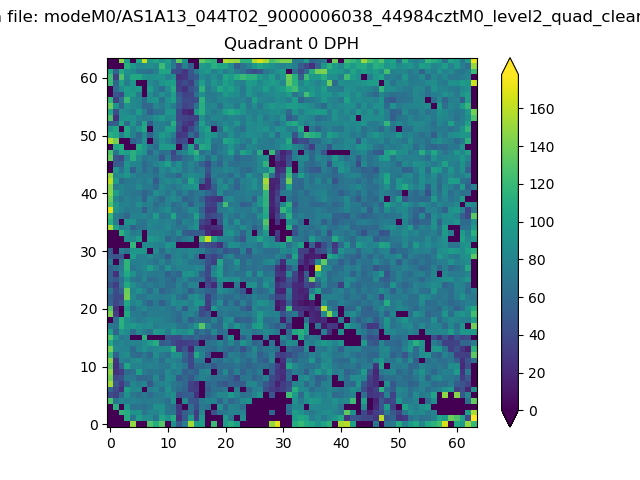 |
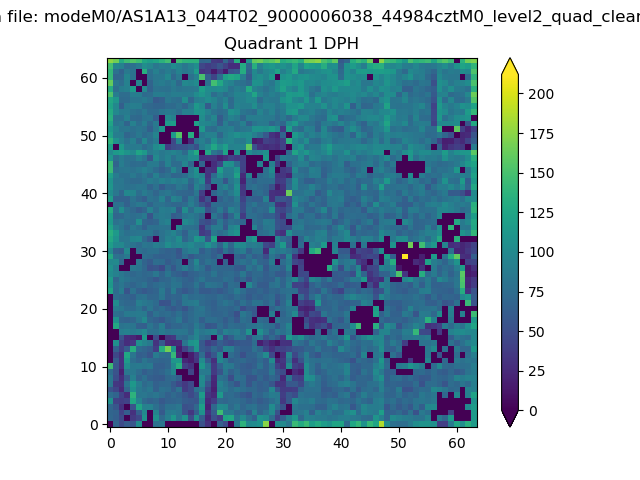 |
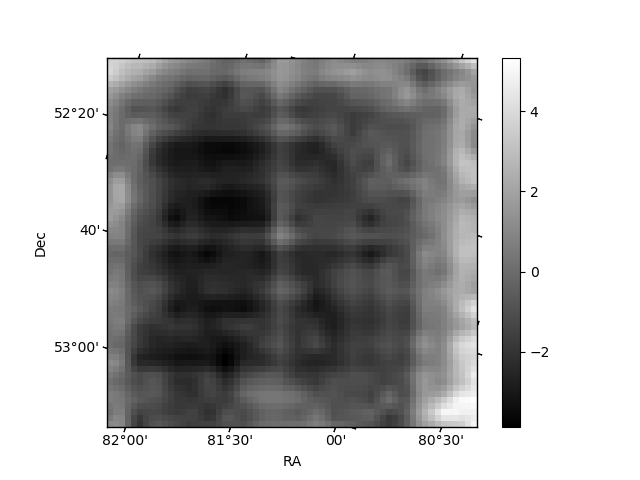
Quadrant B |
|---|---|---|---|
| Quadrant D | 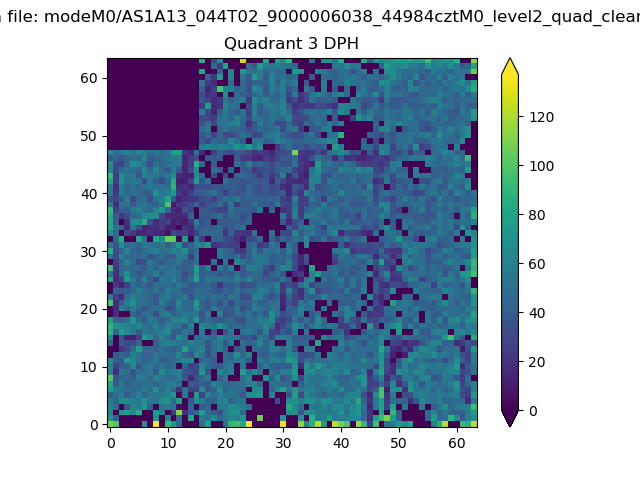 |
 |
Quadrant C |
| Plot type | Count rate plots | Images |
|---|---|---|
| Comparison with Poisson distribution Blue bars denote a histogram of data divided into 1 sec bins. Red curve is a Poisson curve with rate = median count rate of data. |
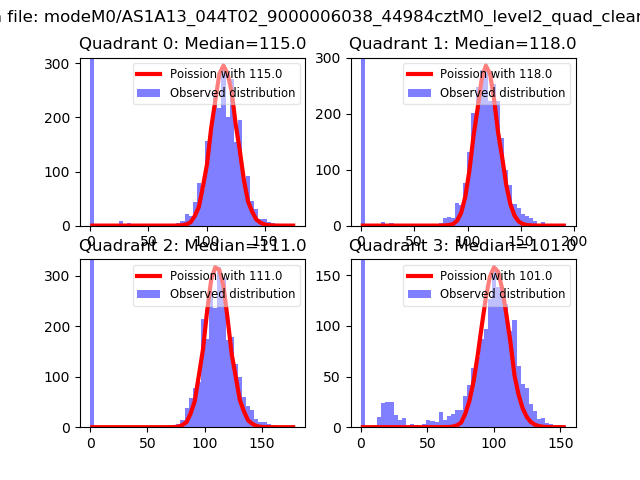 |
 |
| Quadrant-wise count rates Data is divided into 100 sec bins |
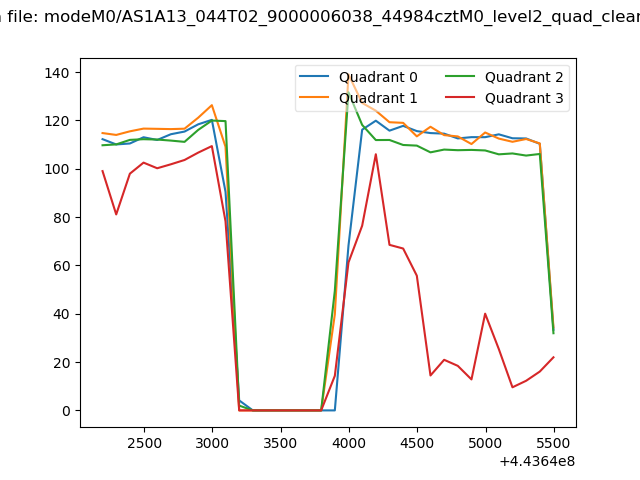 |
|
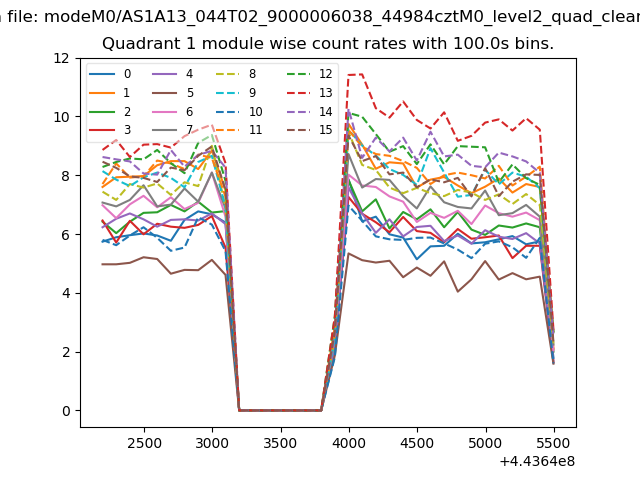
| Module-wise count rates for Quadrant A Data is divided into 100 sec bins |
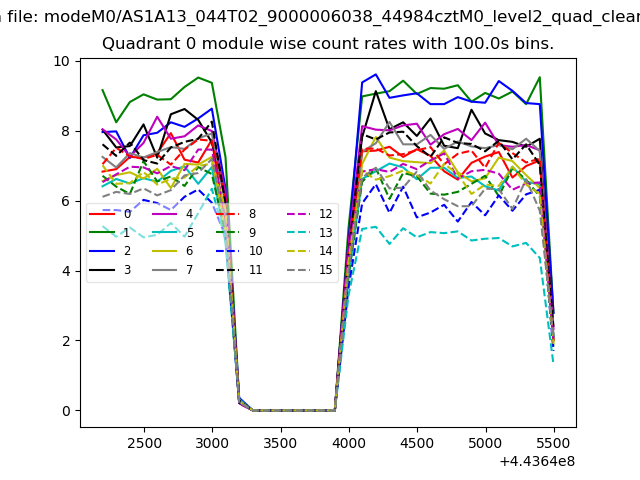 |
 |
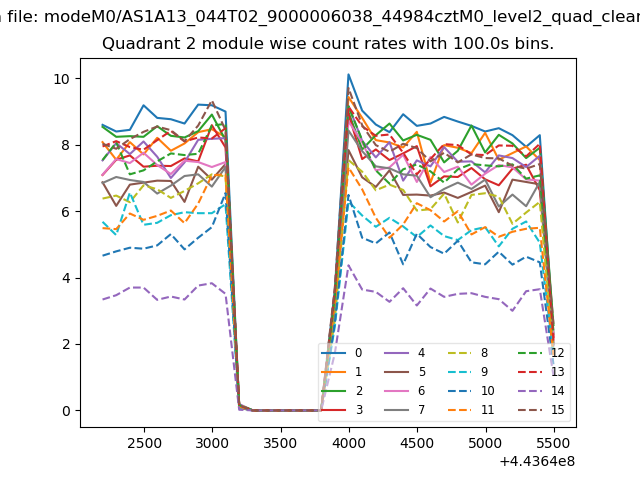
| Module-wise count rates for Quadrant B Data is divided into 100 sec bins |
 |
 |
| Module-wise count rates for Quadrant C Data is divided into 100 sec bins |
 |
 |
| Module-wise count rates for Quadrant D Data is divided into 100 sec bins |
 |
 |
| Parameter | Plot |
|---|---|
| CZT HV Monitor | 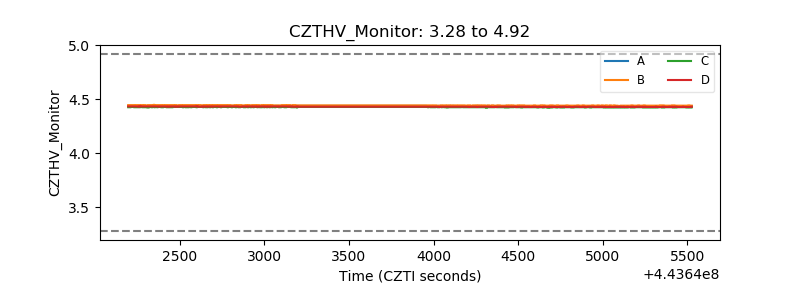 |
| D_VDD | 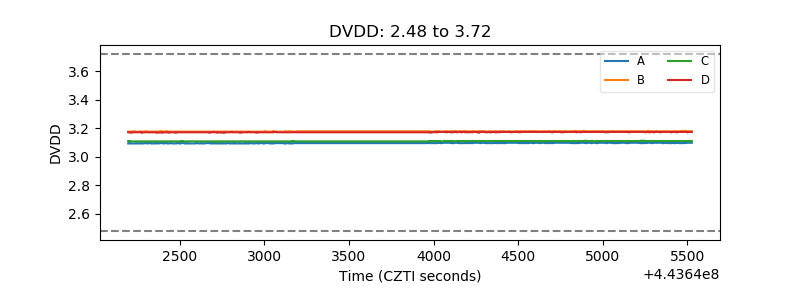 |
| Temperature 1 | 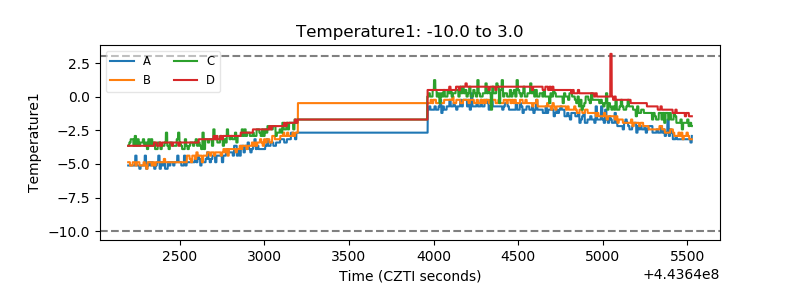 |
| Veto HV Monitor | 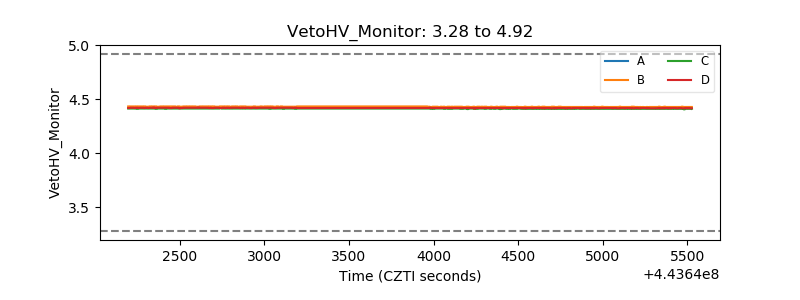 |
| Veto LLD | 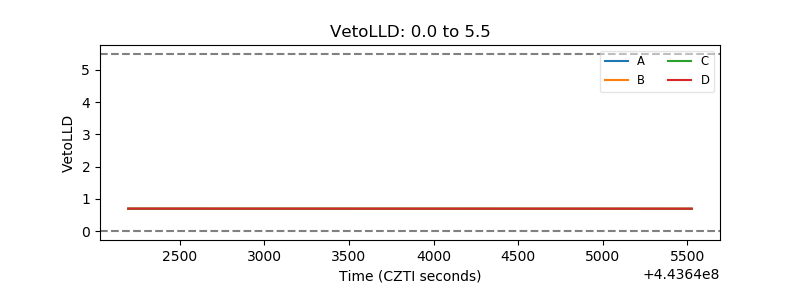 |
| Alpha Counter | 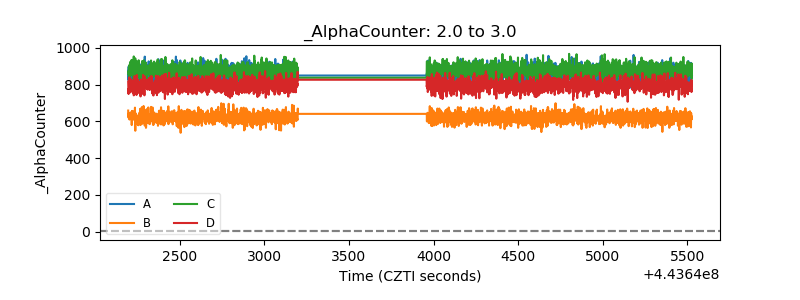 |
| _CPM_Rate | 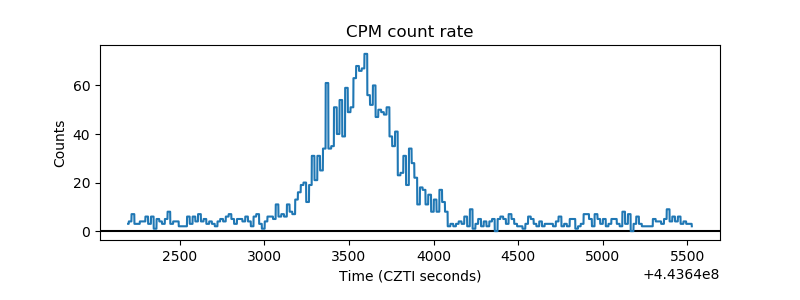 |
| CZT Counter | 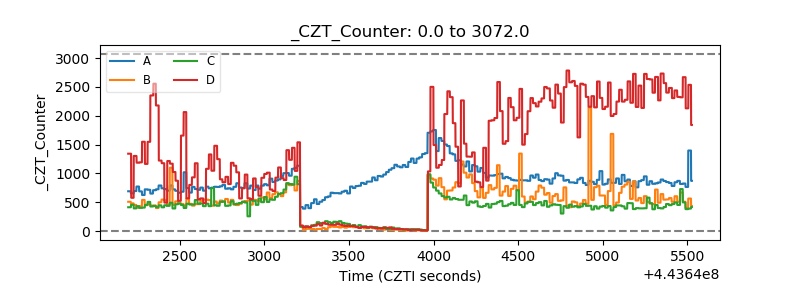 |
| +2.5 Volts monitor | 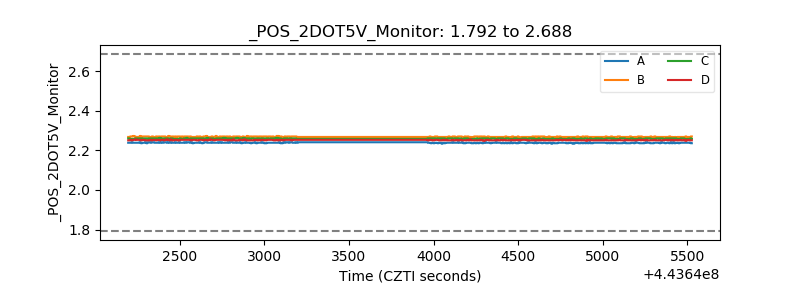 |
| +5 Volts monitor | 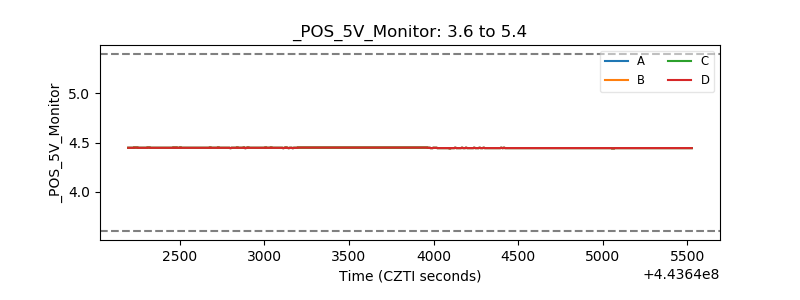 |
| _ROLL_ROT | 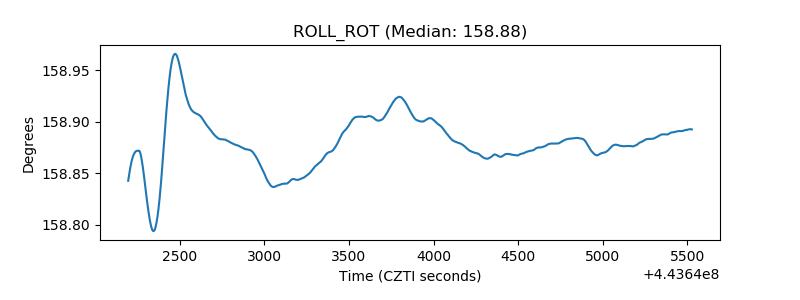 |
| _Roll_DEC | 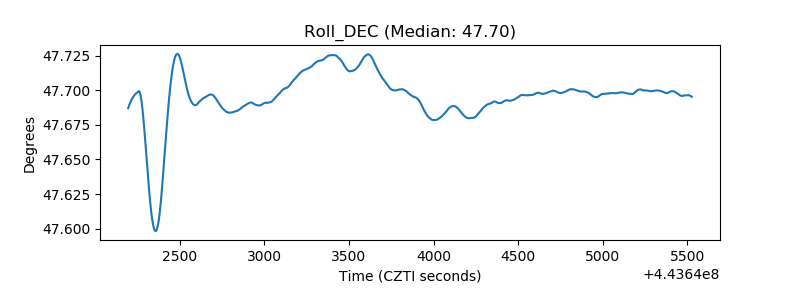 |
| _Roll_RA | 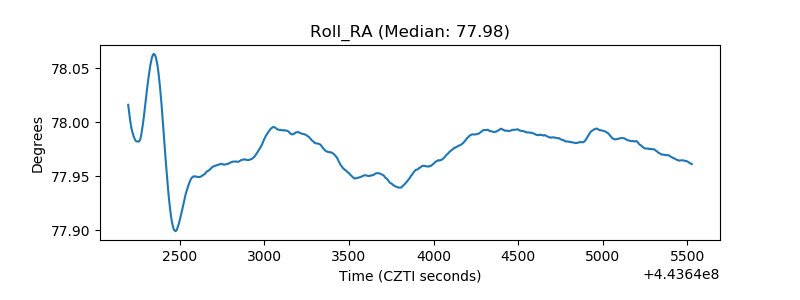 |
| Veto Counter | 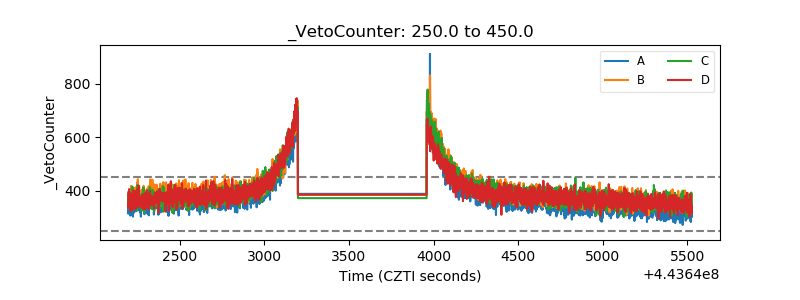 |