| Param | Original file | Final file |
|---|---|---|
| Filename | modeM0/AS1A13_044T02_9000006038_44985cztM0_level2.fits | modeM0/AS1A13_044T02_9000006038_44985cztM0_level2_quad_clean.evt |
| Size (bytes) | 710,029,440 | 115,407,360 |
| Size | 677.1 MB | 110.1 MB |
| Events in quadrant A | 6,293,566 | 813,441 |
| Events in quadrant B | 4,443,341 | 849,260 |
| Events in quadrant C | 3,504,879 | 810,198 |
| Events in quadrant D | 11,457,653 | 497,125 |
| Mode SS | |||
|---|---|---|---|
| Quadrant | BADHDUFLAG | Total packets | Discarded packets |
| A | 0 | 152 | 0 |
| B | 0 | 152 | 0 |
| C | 0 | 152 | 0 |
| D | 0 | 152 | 0 |
| Mode M9 | |||
|---|---|---|---|
| Quadrant | BADHDUFLAG | Total packets | Discarded packets |
| A | 0 | 3 | 0 |
| B | 0 | 4 | 0 |
| C | 0 | 4 | 0 |
| D | 0 | 4 | 0 |
| Mode M0 | |||
|---|---|---|---|
| Quadrant | BADHDUFLAG | Total packets | Discarded packets |
| A | 0 | 24120 | 2 |
| B | 0 | 18400 | 2 |
| C | 0 | 15937 | 2 |
| D | 0 | 39219 | 2 |
| Quadrant | Total seconds | Saturated seconds | Saturation percentage |
|---|---|---|---|
| A | 7533 | 274 | 3.637329% |
| B | 7533 | 187 | 2.482411% |
| C | 7532 | 35 | 0.464684% |
| D | 7532 | 2681 | 35.594796% |
Noise dominated data is calculated using 1-second bins in cleaned event files. If a bin has >2000 counts, and if more than 50% of those come from <1% of pixels, then it is considered to be noise-dominated and hence unusable.
| Quadrant | # 1 sec bins | Bins with >0 counts | Bins with >2000 counts | High rate bins dominated by noise | Noise dominated (total time) | Noise dominated (detector-on time) | Marked lightcurve |
|---|---|---|---|---|---|---|---|
| A | 7733 | 7534 | 4 | 4 | 0.05% | 0.05% | 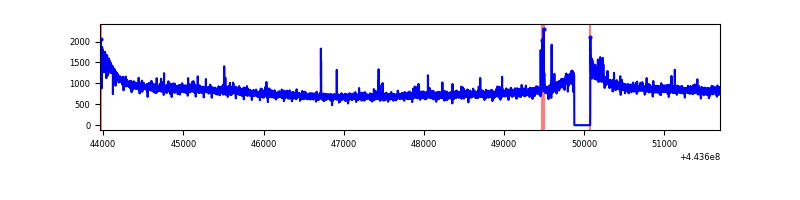 |
| B | 7733 | 7534 | 48 | 48 | 0.62% | 0.64% | 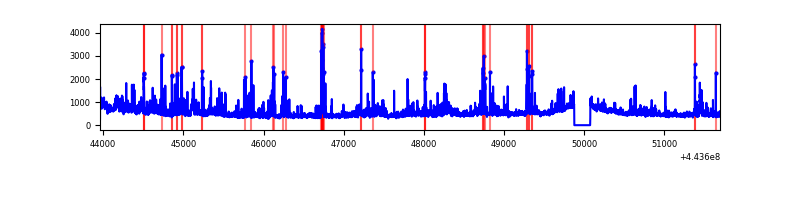 |
| C | 7732 | 7533 | 7 | 7 | 0.09% | 0.09% | 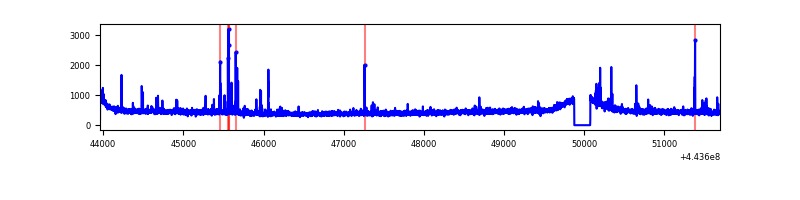 |
| D | 7732 | 7533 | 2356 | 2356 | 30.47% | 31.28% | 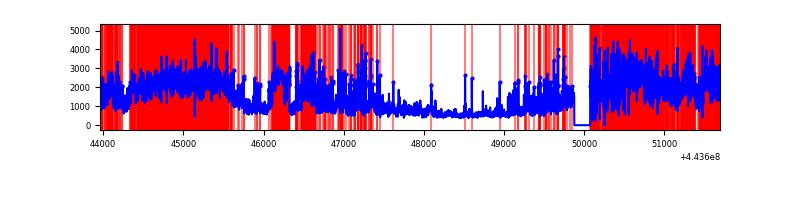 |
Top three noisy pixels from each quadrant. If the there are fewer than three noisy pixels in the level2.evt file, extra rows are filled as -1
| Pixel properties | Quadrant properties | ||||||
|---|---|---|---|---|---|---|---|
| Quadrant | DetID | PixID | Counts | Sigma | Mean | Median | Sigma |
| A | 10 | 83 | 2859790 | 15715.4 | 867 | 848 | 181.9 |
| A | 13 | 248 | 30297 | 161.88 | 867 | 848 | 181.9 |
| A | 0 | 243 | 29242 | 156.08 | 867 | 848 | 181.9 |
| B | 5 | 255 | 220573 | 1274.97 | 870 | 842 | 172.3 |
| B | 4 | 158 | 152547 | 880.25 | 870 | 842 | 172.3 |
| B | 4 | 171 | 129750 | 747.98 | 870 | 842 | 172.3 |
| C | 12 | 2 | 89936 | 439.85 | 858 | 864 | 202.5 |
| C | 3 | 233 | 21693 | 102.86 | 858 | 864 | 202.5 |
| C | 1 | 3 | 20309 | 96.02 | 858 | 864 | 202.5 |
| D | 12 | 33 | 1936033 | 10359.44 | 731 | 707 | 186.8 |
| D | 13 | 249 | 1296362 | 6935.4 | 731 | 707 | 186.8 |
| D | 11 | 241 | 1267120 | 6778.87 | 731 | 707 | 186.8 |
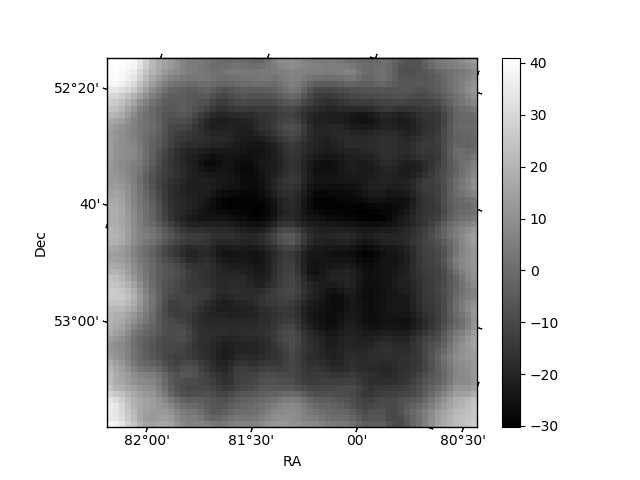
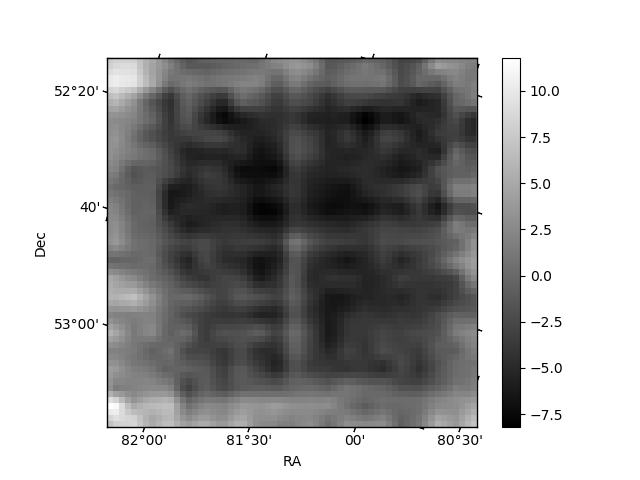
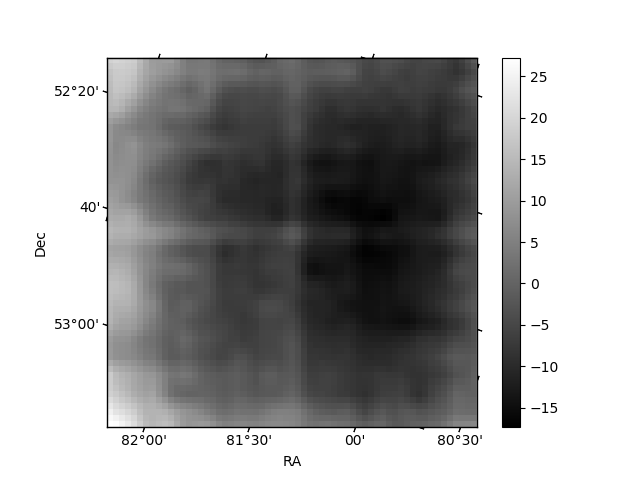
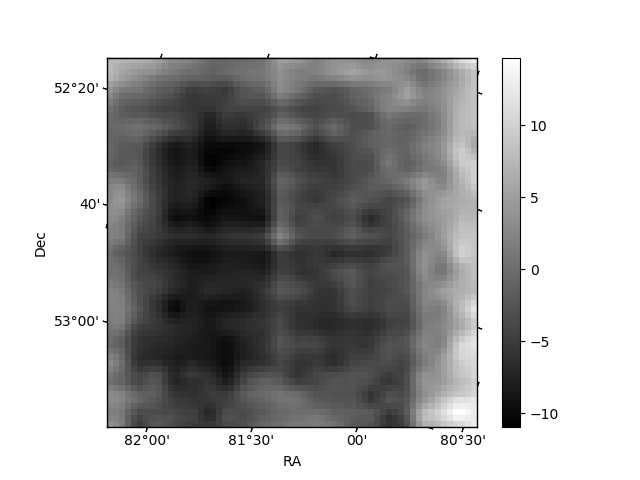
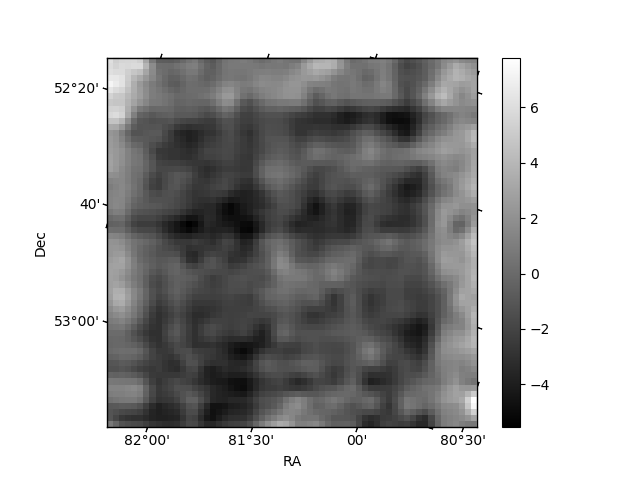
Histogram calculated using DETX and DETY for each event in the final _common_clean file
| Quadrant A | 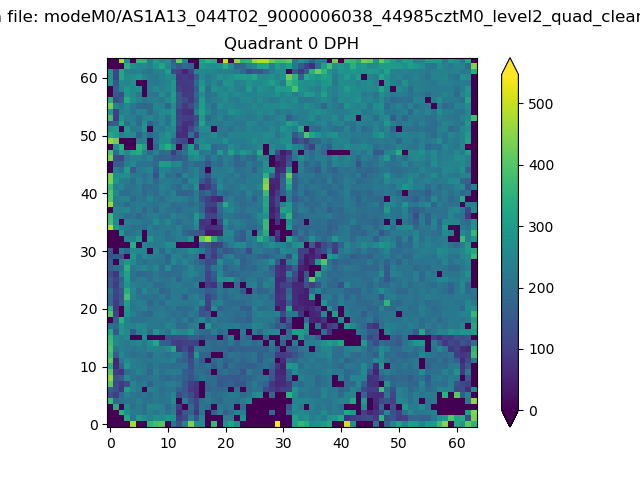 |
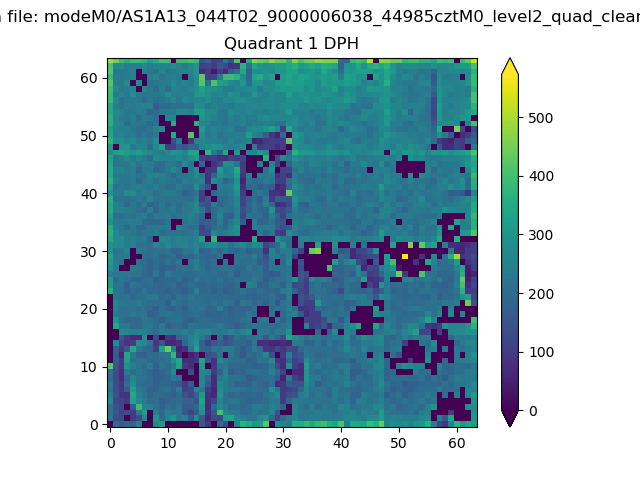 |
Quadrant B |
|---|---|---|---|
| Quadrant D | 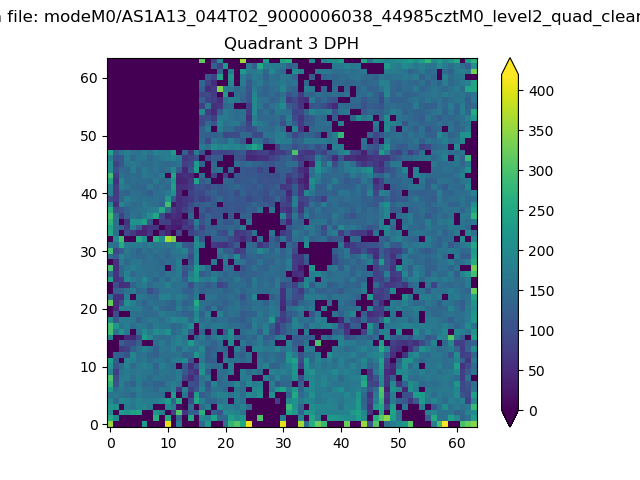 |
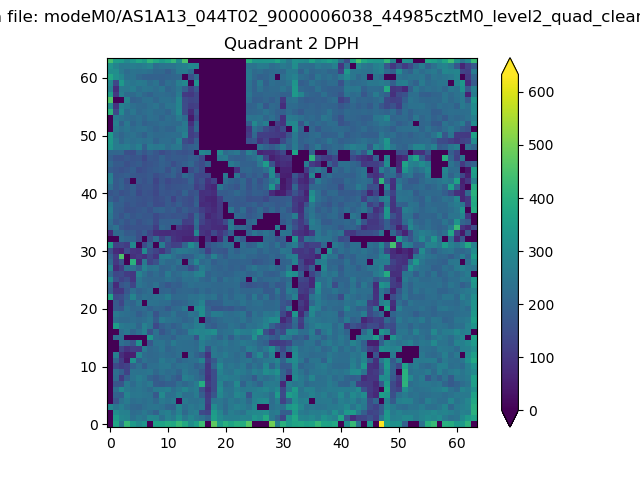 |
Quadrant C |
| Plot type | Count rate plots | Images |
|---|---|---|
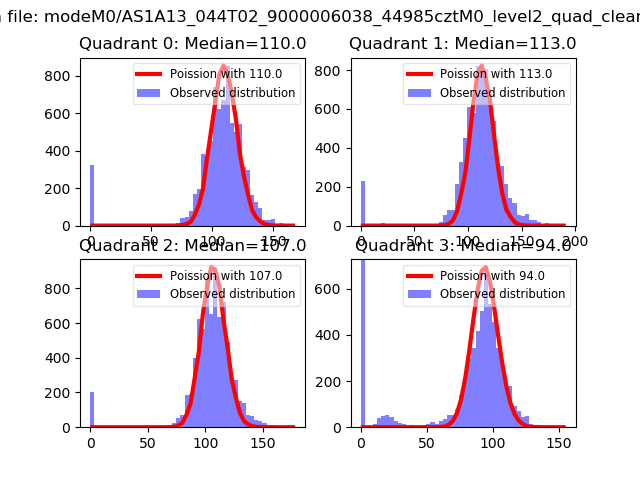
| Comparison with Poisson distribution Blue bars denote a histogram of data divided into 1 sec bins. Red curve is a Poisson curve with rate = median count rate of data. |
 |
 |
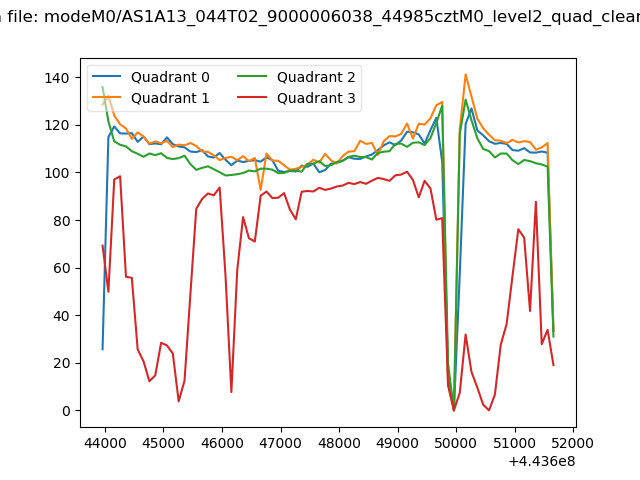
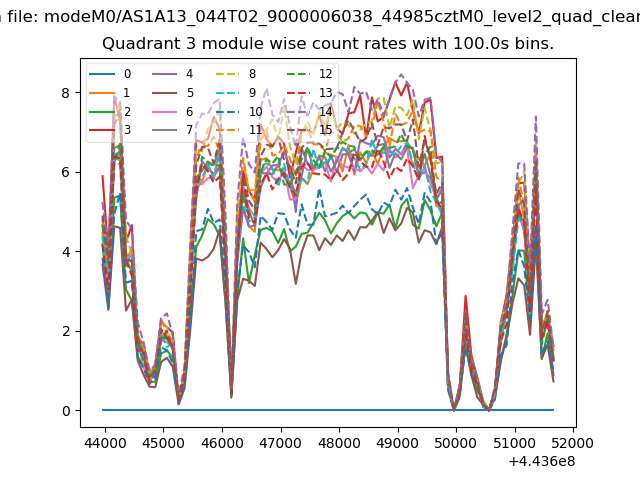
| Quadrant-wise count rates Data is divided into 100 sec bins |
 |
|
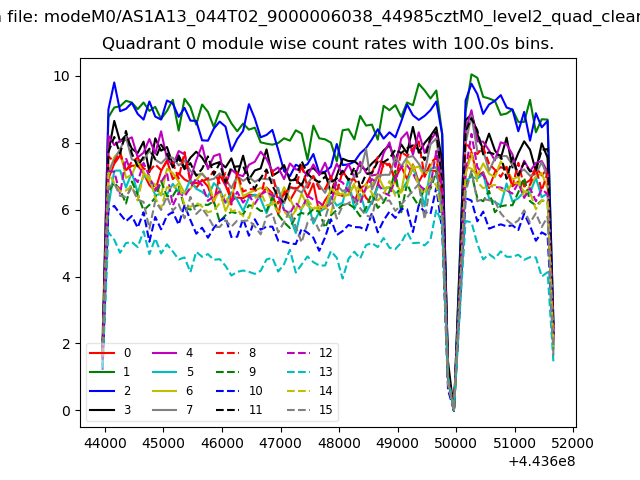
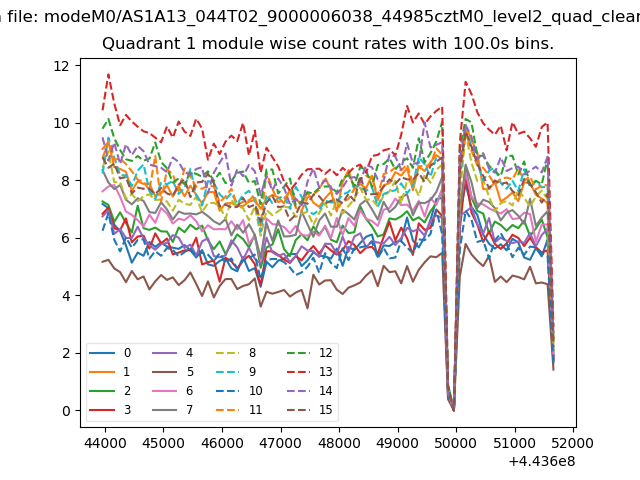
| Module-wise count rates for Quadrant A Data is divided into 100 sec bins |
 |
 |
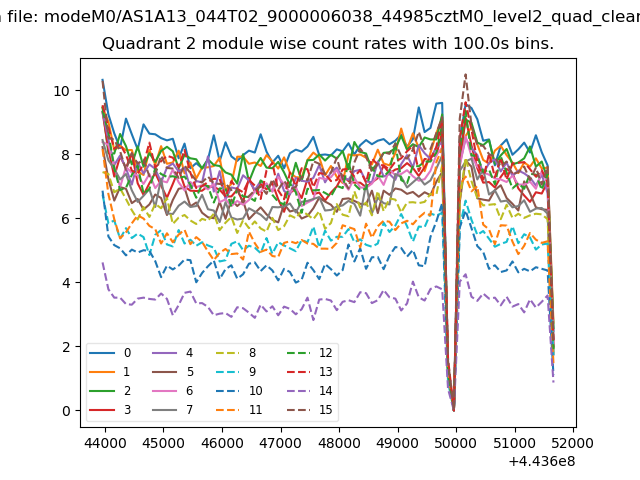
| Module-wise count rates for Quadrant B Data is divided into 100 sec bins |
 |
 |
| Module-wise count rates for Quadrant C Data is divided into 100 sec bins |
 |
 |
| Module-wise count rates for Quadrant D Data is divided into 100 sec bins |
 |
 |
| Parameter | Plot |
|---|---|
| CZT HV Monitor | 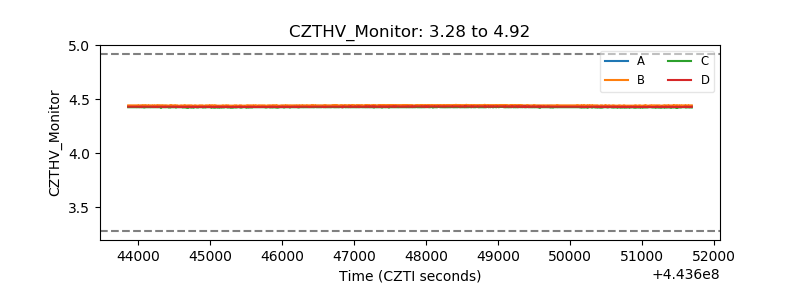 |
| D_VDD | 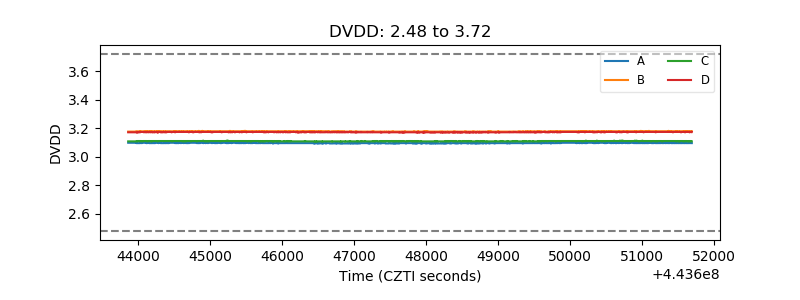 |
| Temperature 1 | 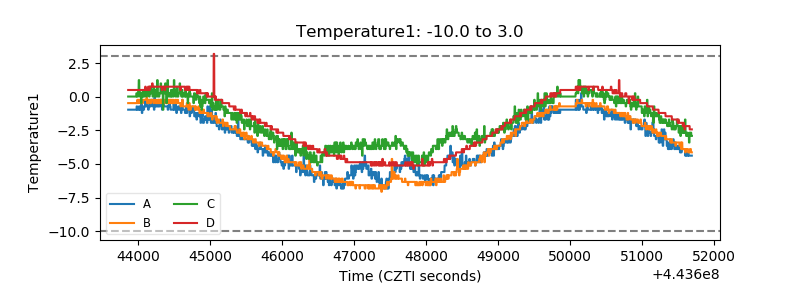 |
| Veto HV Monitor | 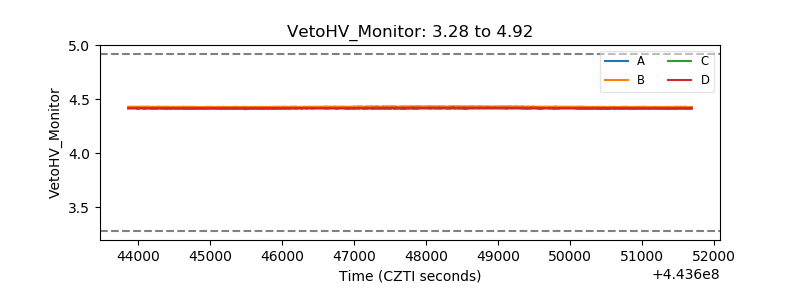 |
| Veto LLD | 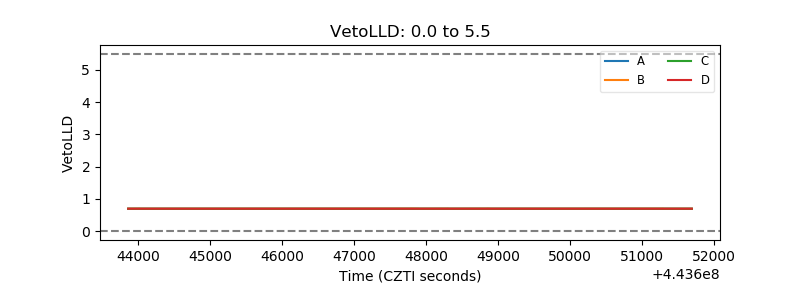 |
| Alpha Counter | 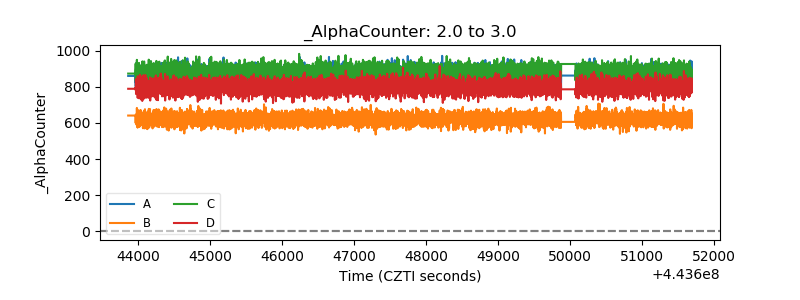 |
| _CPM_Rate | 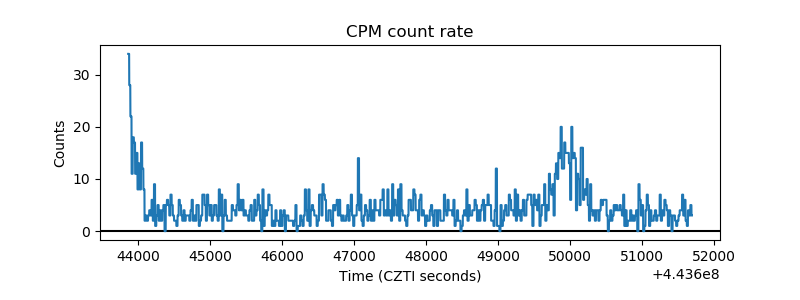 |
| CZT Counter | 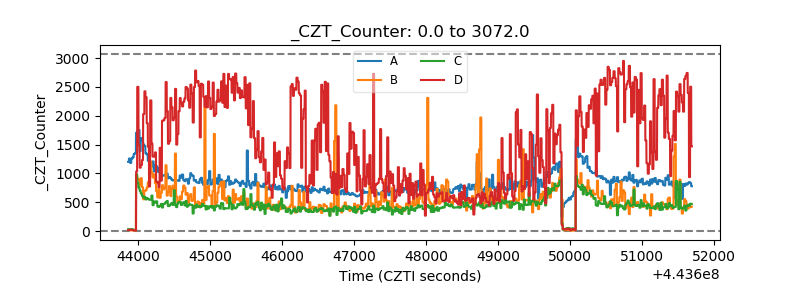 |
| +2.5 Volts monitor | 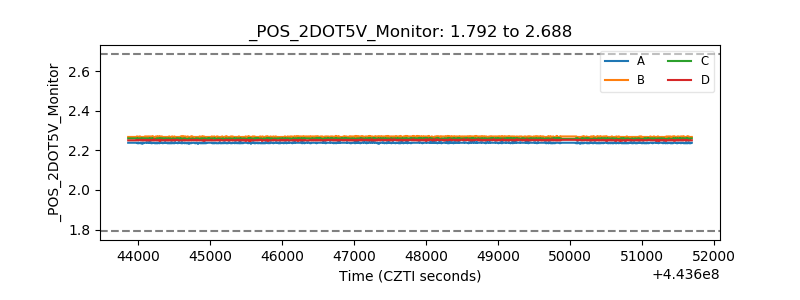 |
| +5 Volts monitor |  |
| _ROLL_ROT | 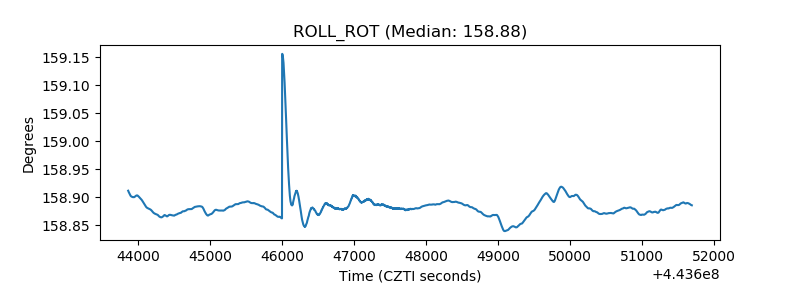 |
| _Roll_DEC | 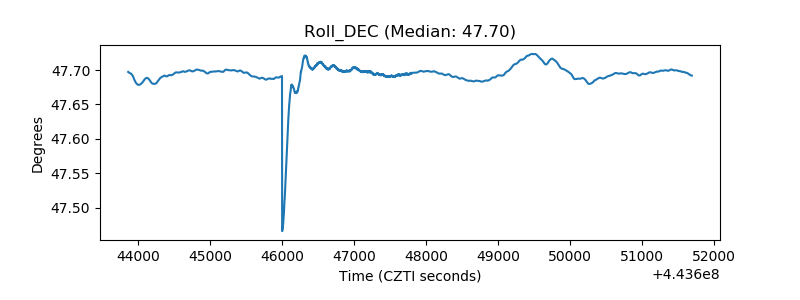 |
| _Roll_RA | 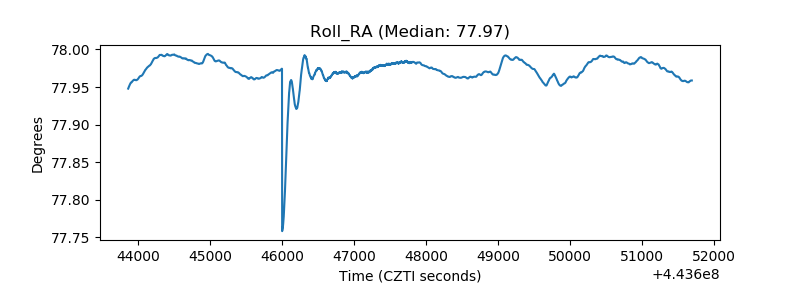 |
| Veto Counter | 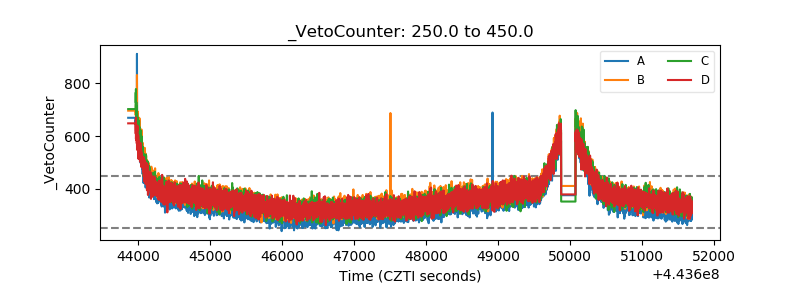 |