| Param | Original file | Final file |
|---|---|---|
| Filename | modeM0/AS1A13_044T02_9000006038_44987cztM0_level2.fits | modeM0/AS1A13_044T02_9000006038_44987cztM0_level2_quad_clean.evt |
| Size (bytes) | 798,759,360 | 119,586,240 |
| Size | 761.8 MB | 114.0 MB |
| Events in quadrant A | 6,985,917 | 869,027 |
| Events in quadrant B | 4,354,912 | 889,220 |
| Events in quadrant C | 4,258,992 | 834,378 |
| Events in quadrant D | 13,345,590 | 468,924 |
| Mode SS | |||
|---|---|---|---|
| Quadrant | BADHDUFLAG | Total packets | Discarded packets |
| A | 0 | 162 | 0 |
| B | 0 | 162 | 0 |
| C | 0 | 162 | 0 |
| D | 0 | 162 | 0 |
| Mode M0 | |||
|---|---|---|---|
| Quadrant | BADHDUFLAG | Total packets | Discarded packets |
| A | 0 | 26626 | 0 |
| B | 0 | 18497 | 3 |
| C | 0 | 18582 | 0 |
| D | 0 | 45197 | 0 |
| Quadrant | Total seconds | Saturated seconds | Saturation percentage |
|---|---|---|---|
| A | 8037 | 116 | 1.443325% |
| B | 8036 | 109 | 1.356396% |
| C | 8037 | 160 | 1.990793% |
| D | 8038 | 3521 | 43.804429% |
Noise dominated data is calculated using 1-second bins in cleaned event files. If a bin has >2000 counts, and if more than 50% of those come from <1% of pixels, then it is considered to be noise-dominated and hence unusable.
| Quadrant | # 1 sec bins | Bins with >0 counts | Bins with >2000 counts | High rate bins dominated by noise | Noise dominated (total time) | Noise dominated (detector-on time) | Marked lightcurve |
|---|---|---|---|---|---|---|---|
| A | 8037 | 8037 | 12 | 12 | 0.15% | 0.15% | 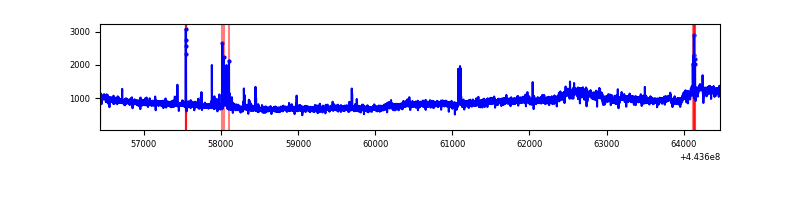 |
| B | 8037 | 8037 | 31 | 31 | 0.39% | 0.39% | 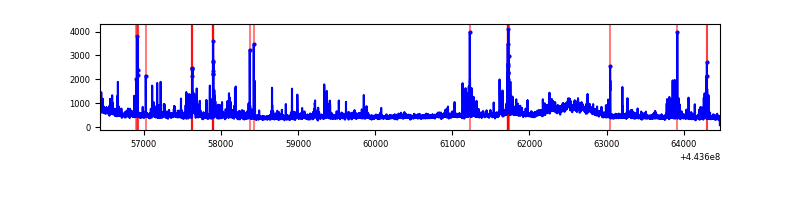 |
| C | 8038 | 8038 | 118 | 118 | 1.47% | 1.47% | 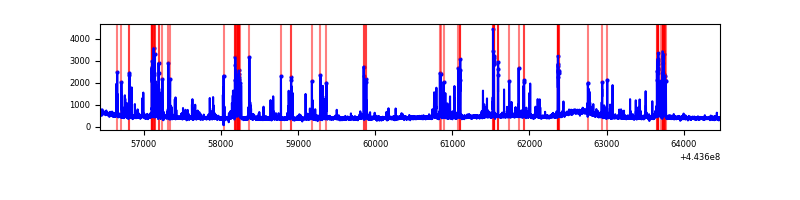 |
| D | 8038 | 8038 | 3116 | 3116 | 38.77% | 38.77% | 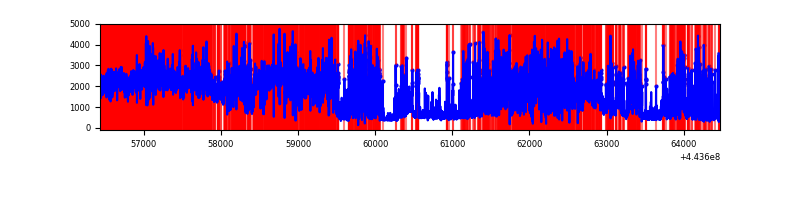 |
Top three noisy pixels from each quadrant. If the there are fewer than three noisy pixels in the level2.evt file, extra rows are filled as -1
| Pixel properties | Quadrant properties | ||||||
|---|---|---|---|---|---|---|---|
| Quadrant | DetID | PixID | Counts | Sigma | Mean | Median | Sigma |
| A | 10 | 83 | 2838896 | 15024.43 | 897 | 875 | 188.9 |
| A | 0 | 247 | 532850 | 2816.27 | 897 | 875 | 188.9 |
| A | 13 | 248 | 70289 | 367.48 | 897 | 875 | 188.9 |
| B | 5 | 255 | 335454 | 1884.75 | 898 | 871 | 177.5 |
| B | 0 | 168 | 137651 | 770.5 | 898 | 871 | 177.5 |
| B | 10 | 3 | 48034 | 265.67 | 898 | 871 | 177.5 |
| C | 14 | 254 | 584493 | 2828.65 | 879 | 884 | 206.3 |
| C | 15 | 208 | 141682 | 682.42 | 879 | 884 | 206.3 |
| C | 11 | 16 | 71772 | 343.58 | 879 | 884 | 206.3 |
| D | 13 | 249 | 4040161 | 21375.81 | 732 | 708 | 189.0 |
| D | 13 | 187 | 3567731 | 18875.82 | 732 | 708 | 189.0 |
| D | 1 | 52 | 740089 | 3912.62 | 732 | 708 | 189.0 |
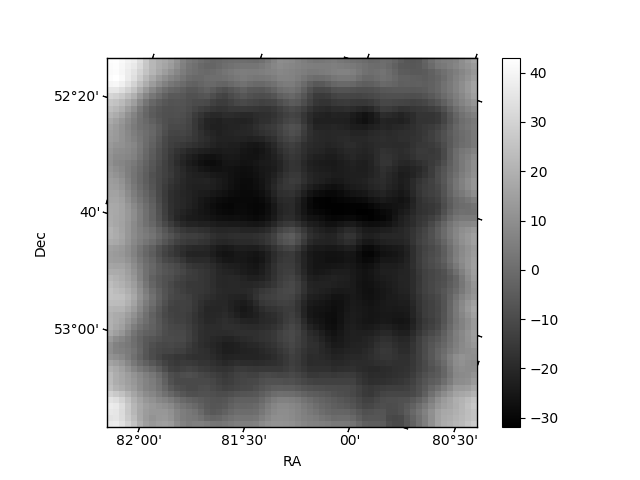
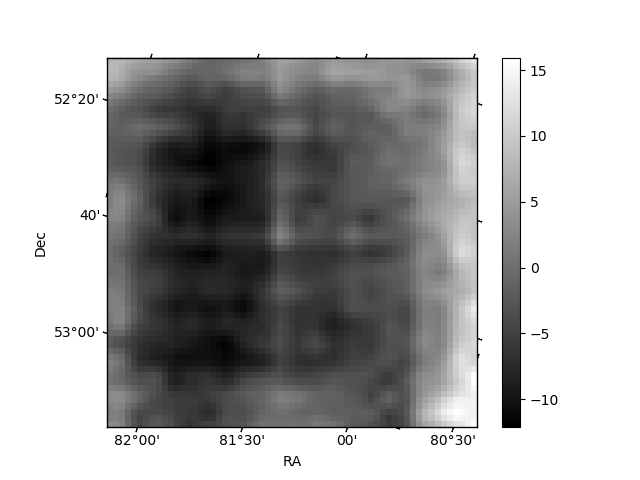
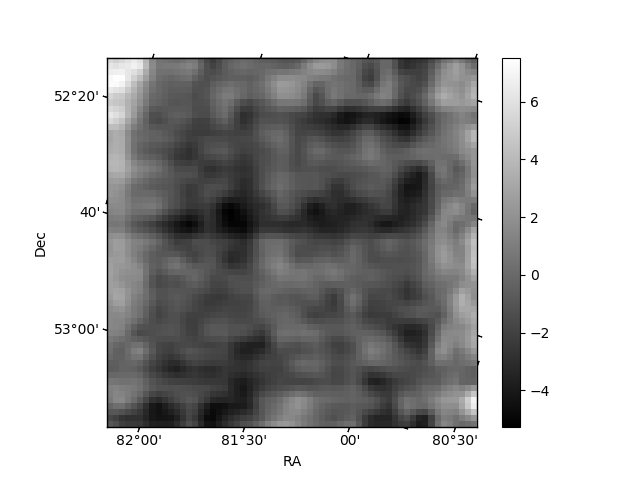
Histogram calculated using DETX and DETY for each event in the final _common_clean file
| Quadrant A | 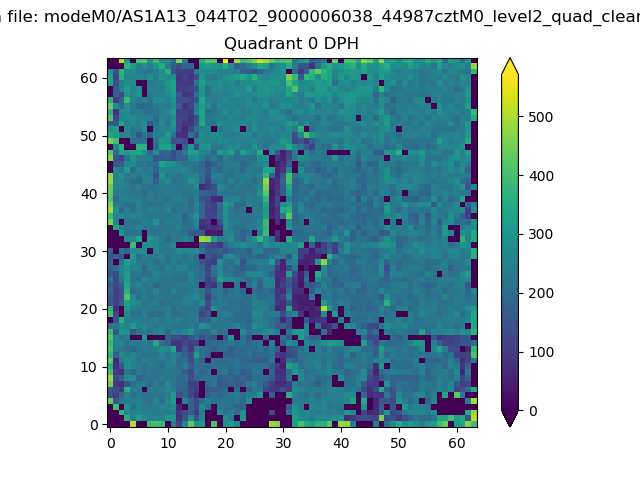 |
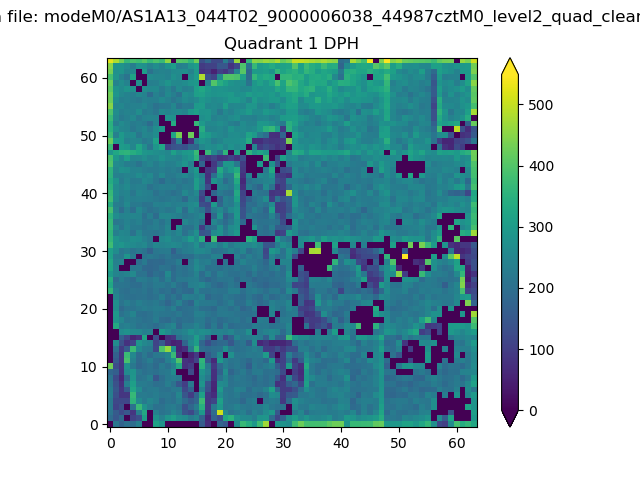 |
Quadrant B |
|---|---|---|---|
| Quadrant D | 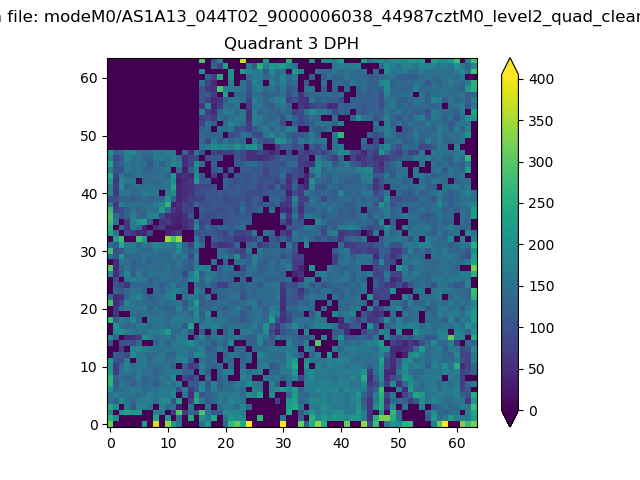 |
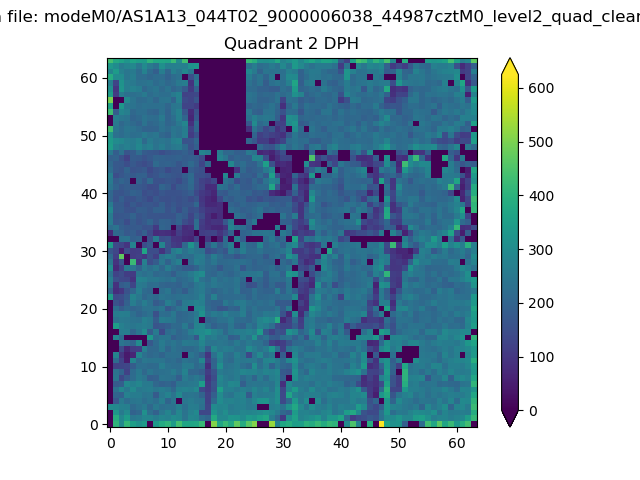 |
Quadrant C |
| Plot type | Count rate plots | Images |
|---|---|---|
| Comparison with Poisson distribution Blue bars denote a histogram of data divided into 1 sec bins. Red curve is a Poisson curve with rate = median count rate of data. |
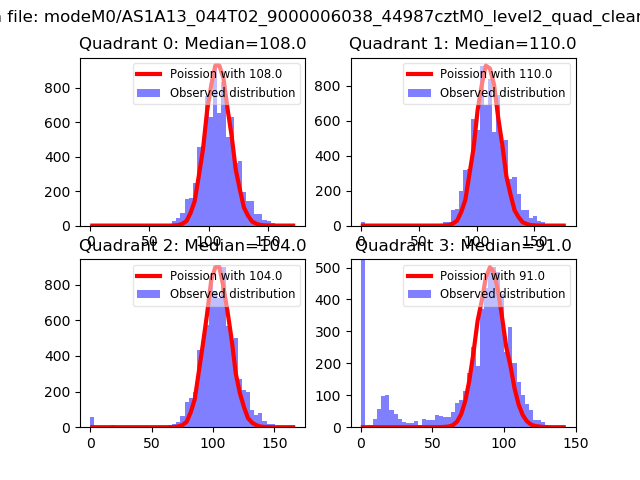 |
 |
| Quadrant-wise count rates Data is divided into 100 sec bins |
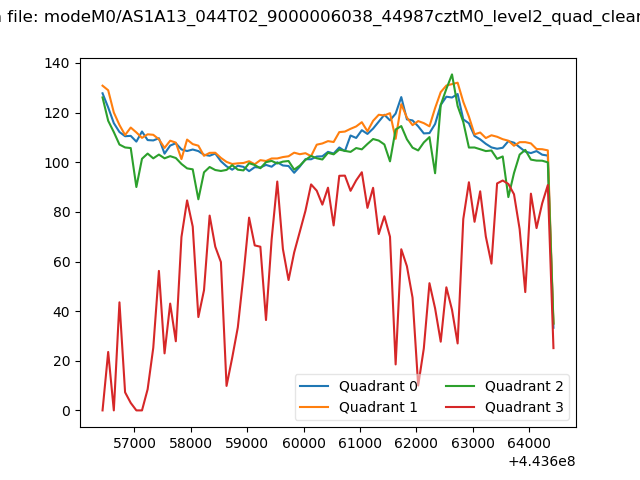 |
|
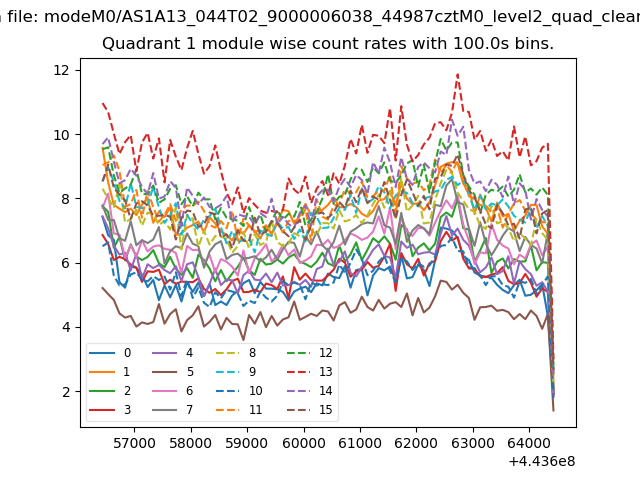
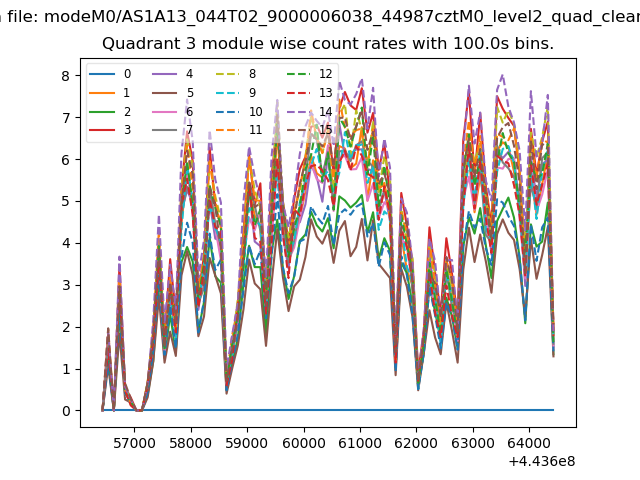
| Module-wise count rates for Quadrant A Data is divided into 100 sec bins |
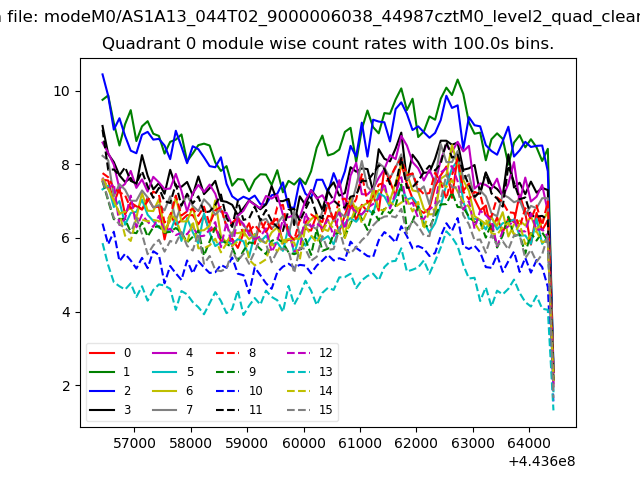 |
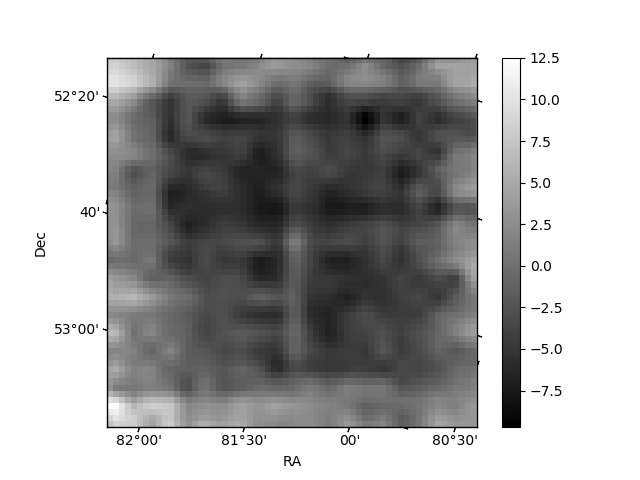 |
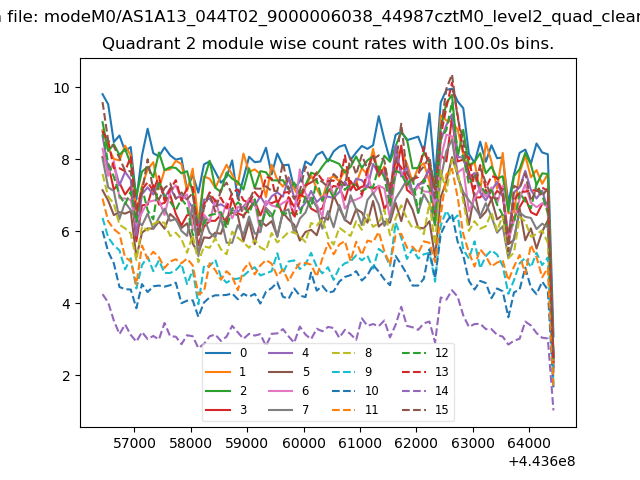
| Module-wise count rates for Quadrant B Data is divided into 100 sec bins |
 |
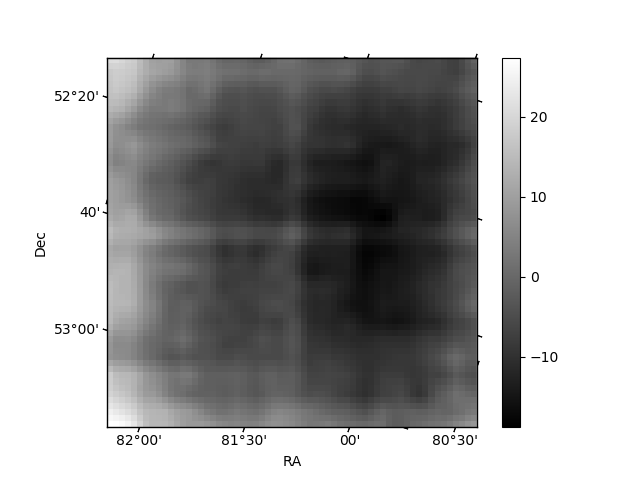 |
| Module-wise count rates for Quadrant C Data is divided into 100 sec bins |
 |
 |
| Module-wise count rates for Quadrant D Data is divided into 100 sec bins |
 |
 |
| Parameter | Plot |
|---|---|
| CZT HV Monitor | 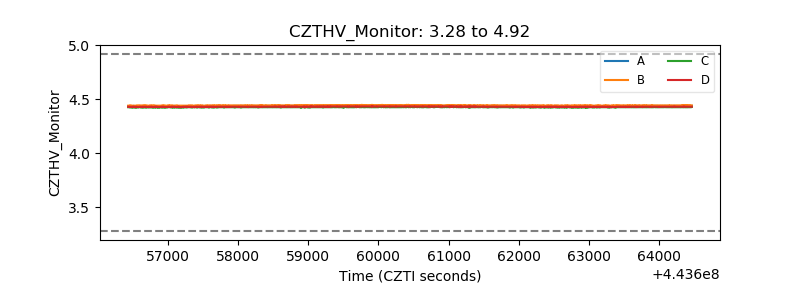 |
| D_VDD | 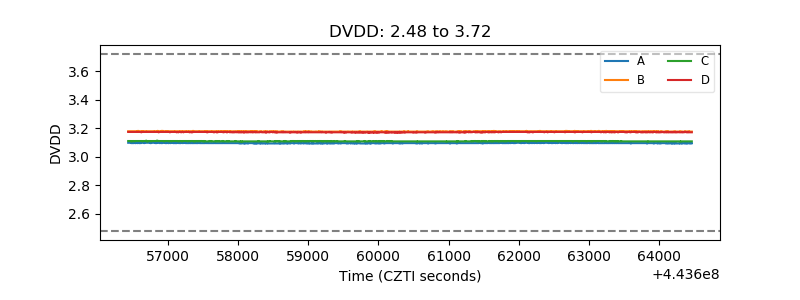 |
| Temperature 1 | 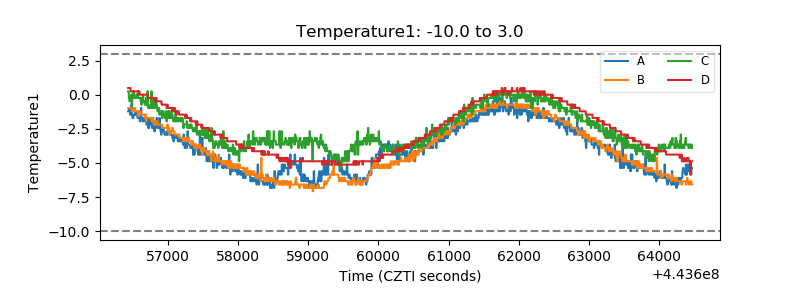 |
| Veto HV Monitor | 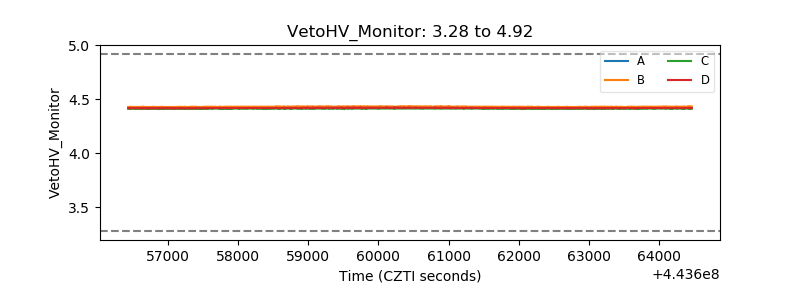 |
| Veto LLD | 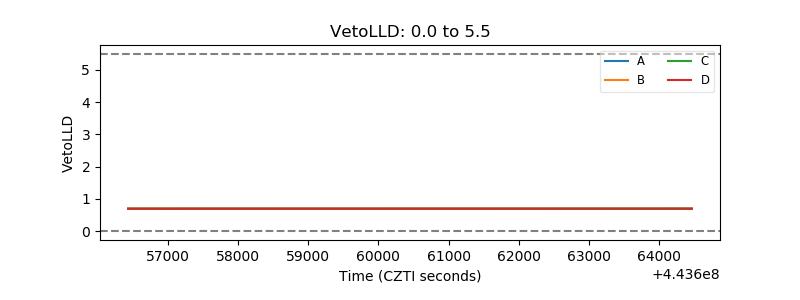 |
| Alpha Counter | 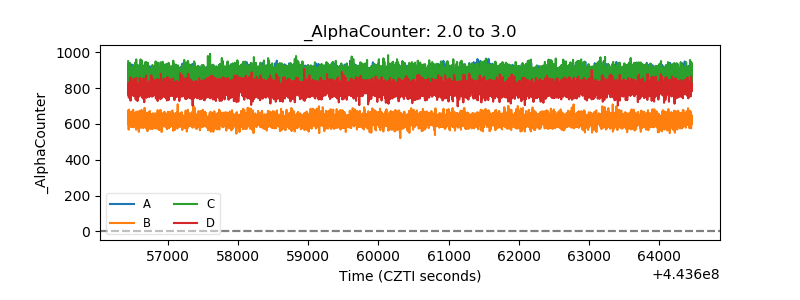 |
| _CPM_Rate | 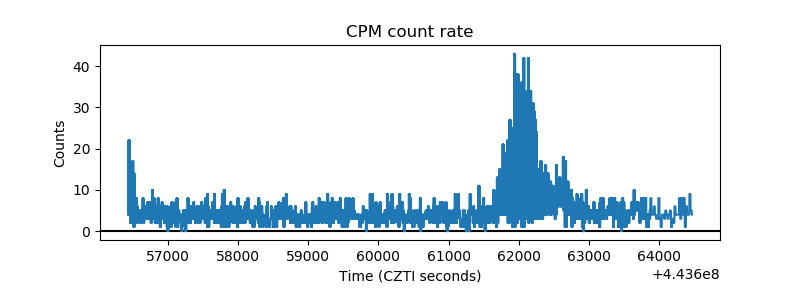 |
| CZT Counter | 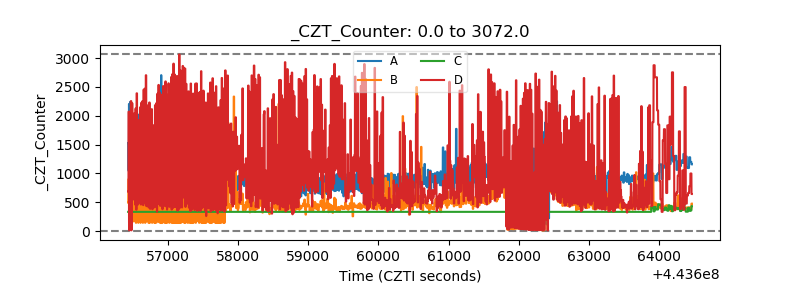 |
| +2.5 Volts monitor | 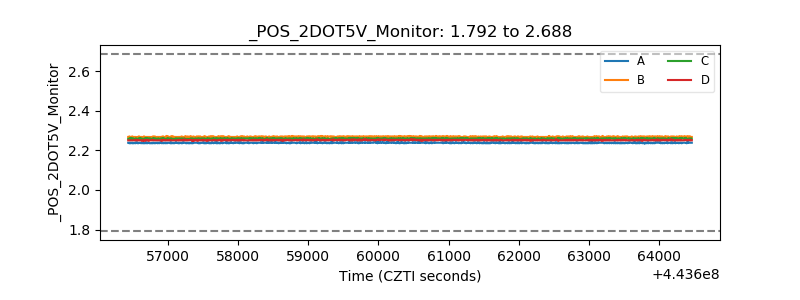 |
| +5 Volts monitor | 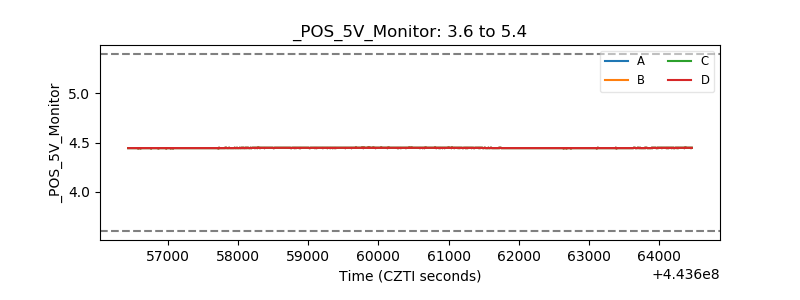 |
| _ROLL_ROT | 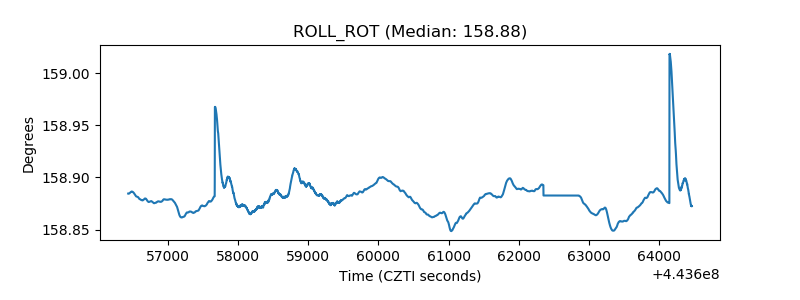 |
| _Roll_DEC | 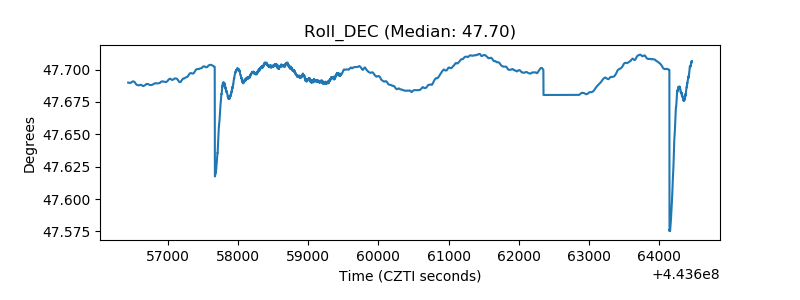 |
| _Roll_RA | 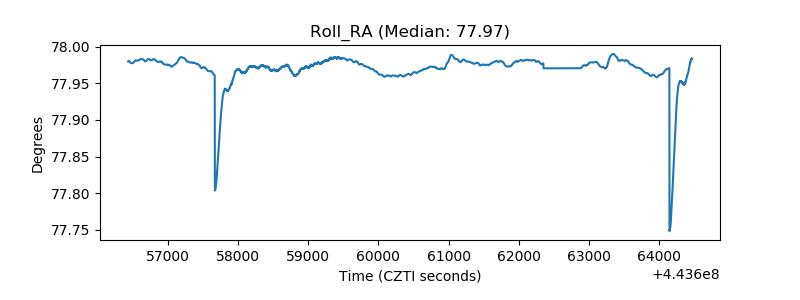 |
| Veto Counter | 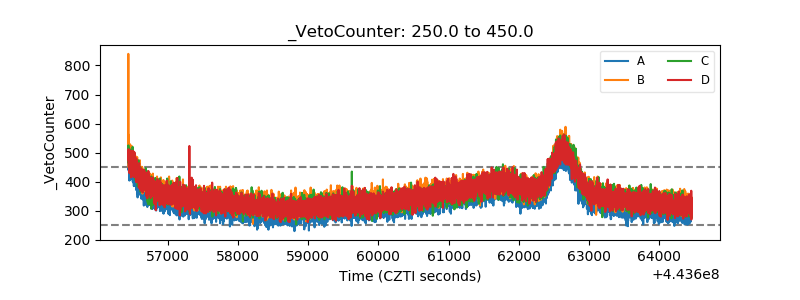 |