| Param | Original file | Final file |
|---|---|---|
| Filename | modeM0/AS1A13_044T02_9000006038_44990cztM0_level2.fits | modeM0/AS1A13_044T02_9000006038_44990cztM0_level2_quad_clean.evt |
| Size (bytes) | 289,422,720 | 49,112,640 |
| Size | 276.0 MB | 46.8 MB |
| Events in quadrant A | 3,496,955 | 331,036 |
| Events in quadrant B | 1,565,252 | 340,649 |
| Events in quadrant C | 1,501,855 | 327,271 |
| Events in quadrant D | 3,896,178 | 257,139 |
| Mode SS | |||
|---|---|---|---|
| Quadrant | BADHDUFLAG | Total packets | Discarded packets |
| A | 0 | 66 | 0 |
| B | 0 | 66 | 0 |
| C | 0 | 66 | 0 |
| D | 0 | 66 | 0 |
| Mode M0 | |||
|---|---|---|---|
| Quadrant | BADHDUFLAG | Total packets | Discarded packets |
| A | 0 | 12716 | 0 |
| B | 0 | 6996 | 0 |
| C | 0 | 7037 | 0 |
| D | 0 | 13868 | 0 |
| Quadrant | Total seconds | Saturated seconds | Saturation percentage |
|---|---|---|---|
| A | 3246 | 17 | 0.523722% |
| B | 3247 | 17 | 0.523560% |
| C | 3247 | 33 | 1.016323% |
| D | 3247 | 645 | 19.864490% |
Noise dominated data is calculated using 1-second bins in cleaned event files. If a bin has >2000 counts, and if more than 50% of those come from <1% of pixels, then it is considered to be noise-dominated and hence unusable.
| Quadrant | # 1 sec bins | Bins with >0 counts | Bins with >2000 counts | High rate bins dominated by noise | Noise dominated (total time) | Noise dominated (detector-on time) | Marked lightcurve |
|---|---|---|---|---|---|---|---|
| A | 3246 | 3246 | 6 | 6 | 0.18% | 0.18% | 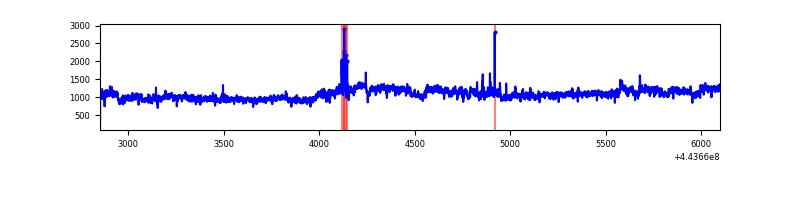 |
| B | 3247 | 3247 | 13 | 13 | 0.40% | 0.40% | 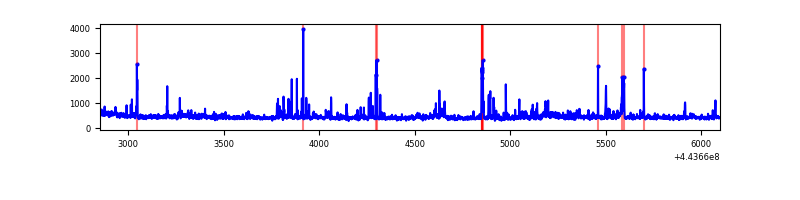 |
| C | 3247 | 3247 | 37 | 37 | 1.14% | 1.14% | 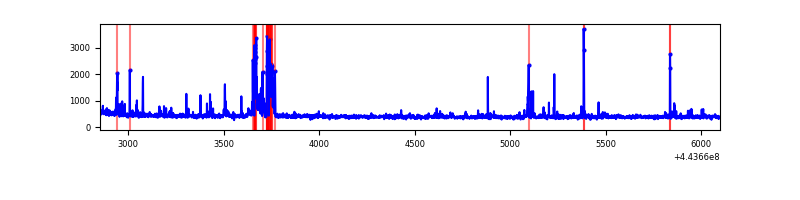 |
| D | 3247 | 3247 | 606 | 606 | 18.66% | 18.66% | 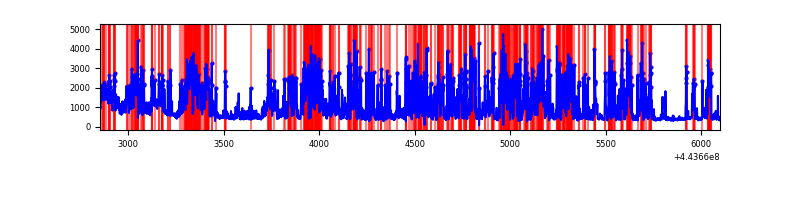 |
Top three noisy pixels from each quadrant. If the there are fewer than three noisy pixels in the level2.evt file, extra rows are filled as -1
| Pixel properties | Quadrant properties | ||||||
|---|---|---|---|---|---|---|---|
| Quadrant | DetID | PixID | Counts | Sigma | Mean | Median | Sigma |
| A | 10 | 83 | 1061229 | 15031.94 | 328 | 320 | 70.6 |
| A | 0 | 247 | 1060306 | 15018.87 | 328 | 320 | 70.6 |
| A | 0 | 226 | 66213 | 933.63 | 328 | 320 | 70.6 |
| B | 5 | 255 | 101475 | 1497.04 | 334 | 324 | 67.6 |
| B | 0 | 155 | 51647 | 759.58 | 334 | 324 | 67.6 |
| B | 5 | 172 | 34084 | 499.65 | 334 | 324 | 67.6 |
| C | 15 | 208 | 138718 | 1781.72 | 327 | 329 | 77.7 |
| C | 14 | 254 | 78609 | 1007.83 | 327 | 329 | 77.7 |
| C | 1 | 3 | 4361 | 51.91 | 327 | 329 | 77.7 |
| D | 13 | 249 | 2023627 | 25768.02 | 298 | 288 | 78.5 |
| D | 2 | 249 | 261386 | 3325.19 | 298 | 288 | 78.5 |
| D | 13 | 171 | 115655 | 1469.24 | 298 | 288 | 78.5 |
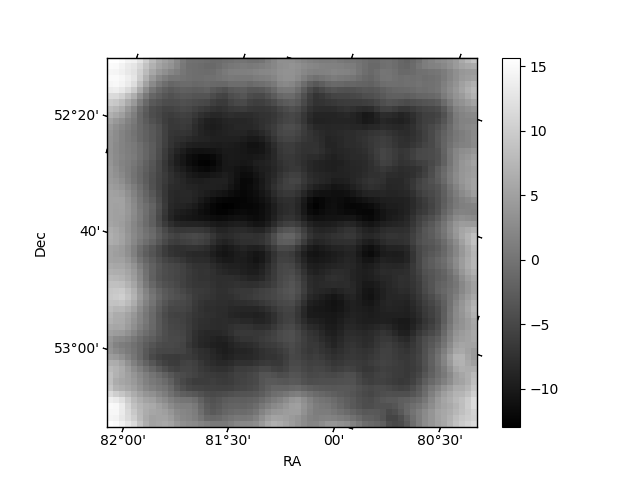
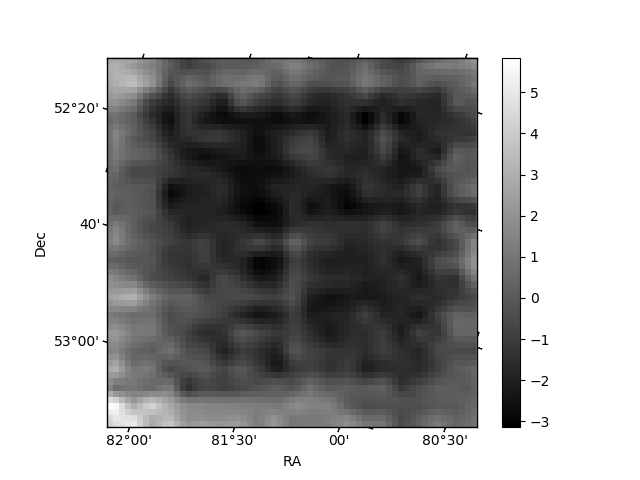
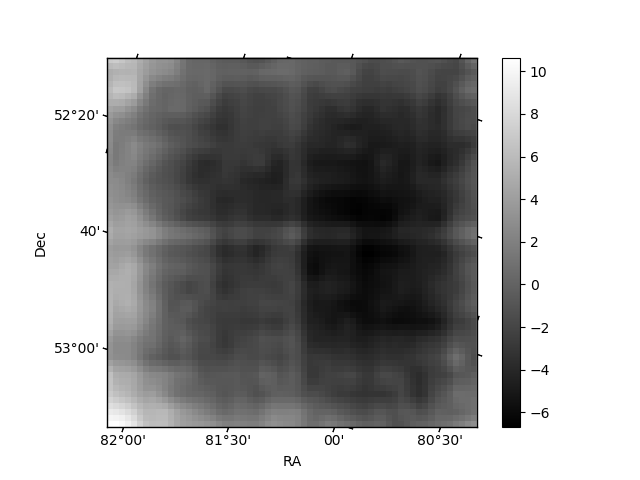
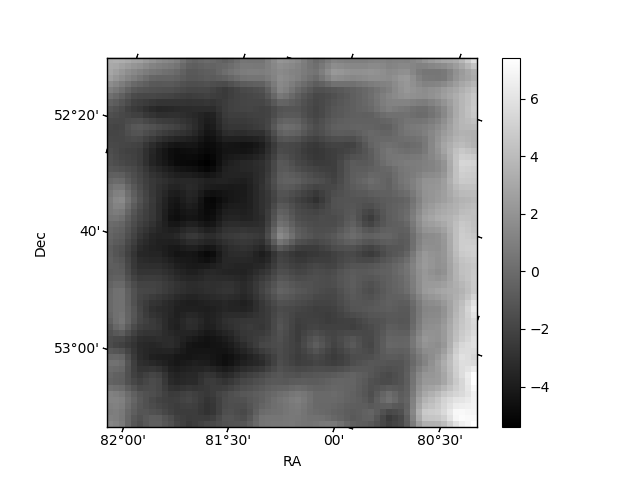
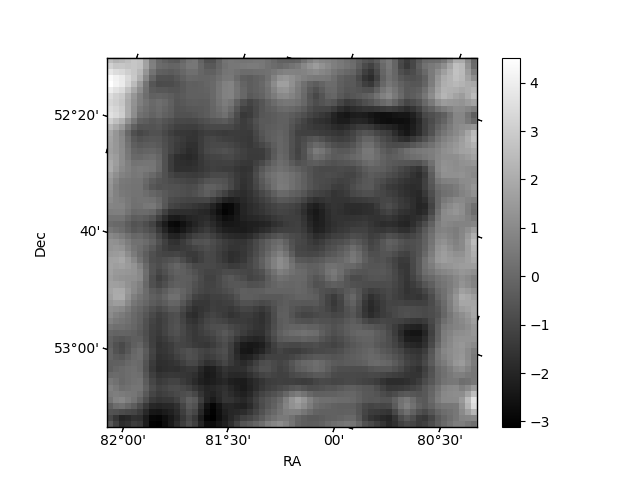
Histogram calculated using DETX and DETY for each event in the final _common_clean file
| Quadrant A | 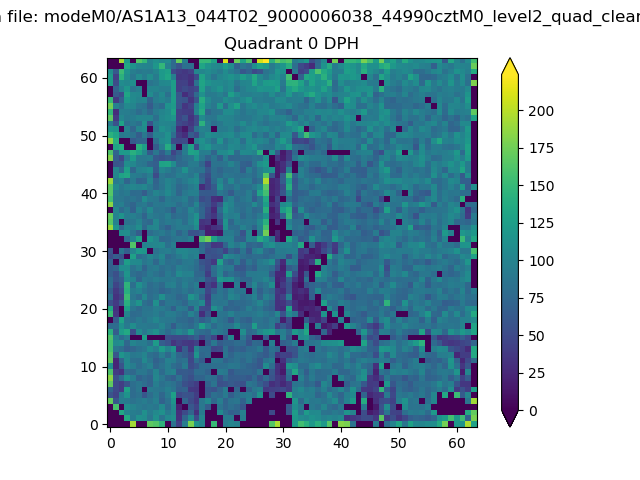 |
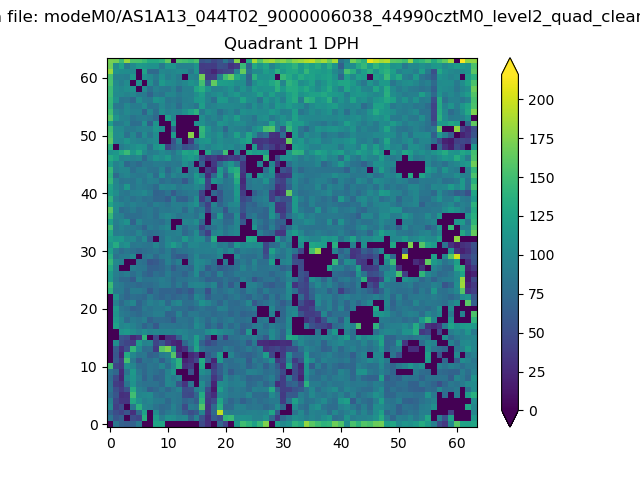 |
Quadrant B |
|---|---|---|---|
| Quadrant D | 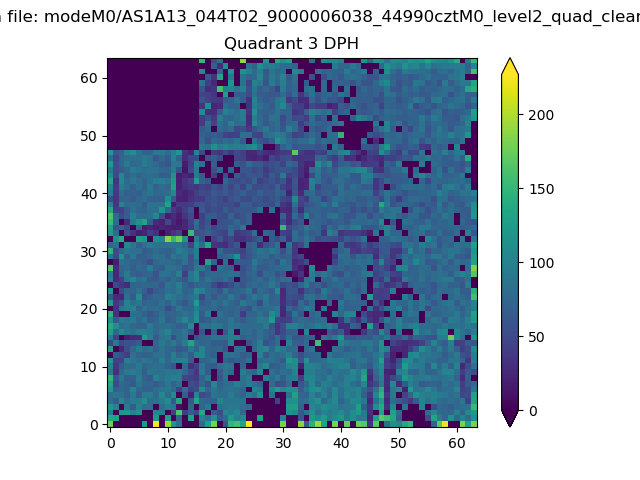 |
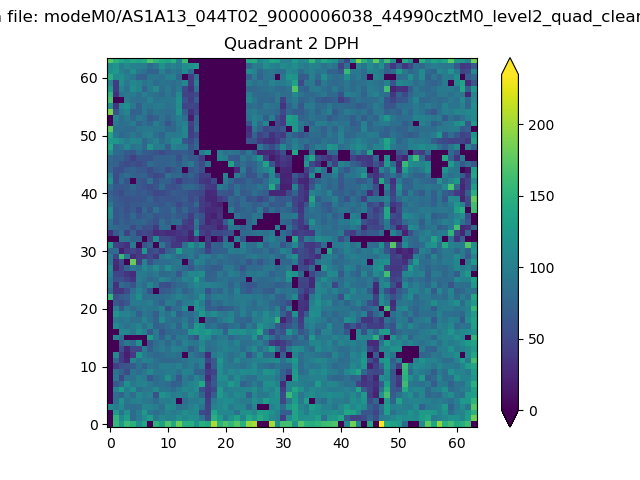 |
Quadrant C |
| Plot type | Count rate plots | Images |
|---|---|---|
| Comparison with Poisson distribution Blue bars denote a histogram of data divided into 1 sec bins. Red curve is a Poisson curve with rate = median count rate of data. |
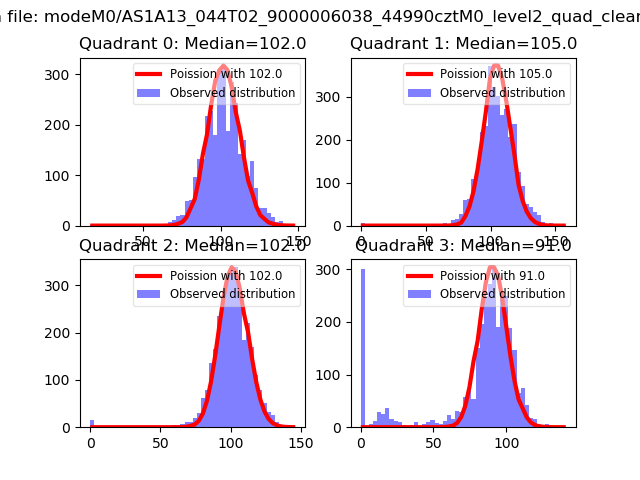 |
 |
| Quadrant-wise count rates Data is divided into 100 sec bins |
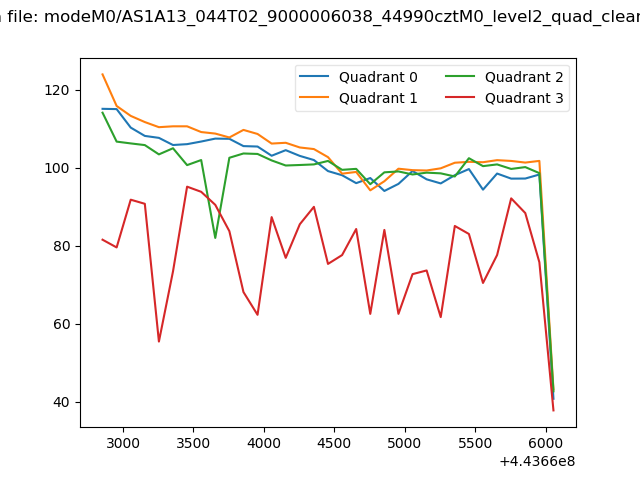 |
|
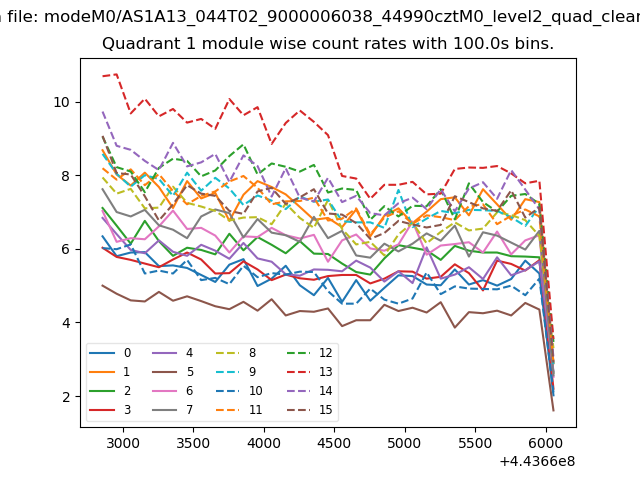
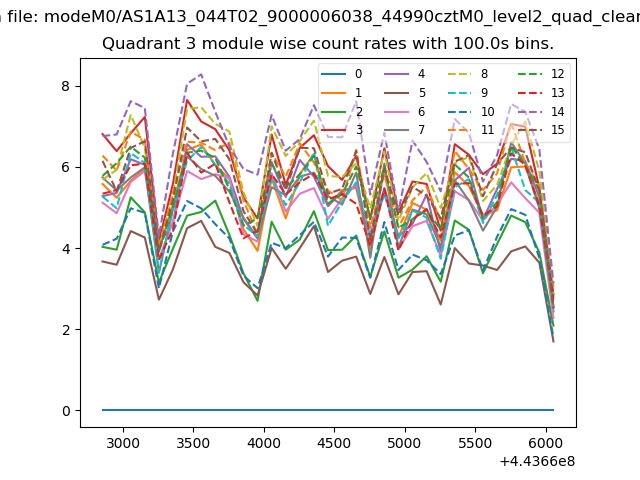
| Module-wise count rates for Quadrant A Data is divided into 100 sec bins |
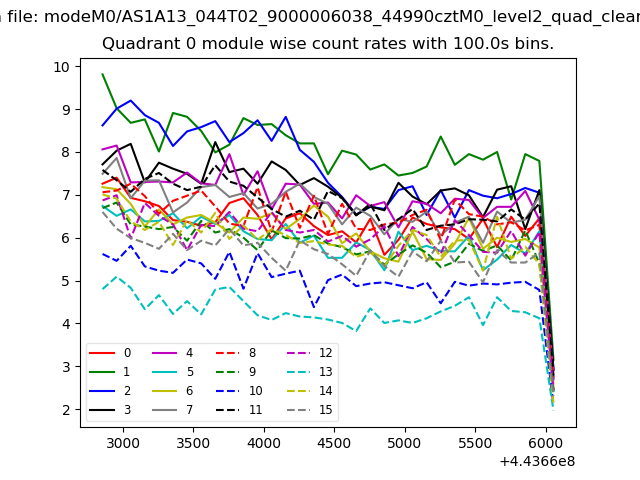 |
 |
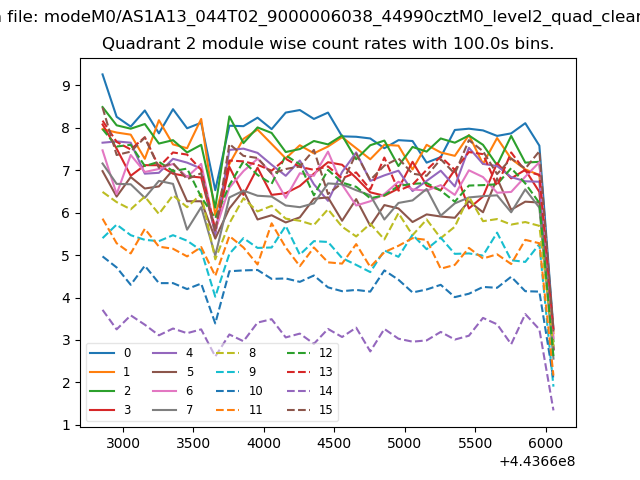
| Module-wise count rates for Quadrant B Data is divided into 100 sec bins |
 |
 |
| Module-wise count rates for Quadrant C Data is divided into 100 sec bins |
 |
 |
| Module-wise count rates for Quadrant D Data is divided into 100 sec bins |
 |
 |
| Parameter | Plot |
|---|---|
| CZT HV Monitor | 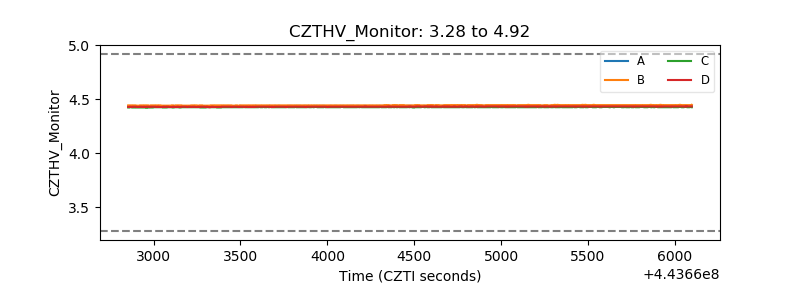 |
| D_VDD |  |
| Temperature 1 | 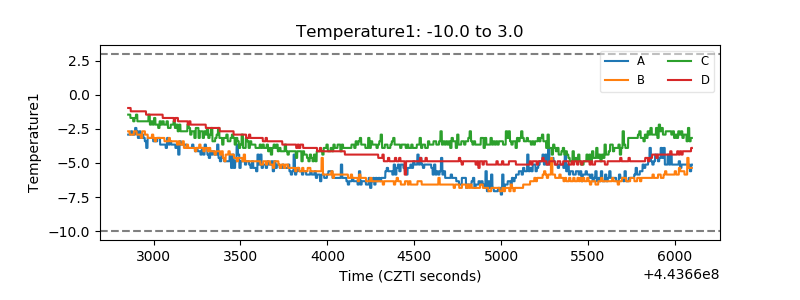 |
| Veto HV Monitor | 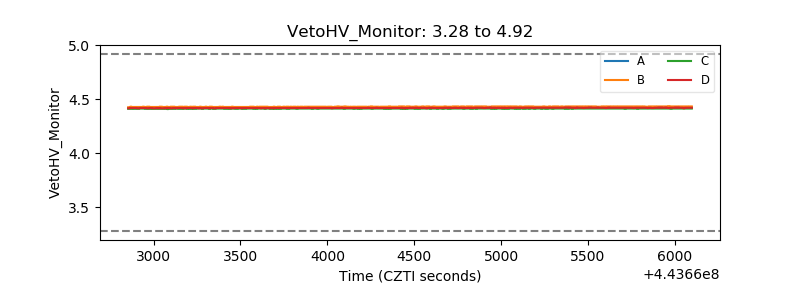 |
| Veto LLD | 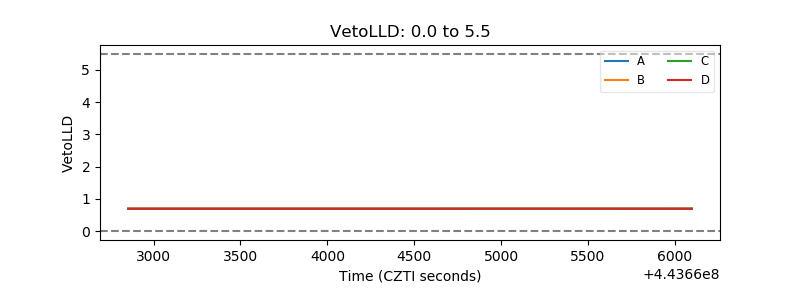 |
| Alpha Counter | 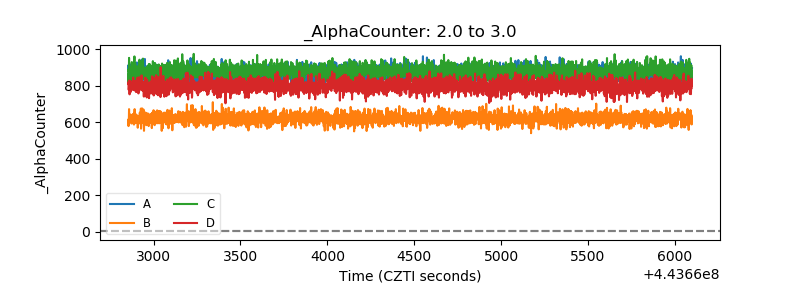 |
| _CPM_Rate | 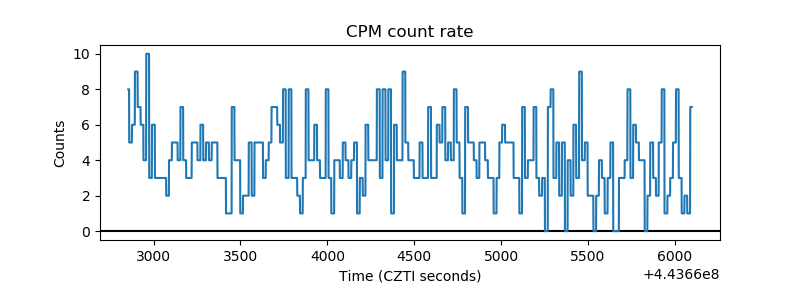 |
| CZT Counter | 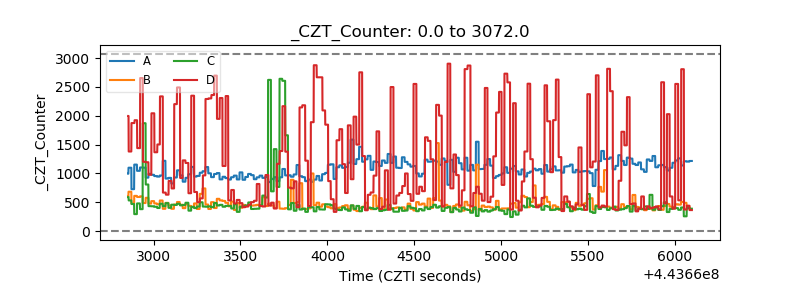 |
| +2.5 Volts monitor | 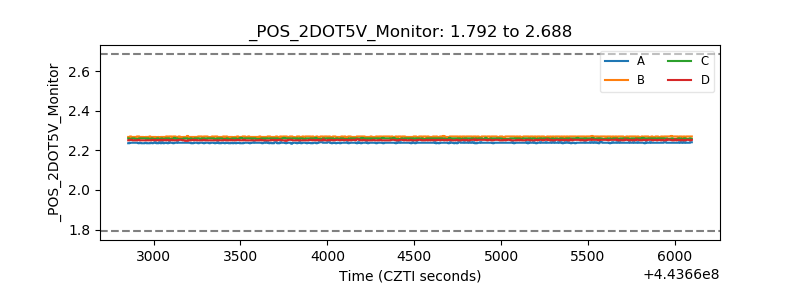 |
| +5 Volts monitor | 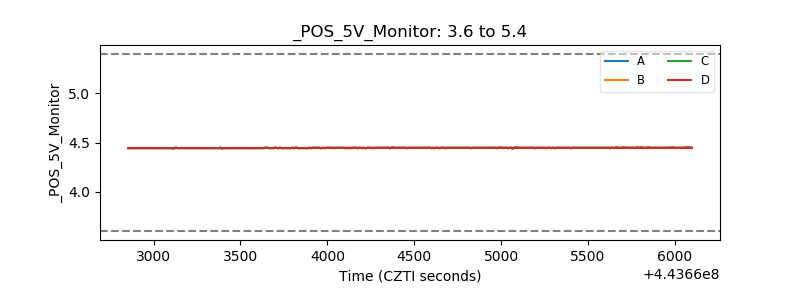 |
| _ROLL_ROT | 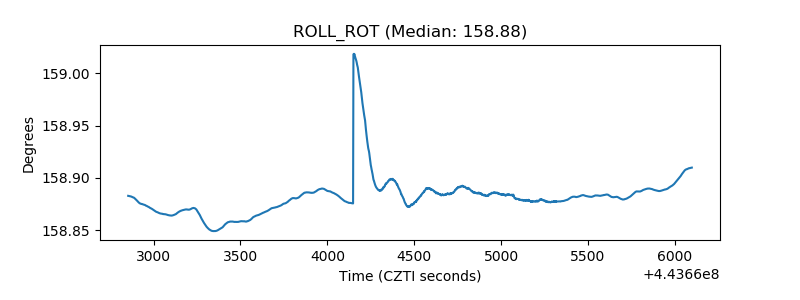 |
| _Roll_DEC | 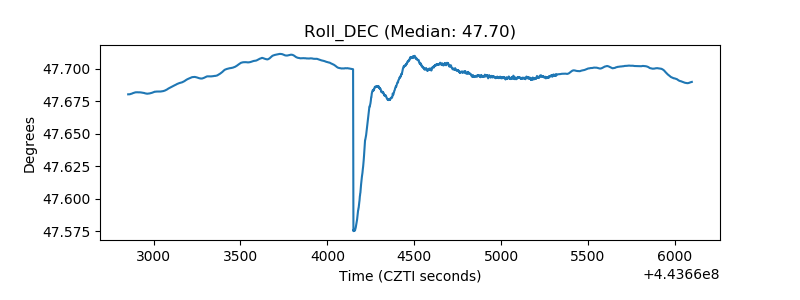 |
| _Roll_RA | 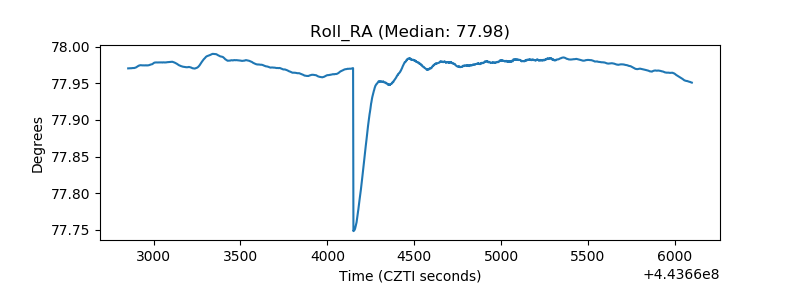 |
| Veto Counter | 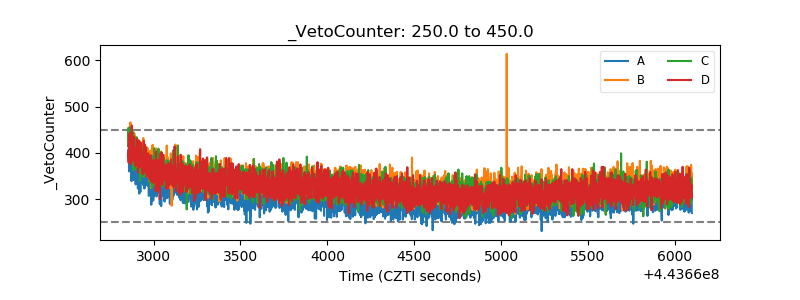 |