| Param | Original file | Final file |
|---|---|---|
| Filename | modeM0/AS1A13_074T07_9000006036_44983cztM0_level2.fits | modeM0/AS1A13_074T07_9000006036_44983cztM0_level2_quad_clean.evt |
| Size (bytes) | 613,728,000 | 109,091,520 |
| Size | 585.3 MB | 104.0 MB |
| Events in quadrant A | 5,596,265 | 757,286 |
| Events in quadrant B | 3,596,911 | 790,586 |
| Events in quadrant C | 3,117,257 | 761,790 |
| Events in quadrant D | 9,899,544 | 536,649 |
| Mode M9 | |||
|---|---|---|---|
| Quadrant | BADHDUFLAG | Total packets | Discarded packets |
| A | 0 | 17 | 0 |
| B | 0 | 18 | 0 |
| C | 0 | 18 | 0 |
| D | 0 | 18 | 0 |
| Mode SS | |||
|---|---|---|---|
| Quadrant | BADHDUFLAG | Total packets | Discarded packets |
| A | 0 | 130 | 0 |
| B | 0 | 130 | 0 |
| C | 0 | 130 | 0 |
| D | 0 | 130 | 0 |
| Mode M0 | |||
|---|---|---|---|
| Quadrant | BADHDUFLAG | Total packets | Discarded packets |
| A | 0 | 21619 | 3 |
| B | 0 | 14871 | 2 |
| C | 0 | 13708 | 2 |
| D | 0 | 34004 | 2 |
| Quadrant | Total seconds | Saturated seconds | Saturation percentage |
|---|---|---|---|
| A | 6561 | 274 | 4.176193% |
| B | 6561 | 134 | 2.042372% |
| C | 6561 | 29 | 0.442006% |
| D | 6561 | 1848 | 28.166438% |
Noise dominated data is calculated using 1-second bins in cleaned event files. If a bin has >2000 counts, and if more than 50% of those come from <1% of pixels, then it is considered to be noise-dominated and hence unusable.
| Quadrant | # 1 sec bins | Bins with >0 counts | Bins with >2000 counts | High rate bins dominated by noise | Noise dominated (total time) | Noise dominated (detector-on time) | Marked lightcurve |
|---|---|---|---|---|---|---|---|
| A | 7691 | 6562 | 15 | 15 | 0.20% | 0.23% | 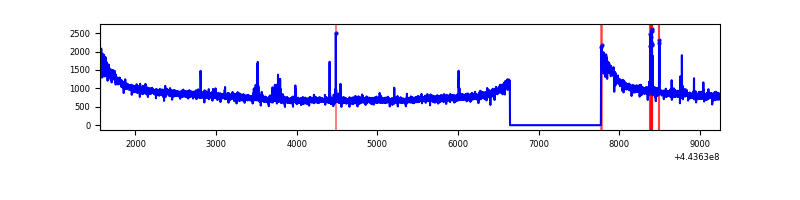 |
| B | 7691 | 6562 | 24 | 24 | 0.31% | 0.37% | 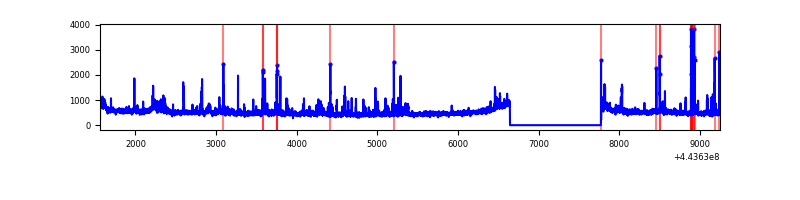 |
| C | 7691 | 6562 | 2 | 2 | 0.03% | 0.03% | 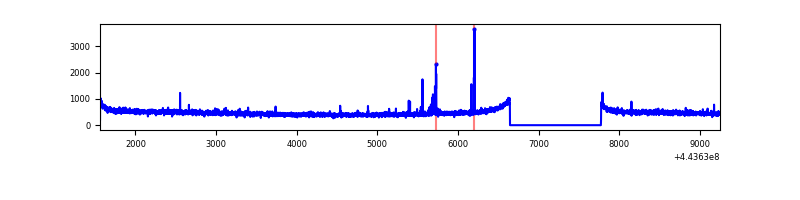 |
| D | 7691 | 6562 | 1610 | 1610 | 20.93% | 24.54% | 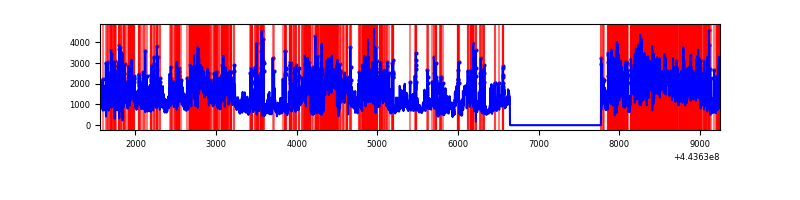 |
Top three noisy pixels from each quadrant. If the there are fewer than three noisy pixels in the level2.evt file, extra rows are filled as -1
| Pixel properties | Quadrant properties | ||||||
|---|---|---|---|---|---|---|---|
| Quadrant | DetID | PixID | Counts | Sigma | Mean | Median | Sigma |
| A | 10 | 83 | 2456207 | 14888.79 | 790 | 775 | 164.9 |
| A | 0 | 243 | 43427 | 258.62 | 790 | 775 | 164.9 |
| A | 7 | 3 | 21669 | 126.69 | 790 | 775 | 164.9 |
| B | 4 | 171 | 93192 | 586.98 | 794 | 770 | 157.5 |
| B | 5 | 255 | 69078 | 433.83 | 794 | 770 | 157.5 |
| B | 0 | 155 | 57863 | 362.6 | 794 | 770 | 157.5 |
| C | 14 | 254 | 24021 | 125.39 | 784 | 792 | 185.3 |
| C | 3 | 233 | 12495 | 63.17 | 784 | 792 | 185.3 |
| C | 15 | 208 | 12404 | 62.68 | 784 | 792 | 185.3 |
| D | 13 | 249 | 2168830 | 12195.32 | 702 | 683 | 177.8 |
| D | 11 | 241 | 1748161 | 9829.16 | 702 | 683 | 177.8 |
| D | 13 | 187 | 1337653 | 7520.14 | 702 | 683 | 177.8 |
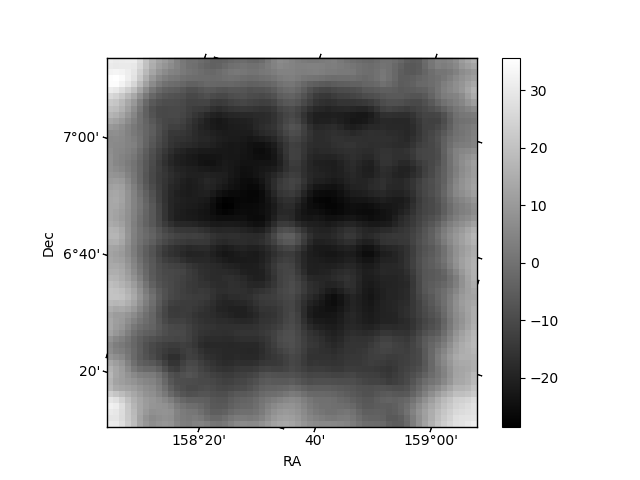
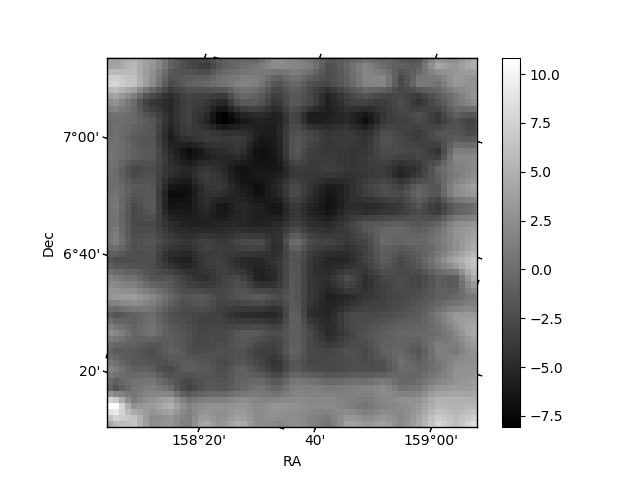
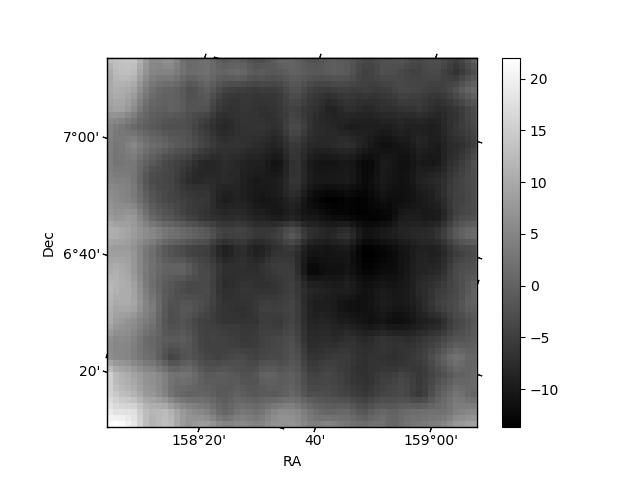
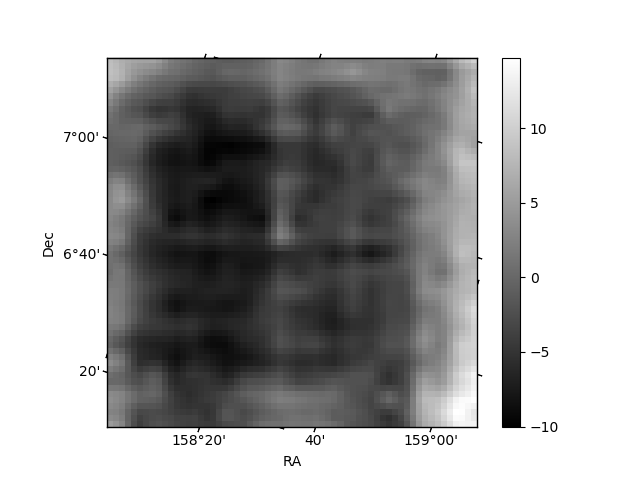
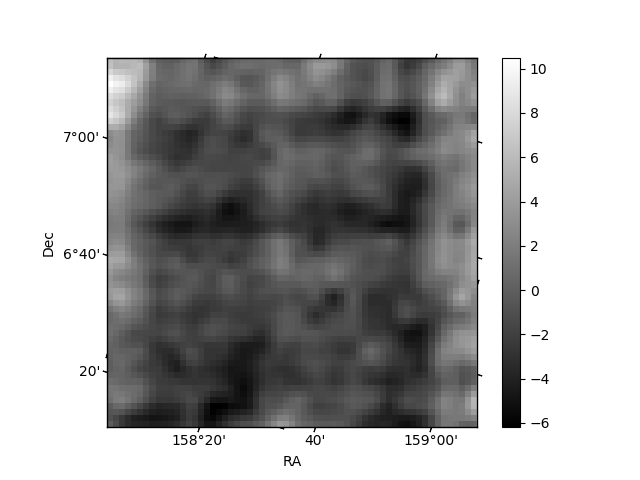
Histogram calculated using DETX and DETY for each event in the final _common_clean file
| Quadrant A | 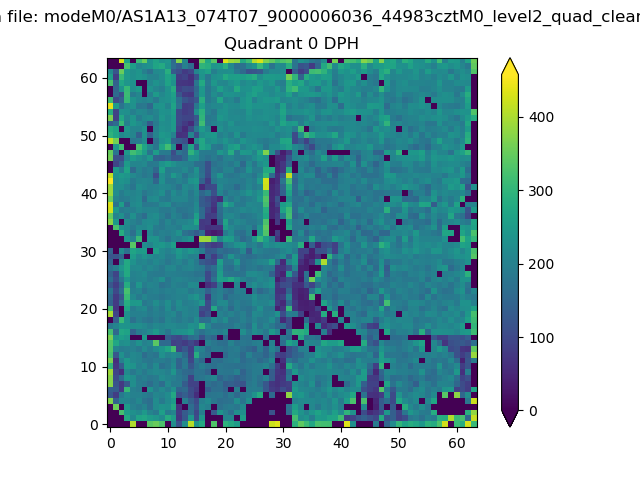 |
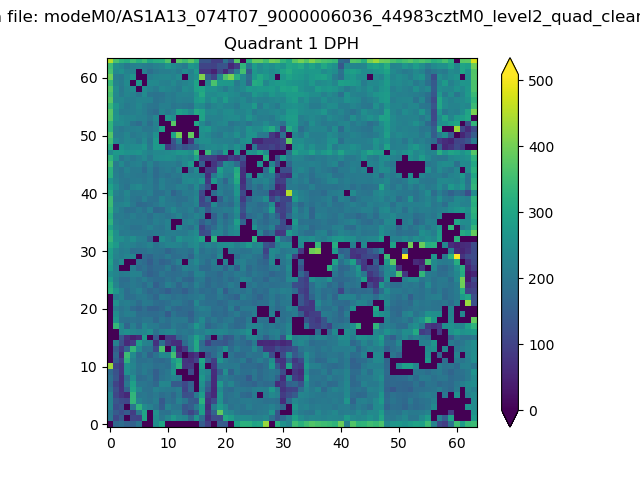 |
Quadrant B |
|---|---|---|---|
| Quadrant D | 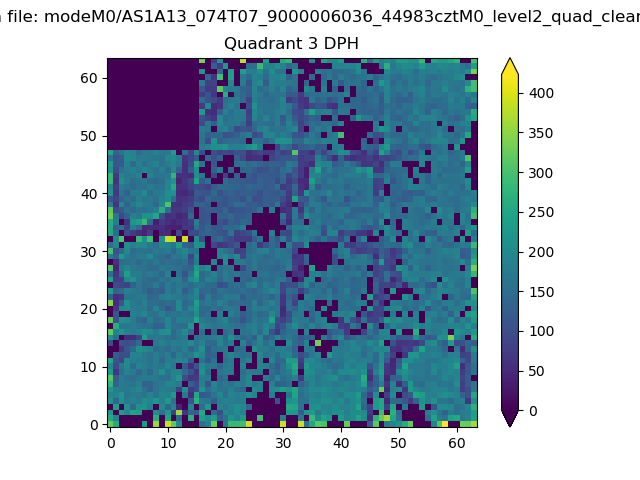 |
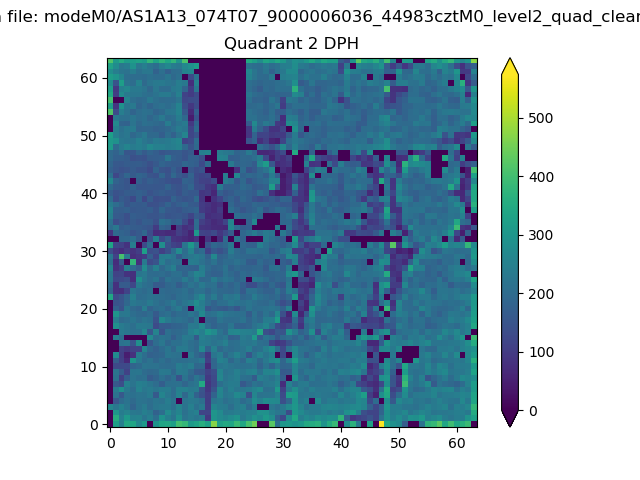 |
Quadrant C |
| Plot type | Count rate plots | Images |
|---|---|---|
| Comparison with Poisson distribution Blue bars denote a histogram of data divided into 1 sec bins. Red curve is a Poisson curve with rate = median count rate of data. |
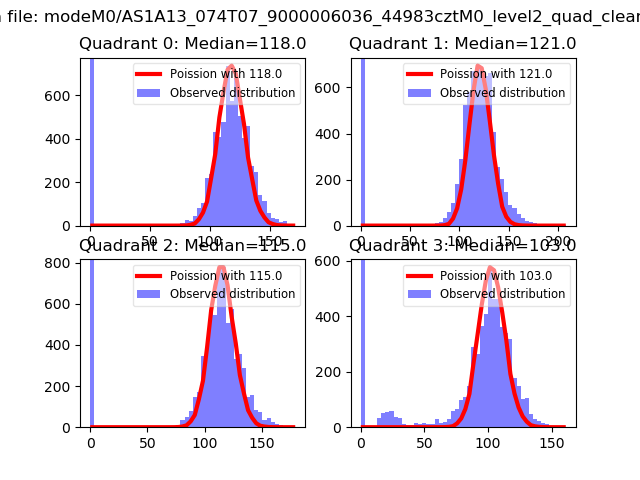 |
 |
| Quadrant-wise count rates Data is divided into 100 sec bins |
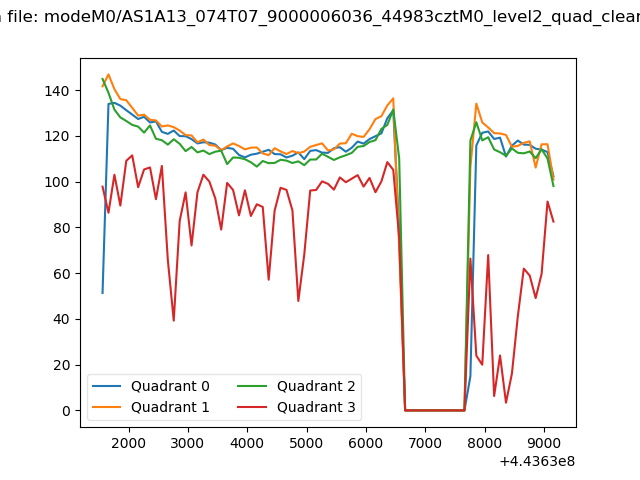 |
|
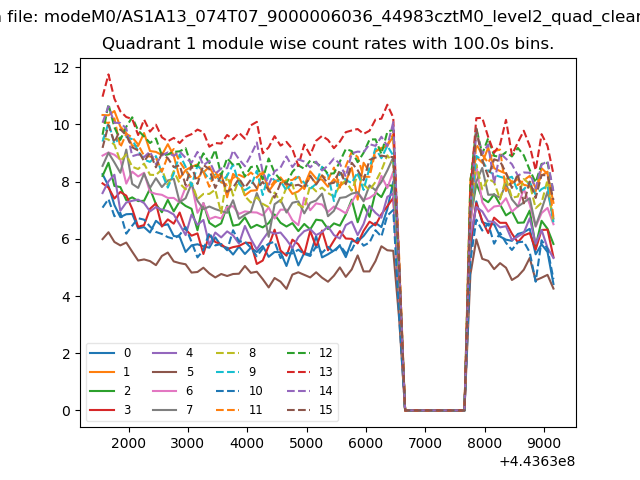
| Module-wise count rates for Quadrant A Data is divided into 100 sec bins |
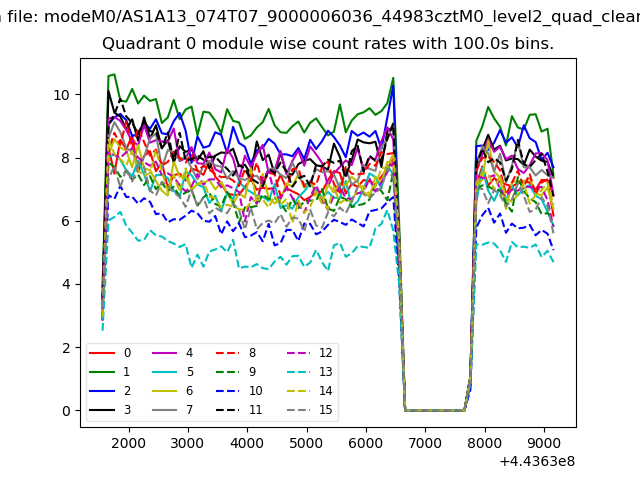 |
 |
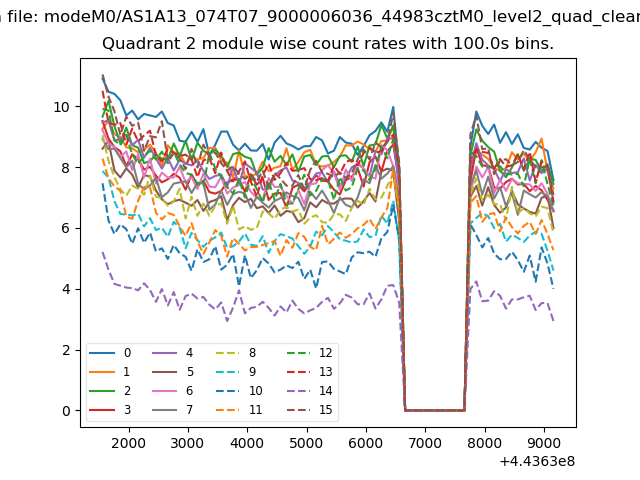
| Module-wise count rates for Quadrant B Data is divided into 100 sec bins |
 |
 |
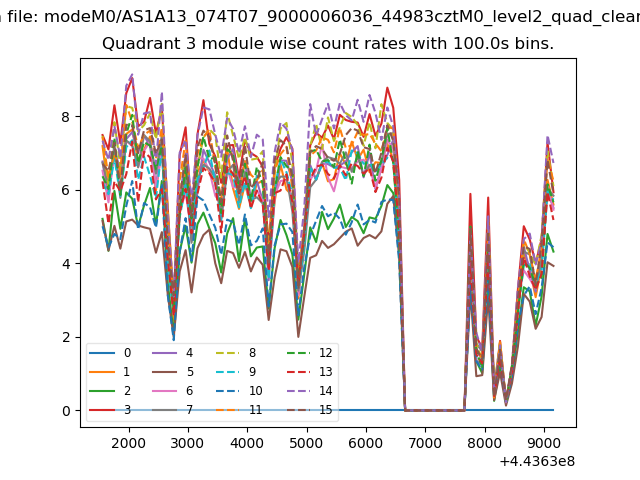
| Module-wise count rates for Quadrant C Data is divided into 100 sec bins |
 |
 |
| Module-wise count rates for Quadrant D Data is divided into 100 sec bins |
 |
 |
| Parameter | Plot |
|---|---|
| CZT HV Monitor | 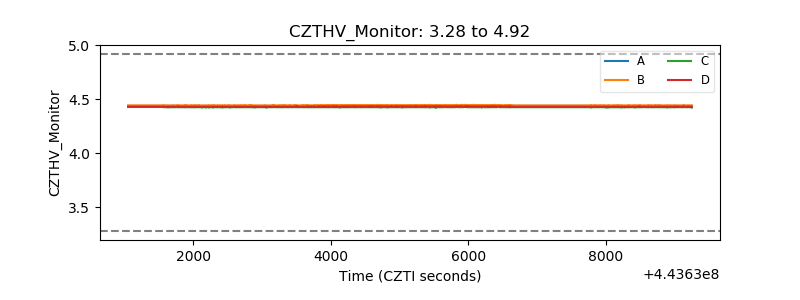 |
| D_VDD | 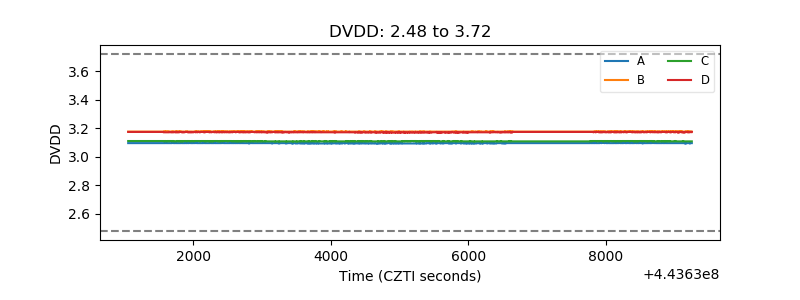 |
| Temperature 1 | 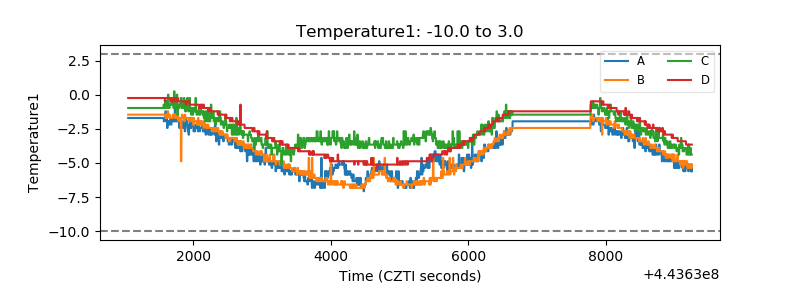 |
| Veto HV Monitor | 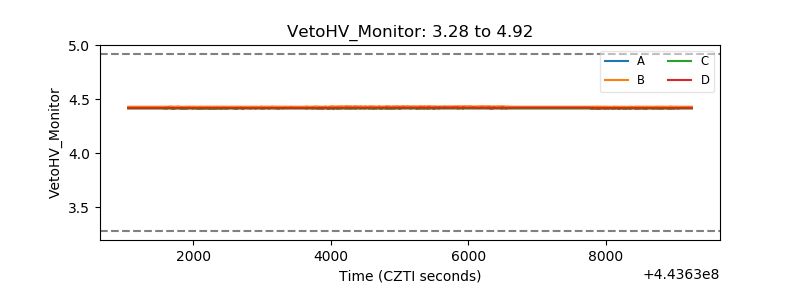 |
| Veto LLD | 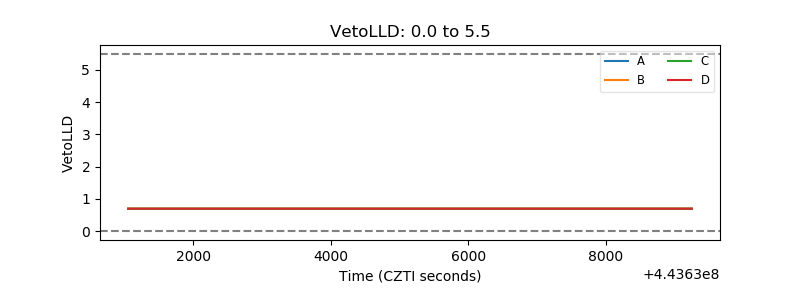 |
| Alpha Counter | 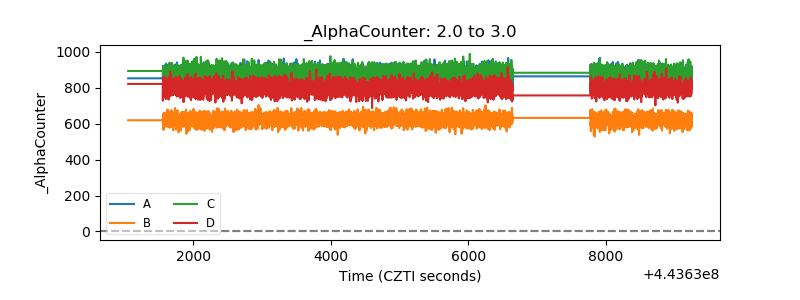 |
| _CPM_Rate | 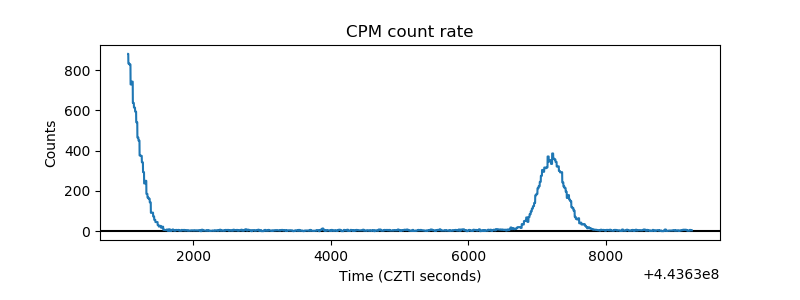 |
| CZT Counter | 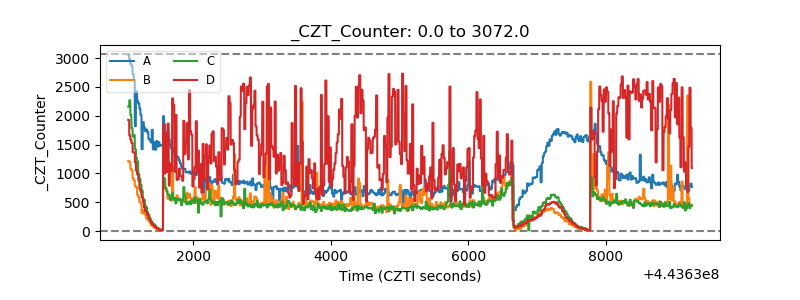 |
| +2.5 Volts monitor | 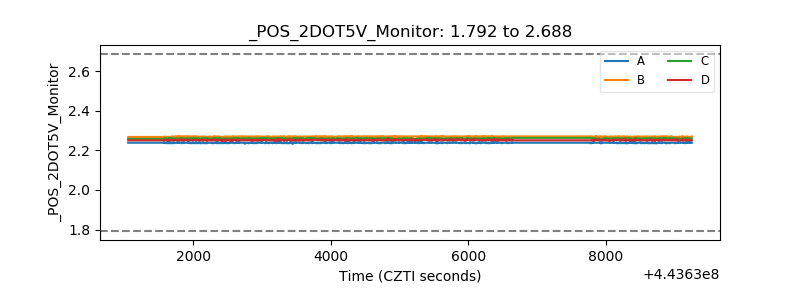 |
| +5 Volts monitor | 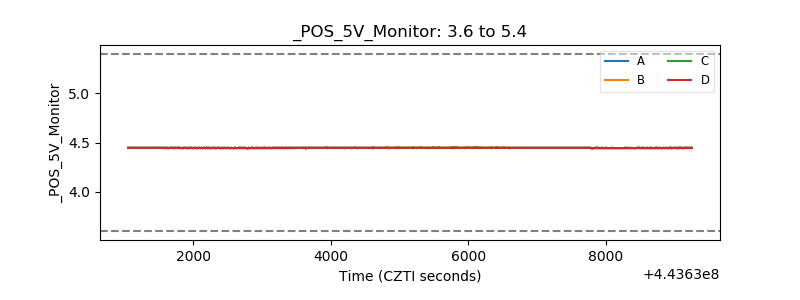 |
| _ROLL_ROT | 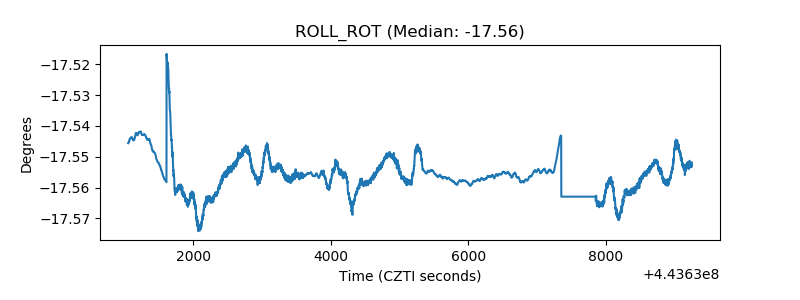 |
| _Roll_DEC | 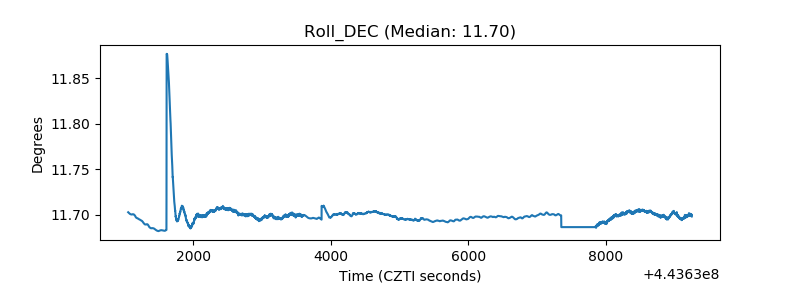 |
| _Roll_RA | 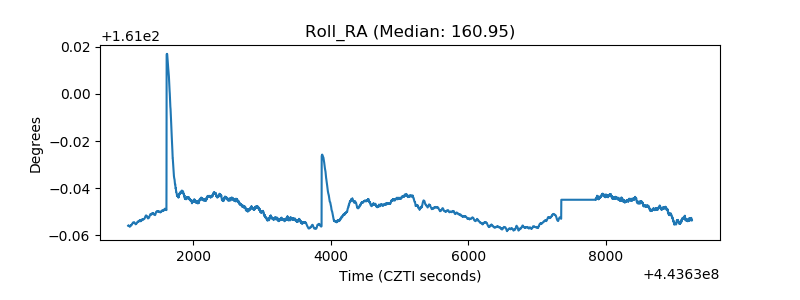 |
| Veto Counter | 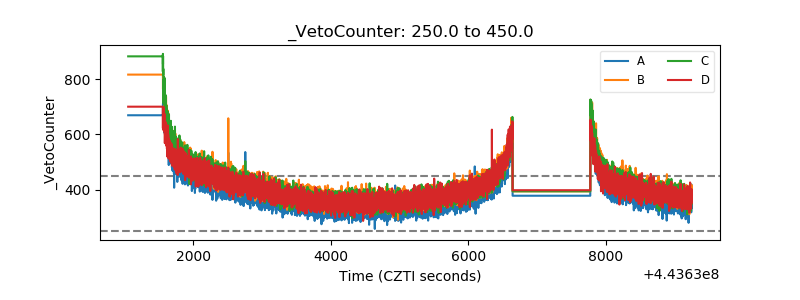 |