| Param | Original file | Final file |
|---|---|---|
| Filename | modeM0/AS1A13_074T07_9000006036_44984cztM0_level2.fits | modeM0/AS1A13_074T07_9000006036_44984cztM0_level2_quad_clean.evt |
| Size (bytes) | 291,332,160 | 46,978,560 |
| Size | 277.8 MB | 44.8 MB |
| Events in quadrant A | 2,441,744 | 338,687 |
| Events in quadrant B | 1,585,273 | 344,138 |
| Events in quadrant C | 1,297,143 | 330,466 |
| Events in quadrant D | 5,224,010 | 193,915 |
| Mode SS | |||
|---|---|---|---|
| Quadrant | BADHDUFLAG | Total packets | Discarded packets |
| A | 0 | 62 | 0 |
| B | 0 | 62 | 0 |
| C | 0 | 62 | 0 |
| D | 0 | 62 | 0 |
| Mode M0 | |||
|---|---|---|---|
| Quadrant | BADHDUFLAG | Total packets | Discarded packets |
| A | 0 | 9692 | 1 |
| B | 0 | 6723 | 1 |
| C | 0 | 6078 | 1 |
| D | 0 | 17612 | 1 |
| Quadrant | Total seconds | Saturated seconds | Saturation percentage |
|---|---|---|---|
| A | 3017 | 50 | 1.657275% |
| B | 3018 | 38 | 1.259112% |
| C | 3018 | 1 | 0.033135% |
| D | 3018 | 1233 | 40.854871% |
Noise dominated data is calculated using 1-second bins in cleaned event files. If a bin has >2000 counts, and if more than 50% of those come from <1% of pixels, then it is considered to be noise-dominated and hence unusable.
| Quadrant | # 1 sec bins | Bins with >0 counts | Bins with >2000 counts | High rate bins dominated by noise | Noise dominated (total time) | Noise dominated (detector-on time) | Marked lightcurve |
|---|---|---|---|---|---|---|---|
| A | 3017 | 3017 | 10 | 10 | 0.33% | 0.33% | 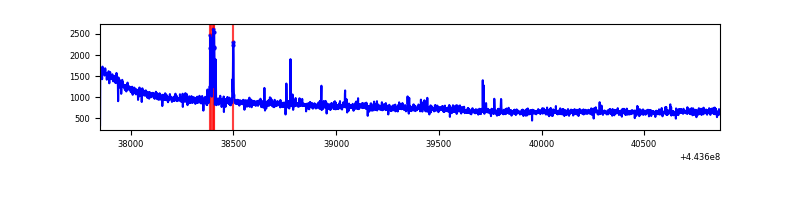 |
| B | 3018 | 3018 | 24 | 24 | 0.80% | 0.80% | 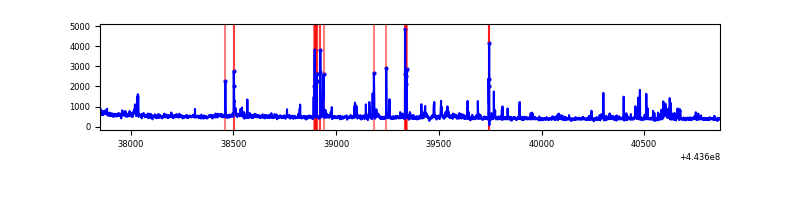 |
| C | 3018 | 3018 | 0 | 0 | 0.00% | 0.00% | 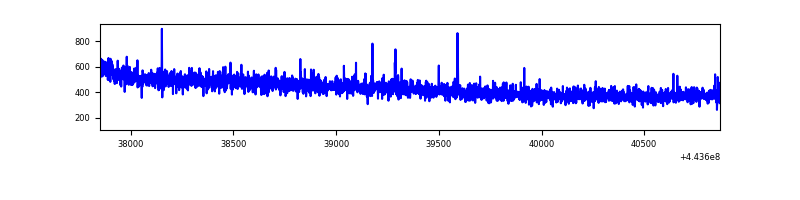 |
| D | 3018 | 3018 | 1188 | 1188 | 39.36% | 39.36% | 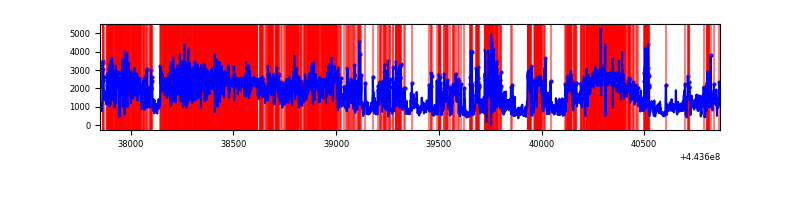 |
Top three noisy pixels from each quadrant. If the there are fewer than three noisy pixels in the level2.evt file, extra rows are filled as -1
| Pixel properties | Quadrant properties | ||||||
|---|---|---|---|---|---|---|---|
| Quadrant | DetID | PixID | Counts | Sigma | Mean | Median | Sigma |
| A | 10 | 83 | 1094334 | 15410.27 | 333 | 325 | 71.0 |
| A | 0 | 243 | 42036 | 587.54 | 333 | 325 | 71.0 |
| A | 0 | 227 | 9236 | 125.52 | 333 | 325 | 71.0 |
| B | 4 | 171 | 56950 | 837.35 | 335 | 325 | 67.6 |
| B | 5 | 255 | 36837 | 539.93 | 335 | 325 | 67.6 |
| B | 0 | 245 | 32286 | 472.63 | 335 | 325 | 67.6 |
| C | 1 | 3 | 2685 | 29.9 | 330 | 333 | 78.7 |
| C | 3 | 233 | 2330 | 25.39 | 330 | 333 | 78.7 |
| C | 13 | 61 | 2247 | 24.34 | 330 | 333 | 78.7 |
| D | 13 | 249 | 1648802 | 23523.36 | 269 | 259 | 70.1 |
| D | 11 | 241 | 1102701 | 15730.94 | 269 | 259 | 70.1 |
| D | 13 | 187 | 483543 | 6896.07 | 269 | 259 | 70.1 |
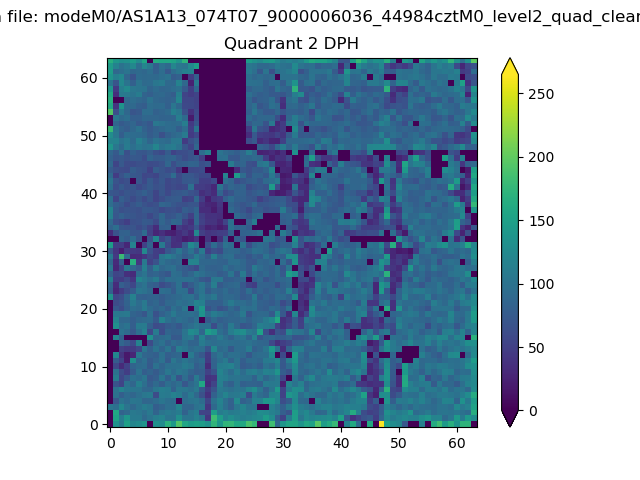
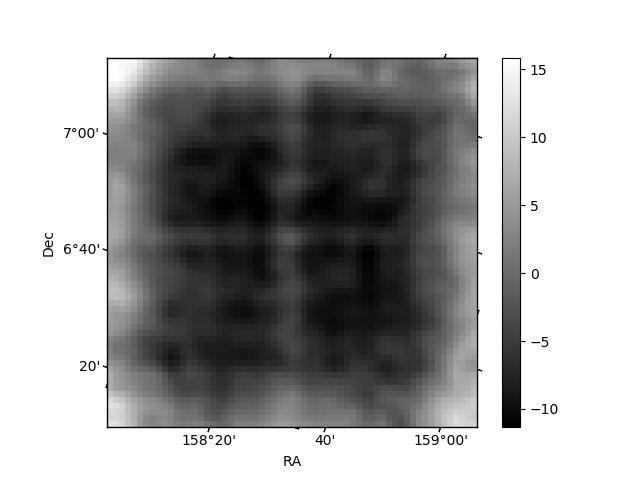
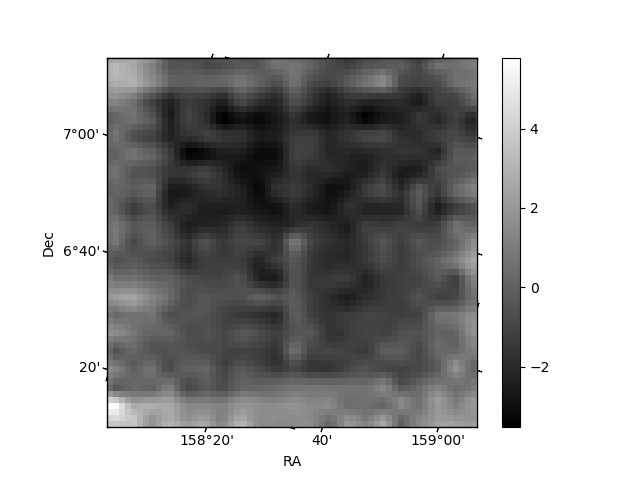
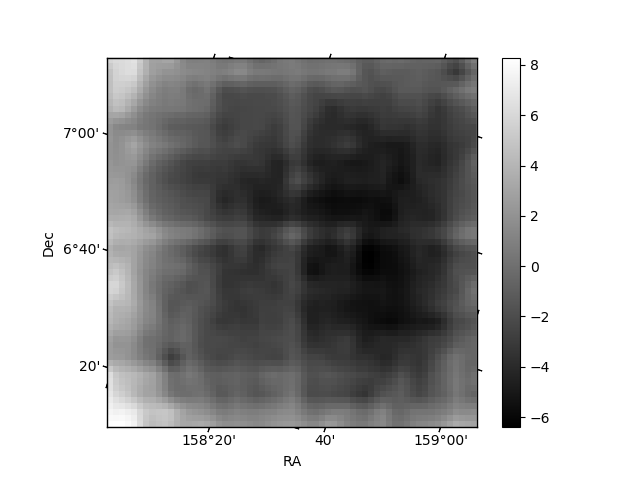
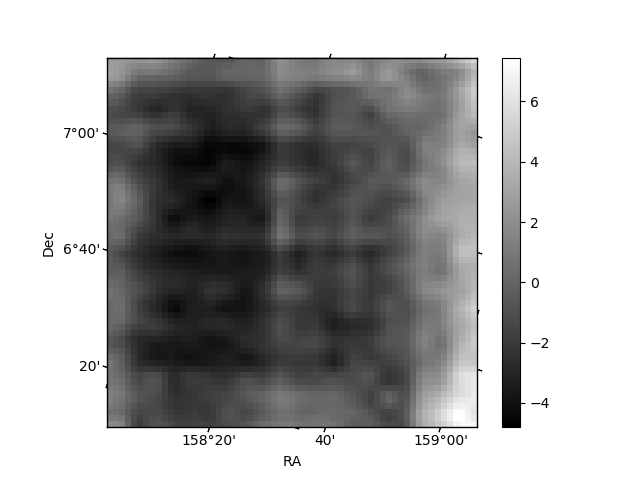
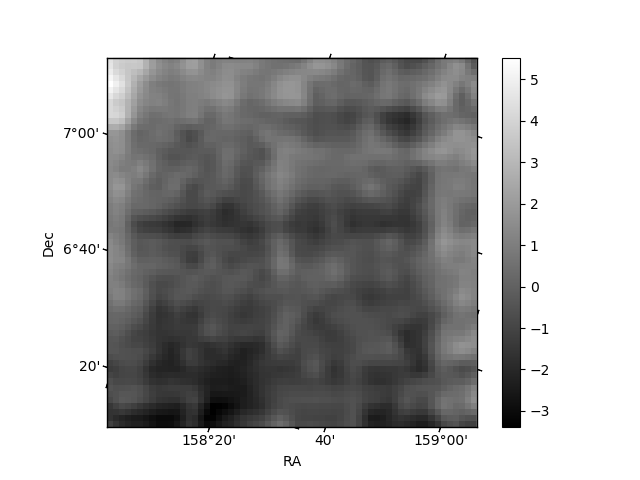
Histogram calculated using DETX and DETY for each event in the final _common_clean file
| Quadrant A | 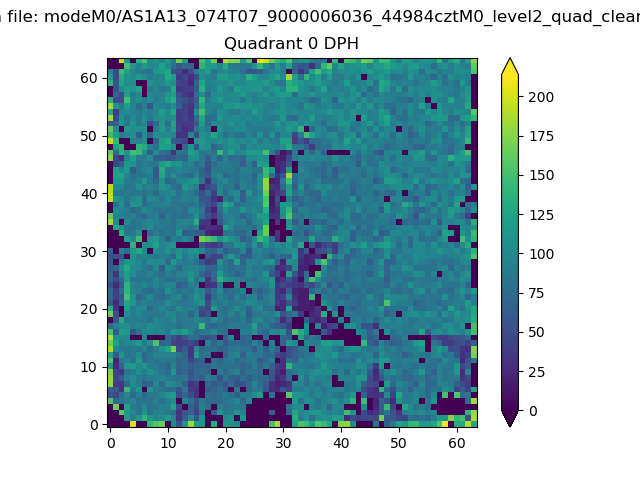 |
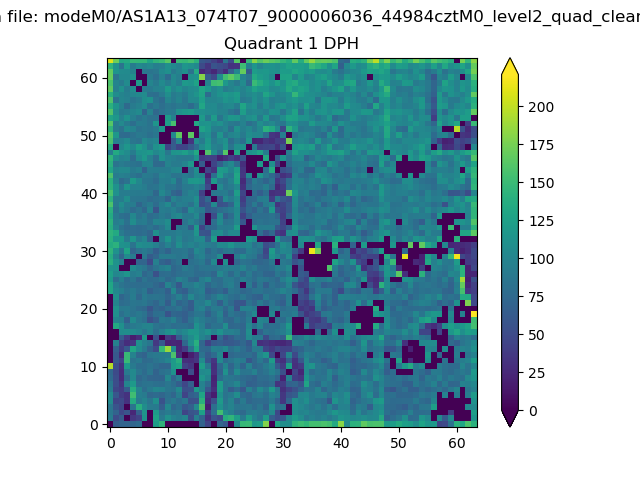 |
Quadrant B |
|---|---|---|---|
| Quadrant D | 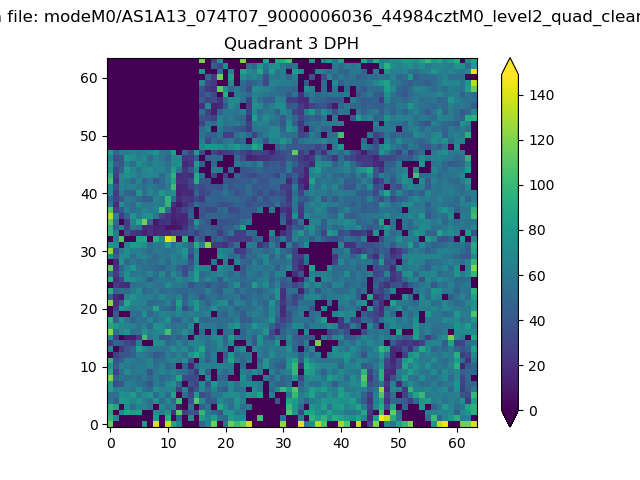 |
 |
Quadrant C |
| Plot type | Count rate plots | Images |
|---|---|---|
| Comparison with Poisson distribution Blue bars denote a histogram of data divided into 1 sec bins. Red curve is a Poisson curve with rate = median count rate of data. |
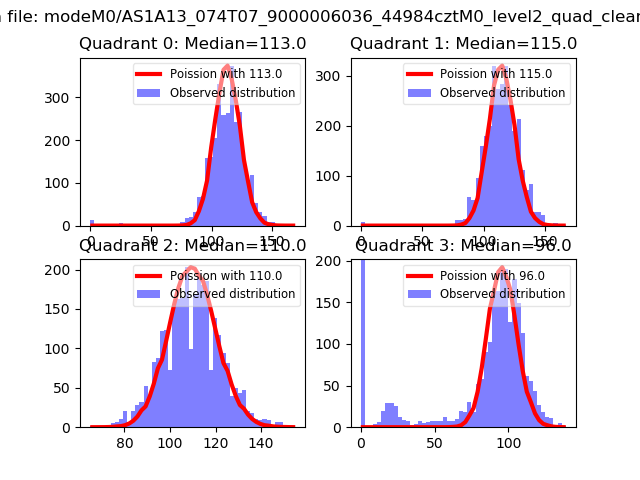 |
 |
| Quadrant-wise count rates Data is divided into 100 sec bins |
 |
|
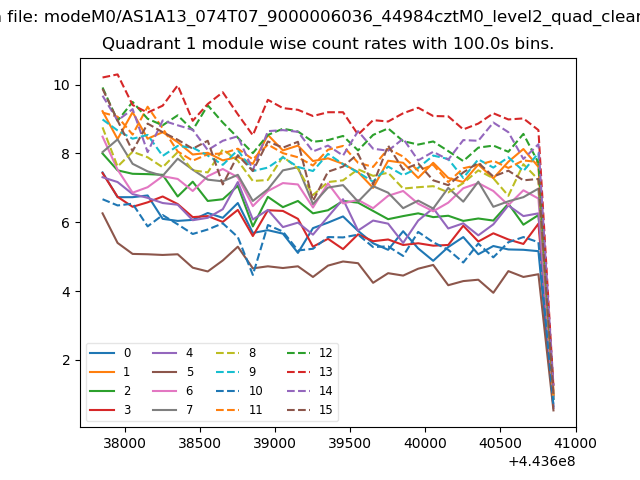
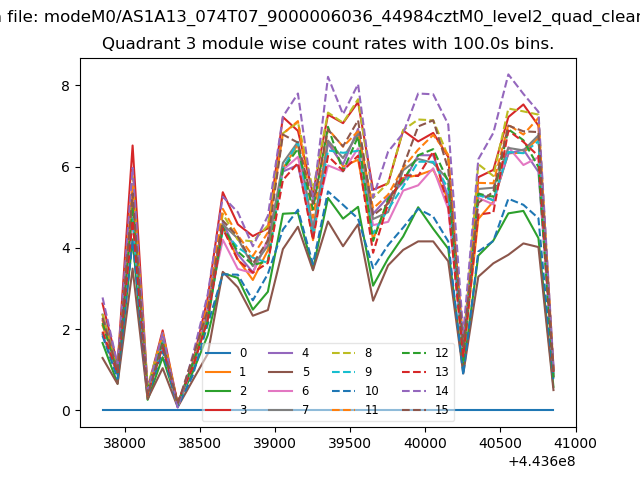
| Module-wise count rates for Quadrant A Data is divided into 100 sec bins |
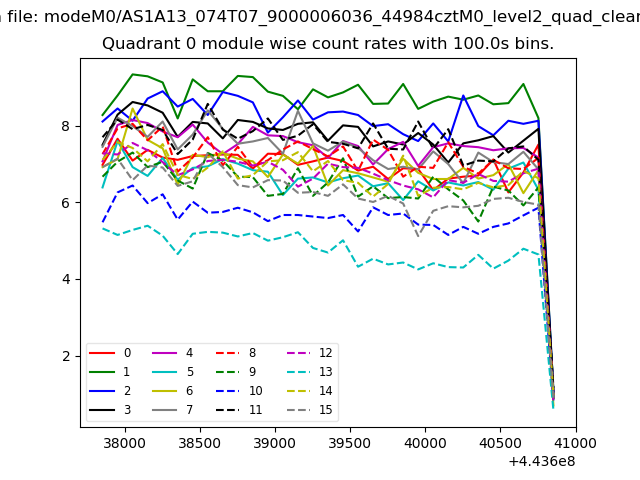 |
 |
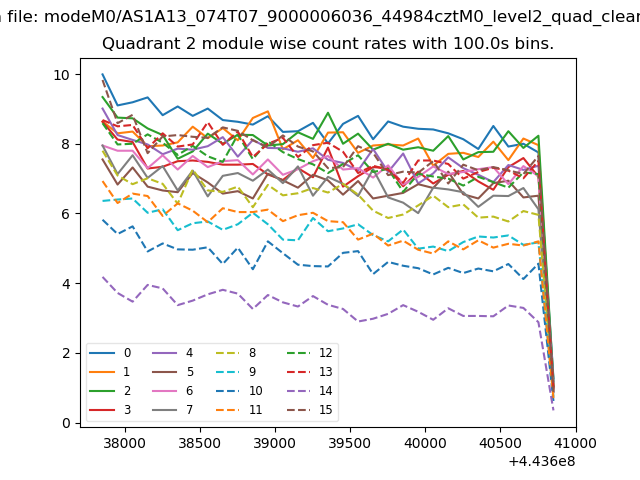
| Module-wise count rates for Quadrant B Data is divided into 100 sec bins |
 |
 |
| Module-wise count rates for Quadrant C Data is divided into 100 sec bins |
 |
 |
| Module-wise count rates for Quadrant D Data is divided into 100 sec bins |
 |
 |
| Parameter | Plot |
|---|---|
| CZT HV Monitor | 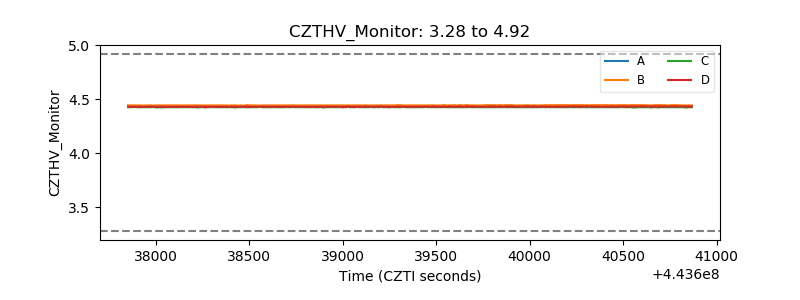 |
| D_VDD | 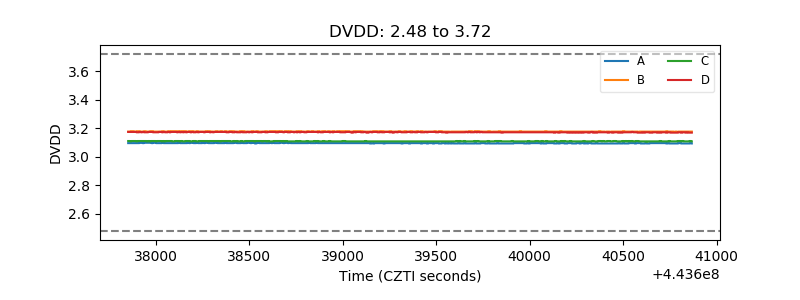 |
| Temperature 1 | 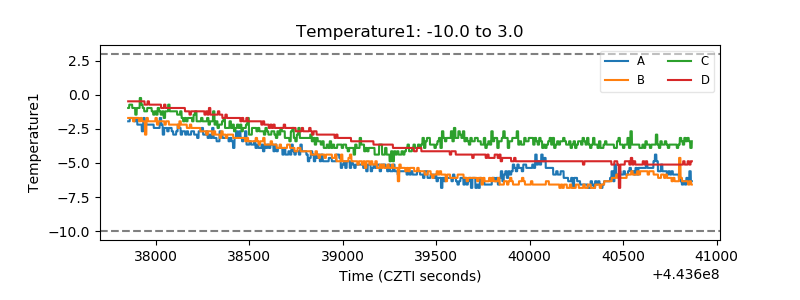 |
| Veto HV Monitor | 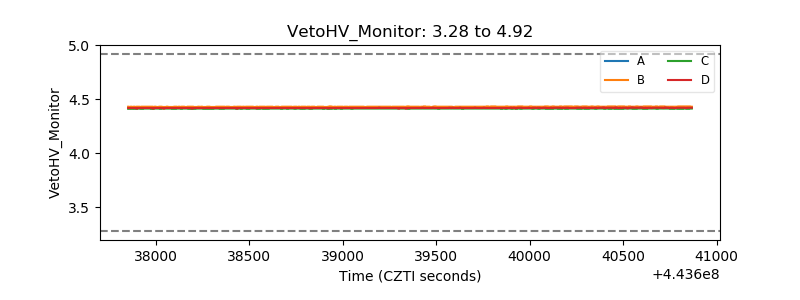 |
| Veto LLD | 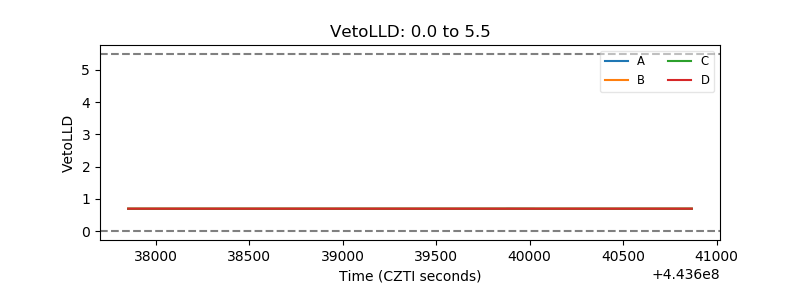 |
| Alpha Counter |  |
| _CPM_Rate | 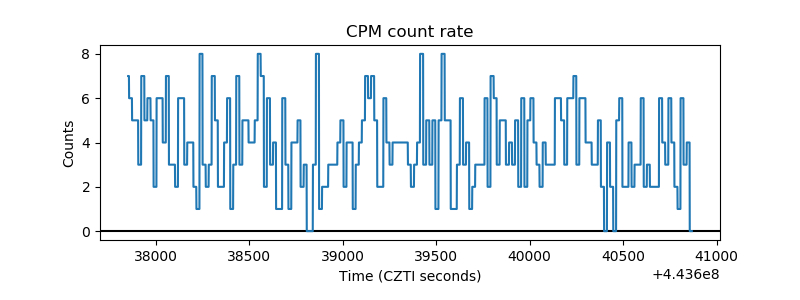 |
| CZT Counter | 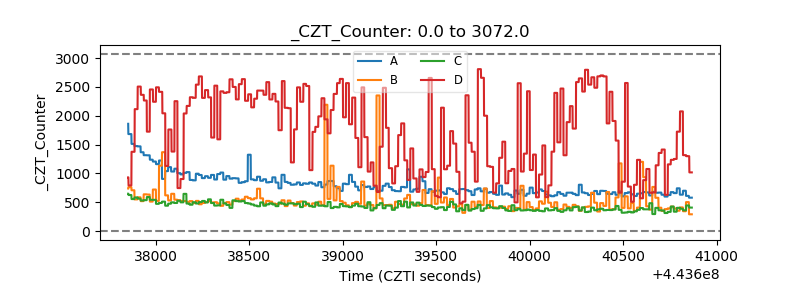 |
| +2.5 Volts monitor | 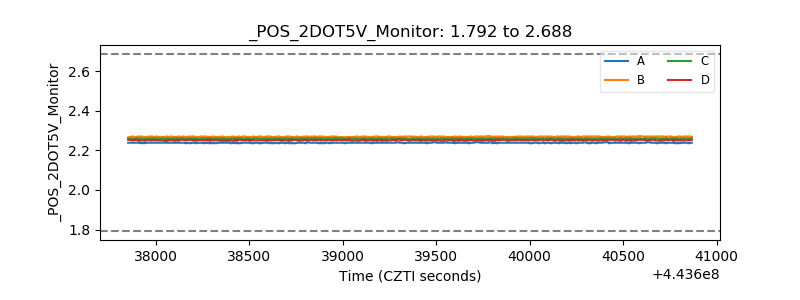 |
| +5 Volts monitor | 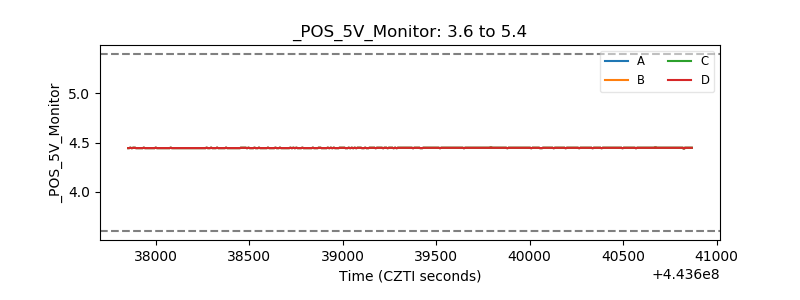 |
| _ROLL_ROT | 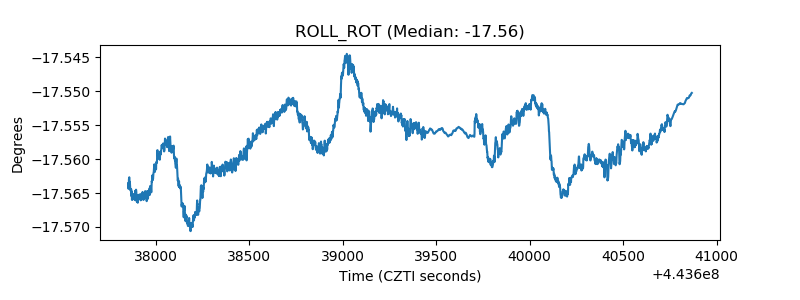 |
| _Roll_DEC | 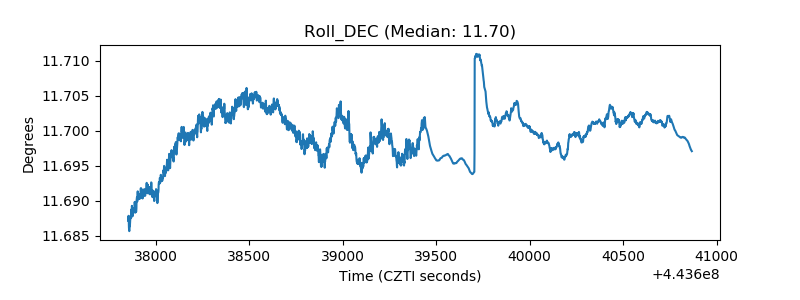 |
| _Roll_RA | 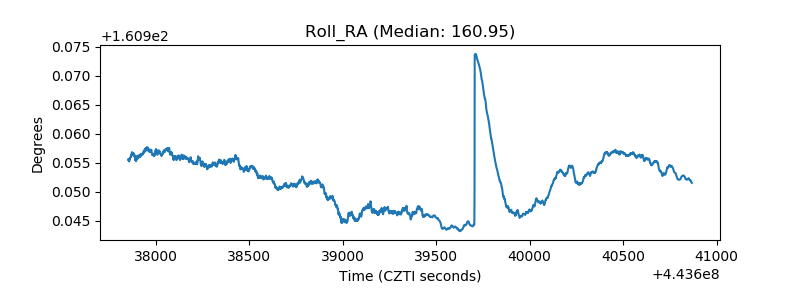 |
| Veto Counter | 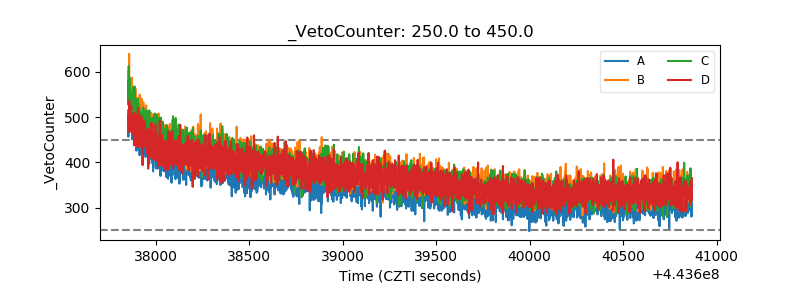 |