| Param | Original file | Final file |
|---|---|---|
| Filename | modeM0/AS1A13_020T01_9000006040_44990cztM0_level2.fits | modeM0/AS1A13_020T01_9000006040_44990cztM0_level2_quad_clean.evt |
| Size (bytes) | 685,235,520 | 121,109,760 |
| Size | 653.5 MB | 115.5 MB |
| Events in quadrant A | 8,864,858 | 809,180 |
| Events in quadrant B | 4,584,487 | 833,992 |
| Events in quadrant C | 3,562,150 | 830,005 |
| Events in quadrant D | 7,747,614 | 648,993 |
| Mode SS | |||
|---|---|---|---|
| Quadrant | BADHDUFLAG | Total packets | Discarded packets |
| A | 0 | 160 | 0 |
| B | 0 | 160 | 0 |
| C | 0 | 160 | 0 |
| D | 0 | 160 | 0 |
| Mode M9 | |||
|---|---|---|---|
| Quadrant | BADHDUFLAG | Total packets | Discarded packets |
| A | 0 | 9 | 0 |
| B | 0 | 9 | 0 |
| C | 0 | 9 | 0 |
| D | 0 | 9 | 0 |
| Mode M0 | |||
|---|---|---|---|
| Quadrant | BADHDUFLAG | Total packets | Discarded packets |
| A | 0 | 31966 | 5 |
| B | 0 | 19062 | 2 |
| C | 0 | 16222 | 2 |
| D | 0 | 28481 | 2 |
| Quadrant | Total seconds | Saturated seconds | Saturation percentage |
|---|---|---|---|
| A | 7833 | 337 | 4.302311% |
| B | 7834 | 339 | 4.327291% |
| C | 7834 | 32 | 0.408476% |
| D | 7834 | 1255 | 16.019913% |
Noise dominated data is calculated using 1-second bins in cleaned event files. If a bin has >2000 counts, and if more than 50% of those come from <1% of pixels, then it is considered to be noise-dominated and hence unusable.
| Quadrant | # 1 sec bins | Bins with >0 counts | Bins with >2000 counts | High rate bins dominated by noise | Noise dominated (total time) | Noise dominated (detector-on time) | Marked lightcurve |
|---|---|---|---|---|---|---|---|
| A | 8704 | 7837 | 17 | 17 | 0.20% | 0.22% | 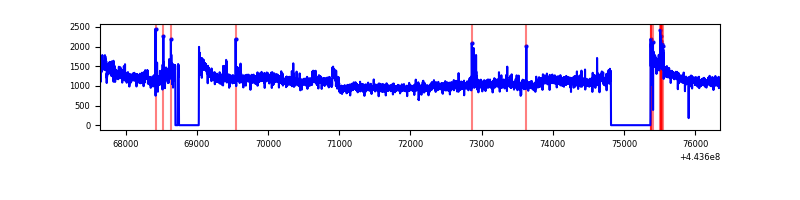 |
| B | 8704 | 7837 | 152 | 152 | 1.75% | 1.94% | 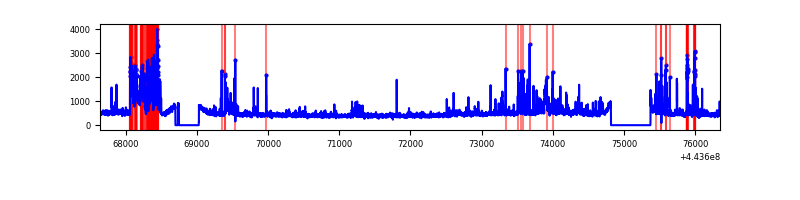 |
| C | 8704 | 7837 | 3 | 3 | 0.03% | 0.04% | 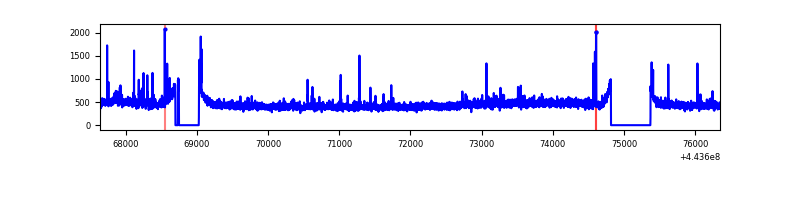 |
| D | 8704 | 7837 | 988 | 988 | 11.35% | 12.61% | 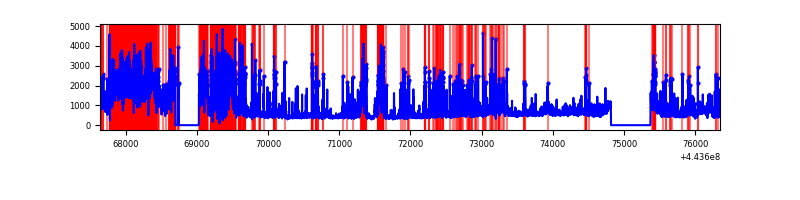 |
Top three noisy pixels from each quadrant. If the there are fewer than three noisy pixels in the level2.evt file, extra rows are filled as -1
| Pixel properties | Quadrant properties | ||||||
|---|---|---|---|---|---|---|---|
| Quadrant | DetID | PixID | Counts | Sigma | Mean | Median | Sigma |
| A | 10 | 83 | 2658567 | 14275.35 | 883 | 861 | 186.2 |
| A | 0 | 247 | 2543124 | 13655.27 | 883 | 861 | 186.2 |
| A | 0 | 226 | 170012 | 908.56 | 883 | 861 | 186.2 |
| B | 0 | 189 | 537871 | 3024.23 | 885 | 857 | 177.6 |
| B | 5 | 255 | 254600 | 1428.97 | 885 | 857 | 177.6 |
| B | 15 | 35 | 88809 | 495.31 | 885 | 857 | 177.6 |
| C | 15 | 208 | 48140 | 226.15 | 881 | 885 | 209.0 |
| C | 14 | 254 | 38365 | 179.37 | 881 | 885 | 209.0 |
| C | 3 | 233 | 21851 | 100.34 | 881 | 885 | 209.0 |
| D | 13 | 249 | 2391171 | 11459.56 | 815 | 791 | 208.6 |
| D | 2 | 249 | 969262 | 4642.88 | 815 | 791 | 208.6 |
| D | 12 | 33 | 289258 | 1382.92 | 815 | 791 | 208.6 |
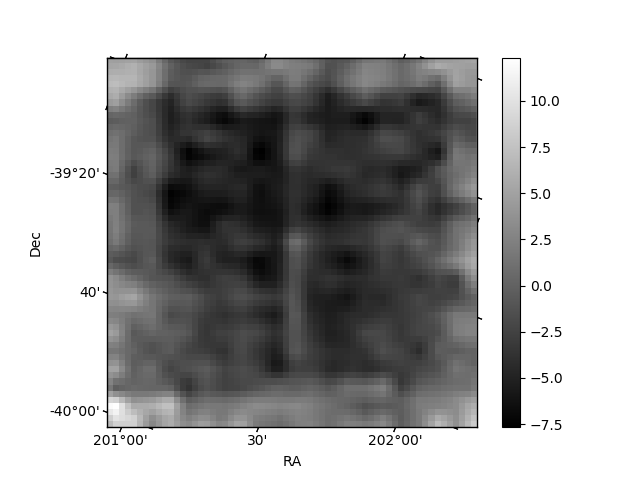
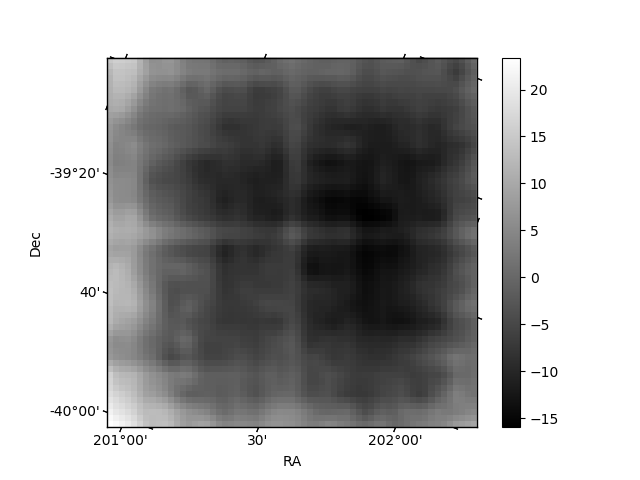
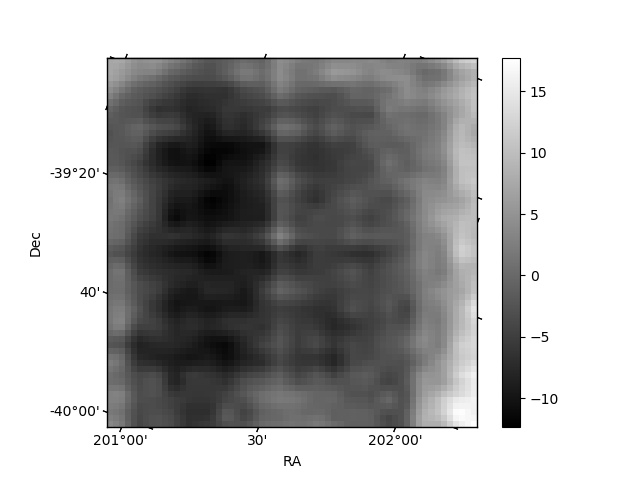
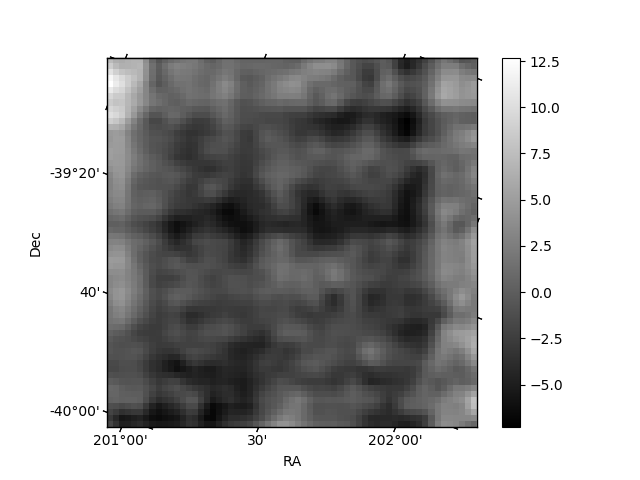
Histogram calculated using DETX and DETY for each event in the final _common_clean file
| Quadrant A | 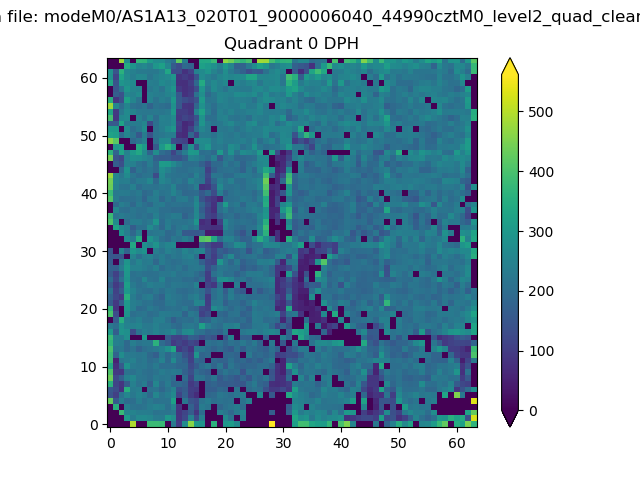 |
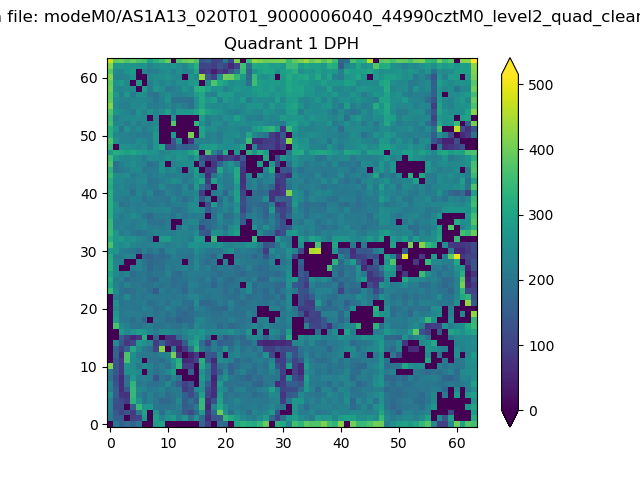 |
Quadrant B |
|---|---|---|---|
| Quadrant D | 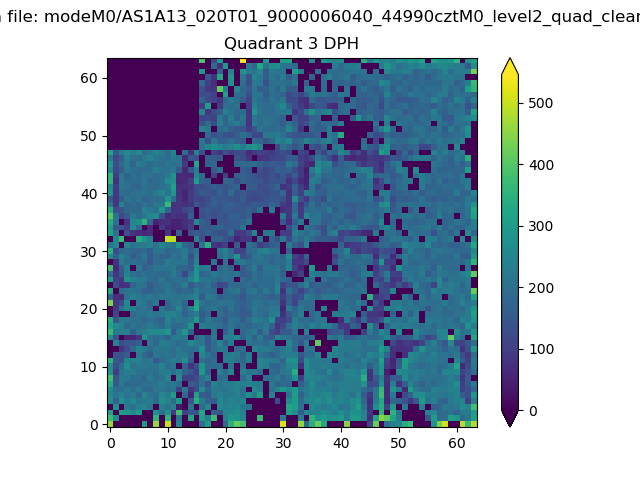 |
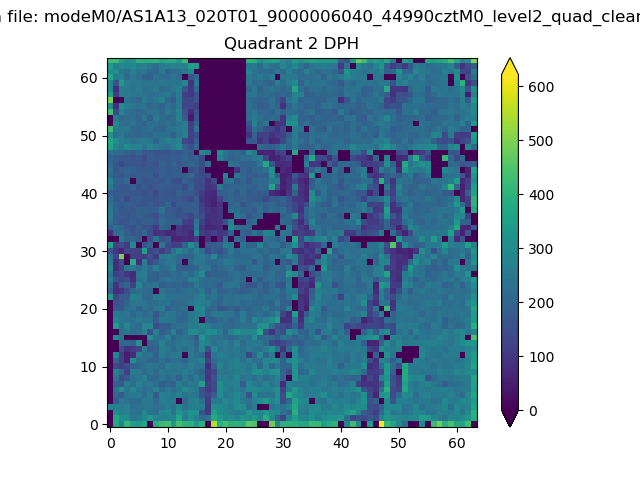 |
Quadrant C |
| Plot type | Count rate plots | Images |
|---|---|---|
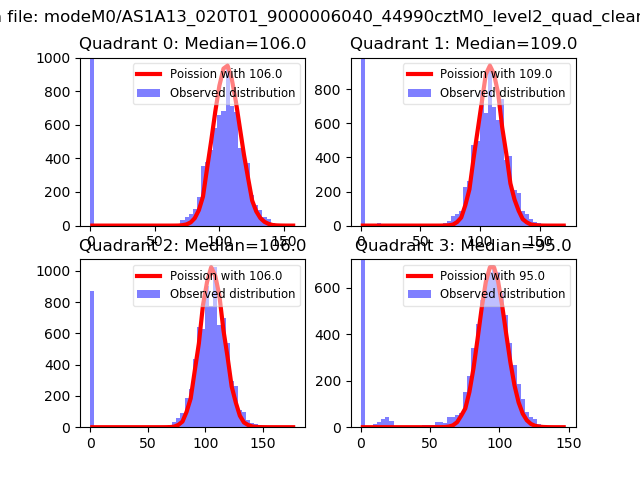
| Comparison with Poisson distribution Blue bars denote a histogram of data divided into 1 sec bins. Red curve is a Poisson curve with rate = median count rate of data. |
 |
 |
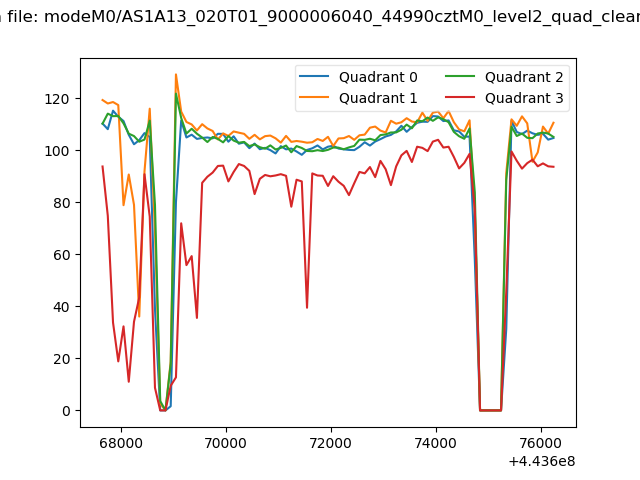
| Quadrant-wise count rates Data is divided into 100 sec bins |
 |
|
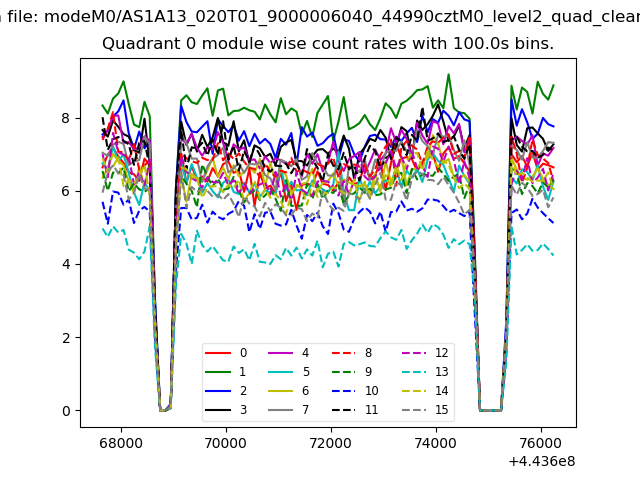
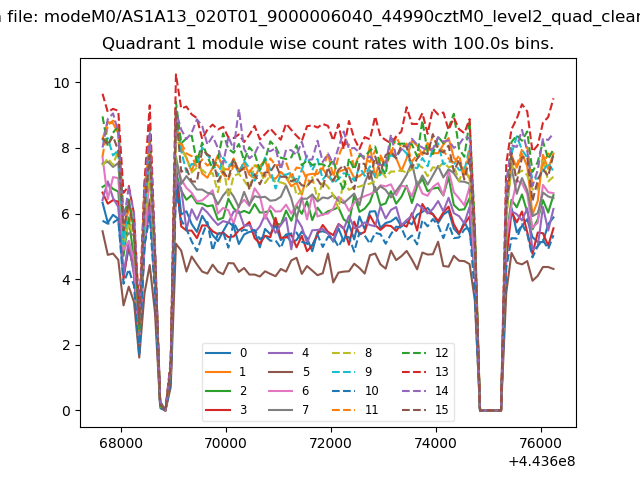
| Module-wise count rates for Quadrant A Data is divided into 100 sec bins |
 |
 |
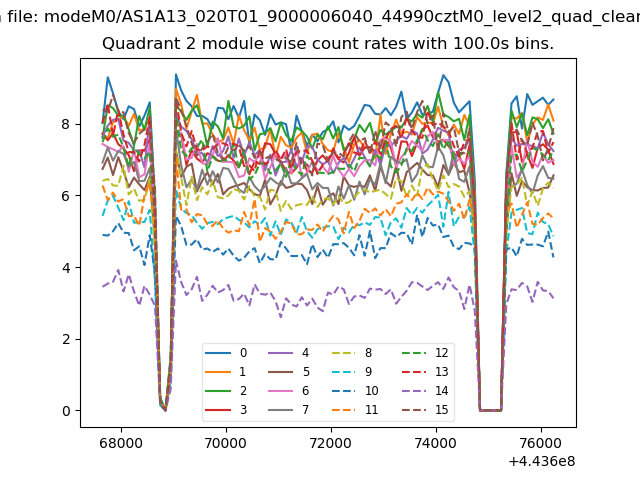
| Module-wise count rates for Quadrant B Data is divided into 100 sec bins |
 |
 |
| Module-wise count rates for Quadrant C Data is divided into 100 sec bins |
 |
 |
| Module-wise count rates for Quadrant D Data is divided into 100 sec bins |
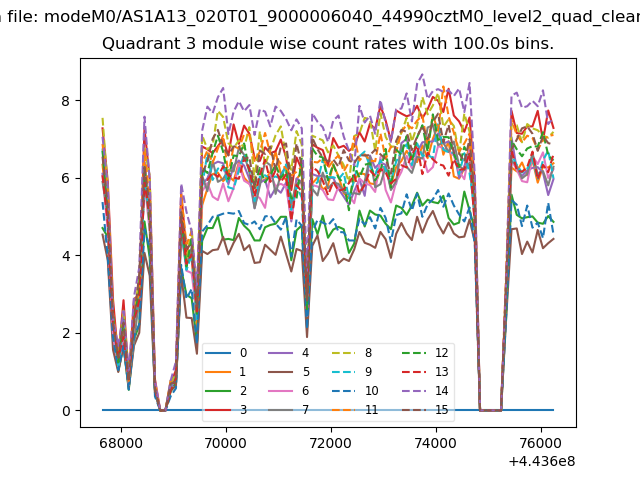 |
 |
| Parameter | Plot |
|---|---|
| CZT HV Monitor | 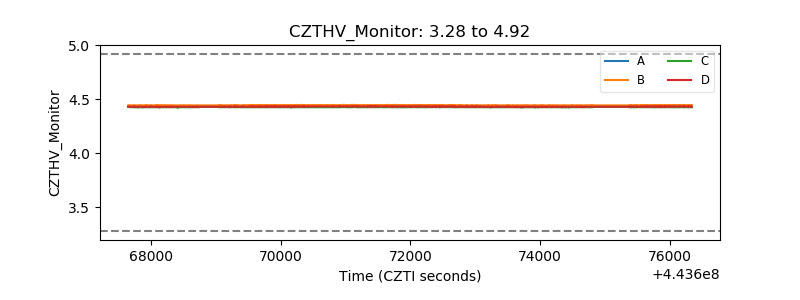 |
| D_VDD | 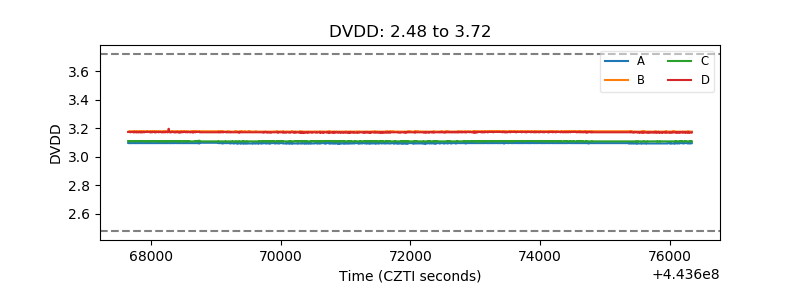 |
| Temperature 1 |  |
| Veto HV Monitor | 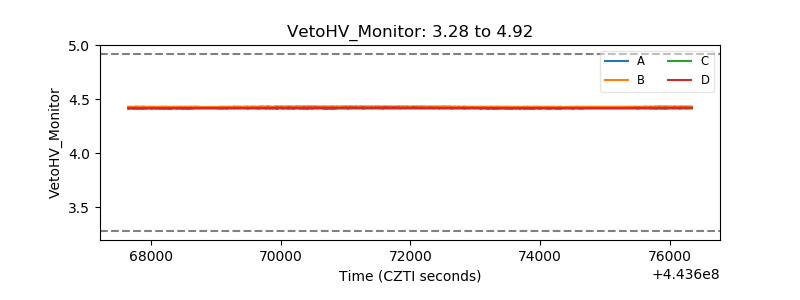 |
| Veto LLD | 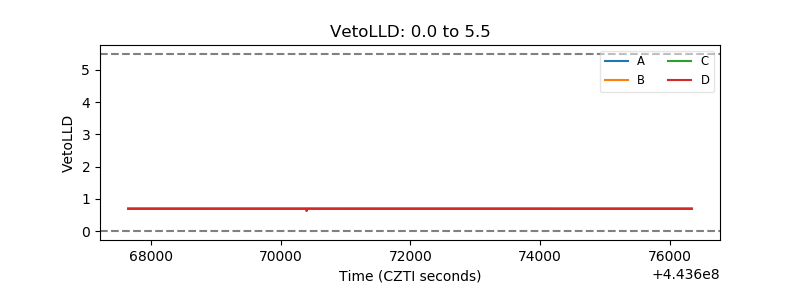 |
| Alpha Counter | 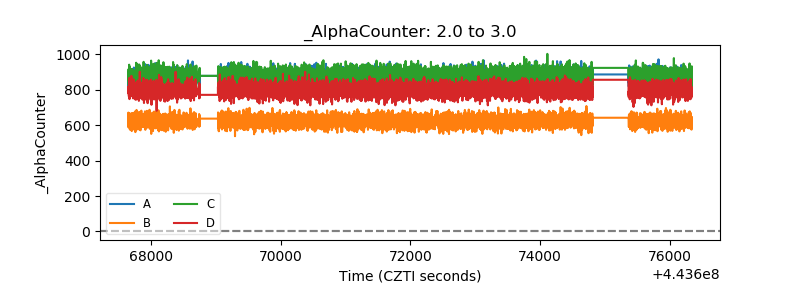 |
| _CPM_Rate | 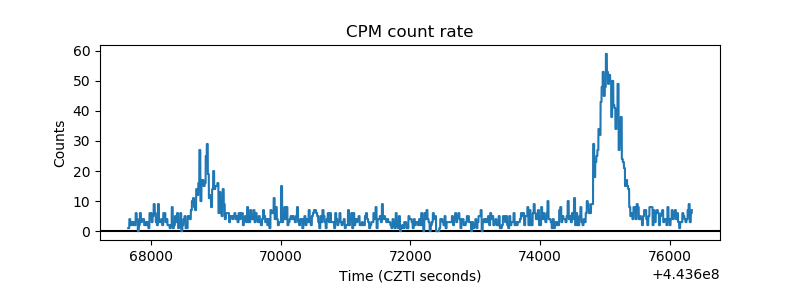 |
| CZT Counter | 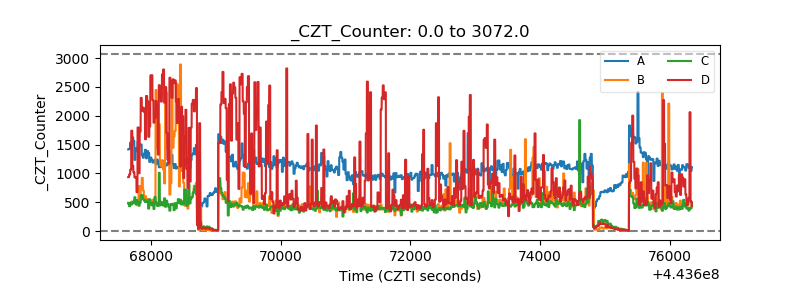 |
| +2.5 Volts monitor | 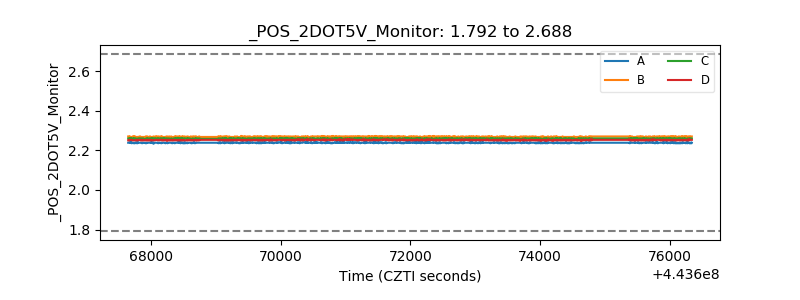 |
| +5 Volts monitor | 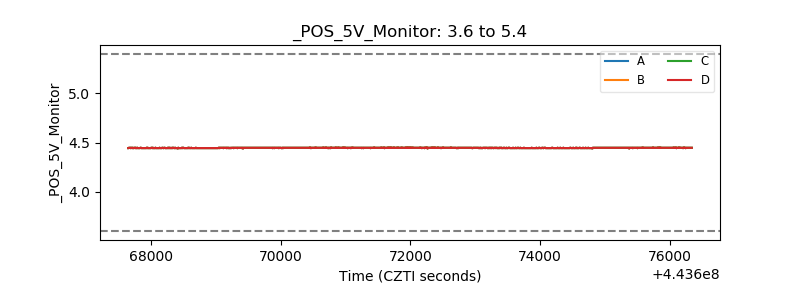 |
| _ROLL_ROT | 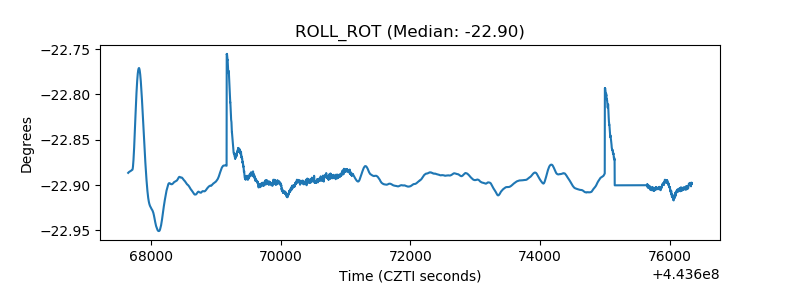 |
| _Roll_DEC | 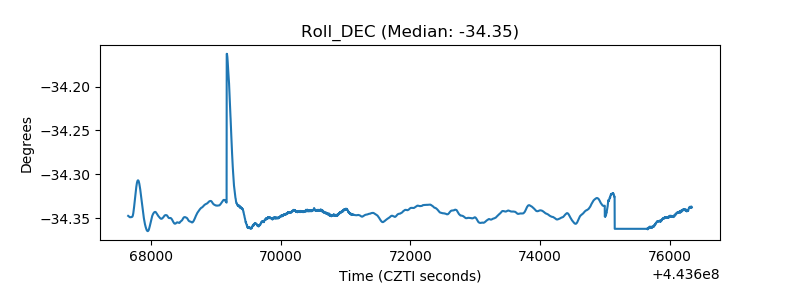 |
| _Roll_RA | 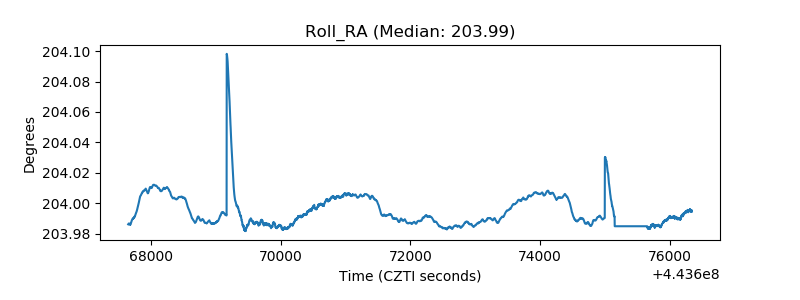 |
| Veto Counter | 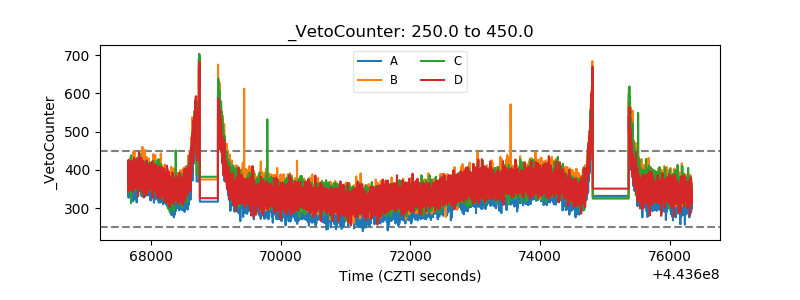 |